. 2019 Dec;21(12):1553-1564.
doi: 10.1038/s41556-019-0420-4. Epub 2019 Nov 25.

Diurnal oscillations of endogenous H2O2 sustained by p66Shc regulate circadian clocks

Affiliations

Diurnal oscillations of endogenous H2O2 sustained by p66Shc regulate circadian clocks

Jian-Fei Pei et al. Nat Cell Biol. 2019 Dec.

Abstract

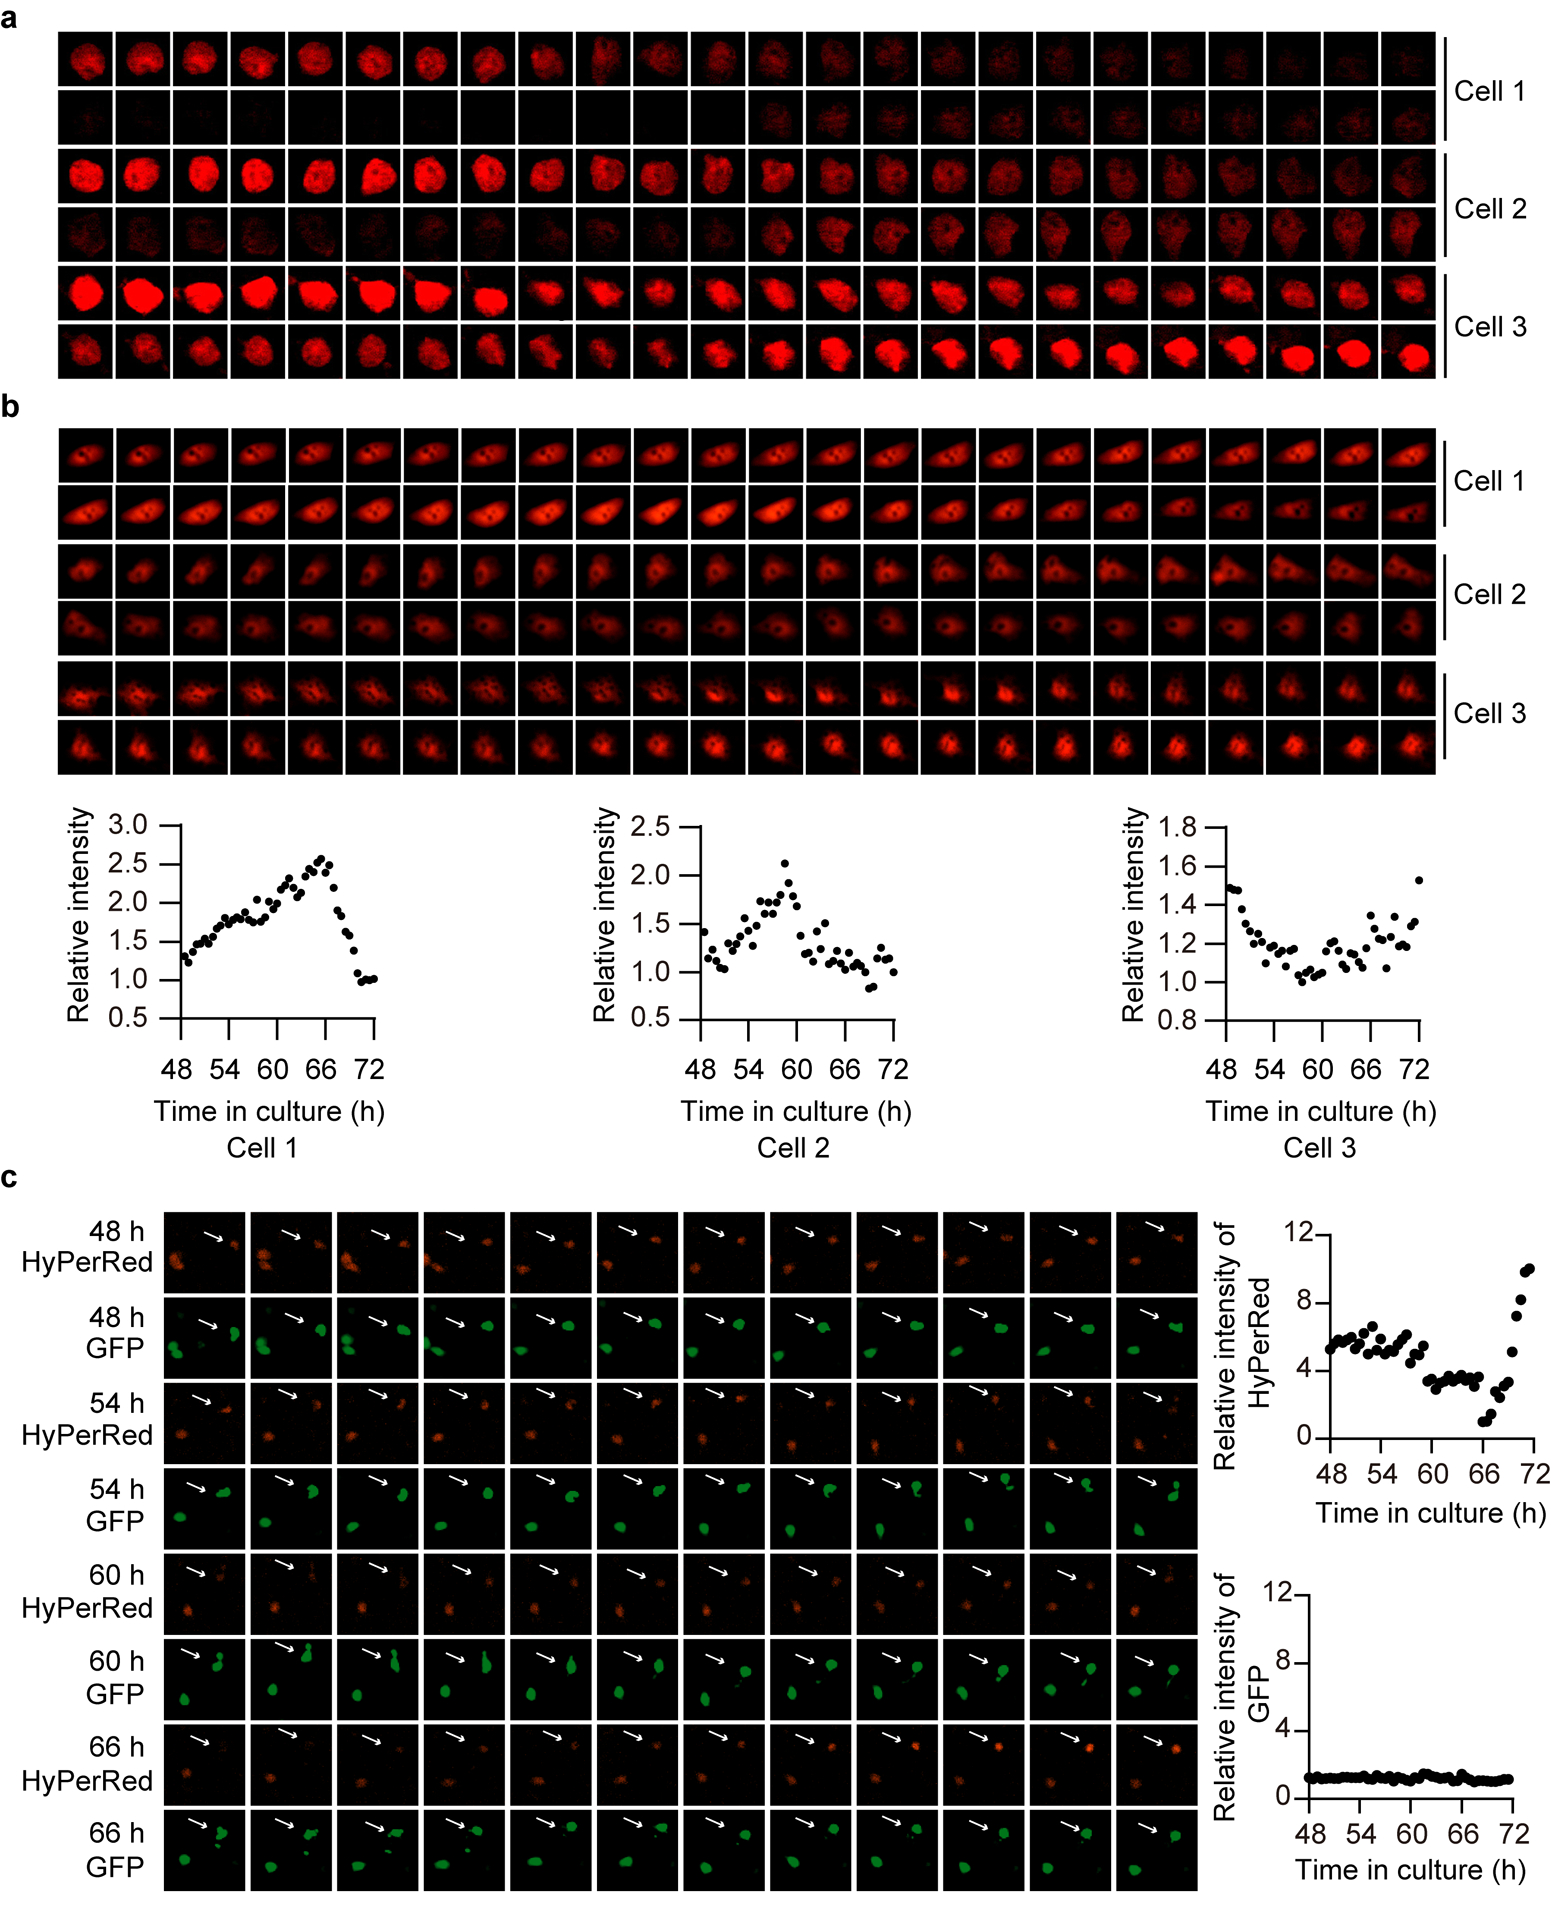
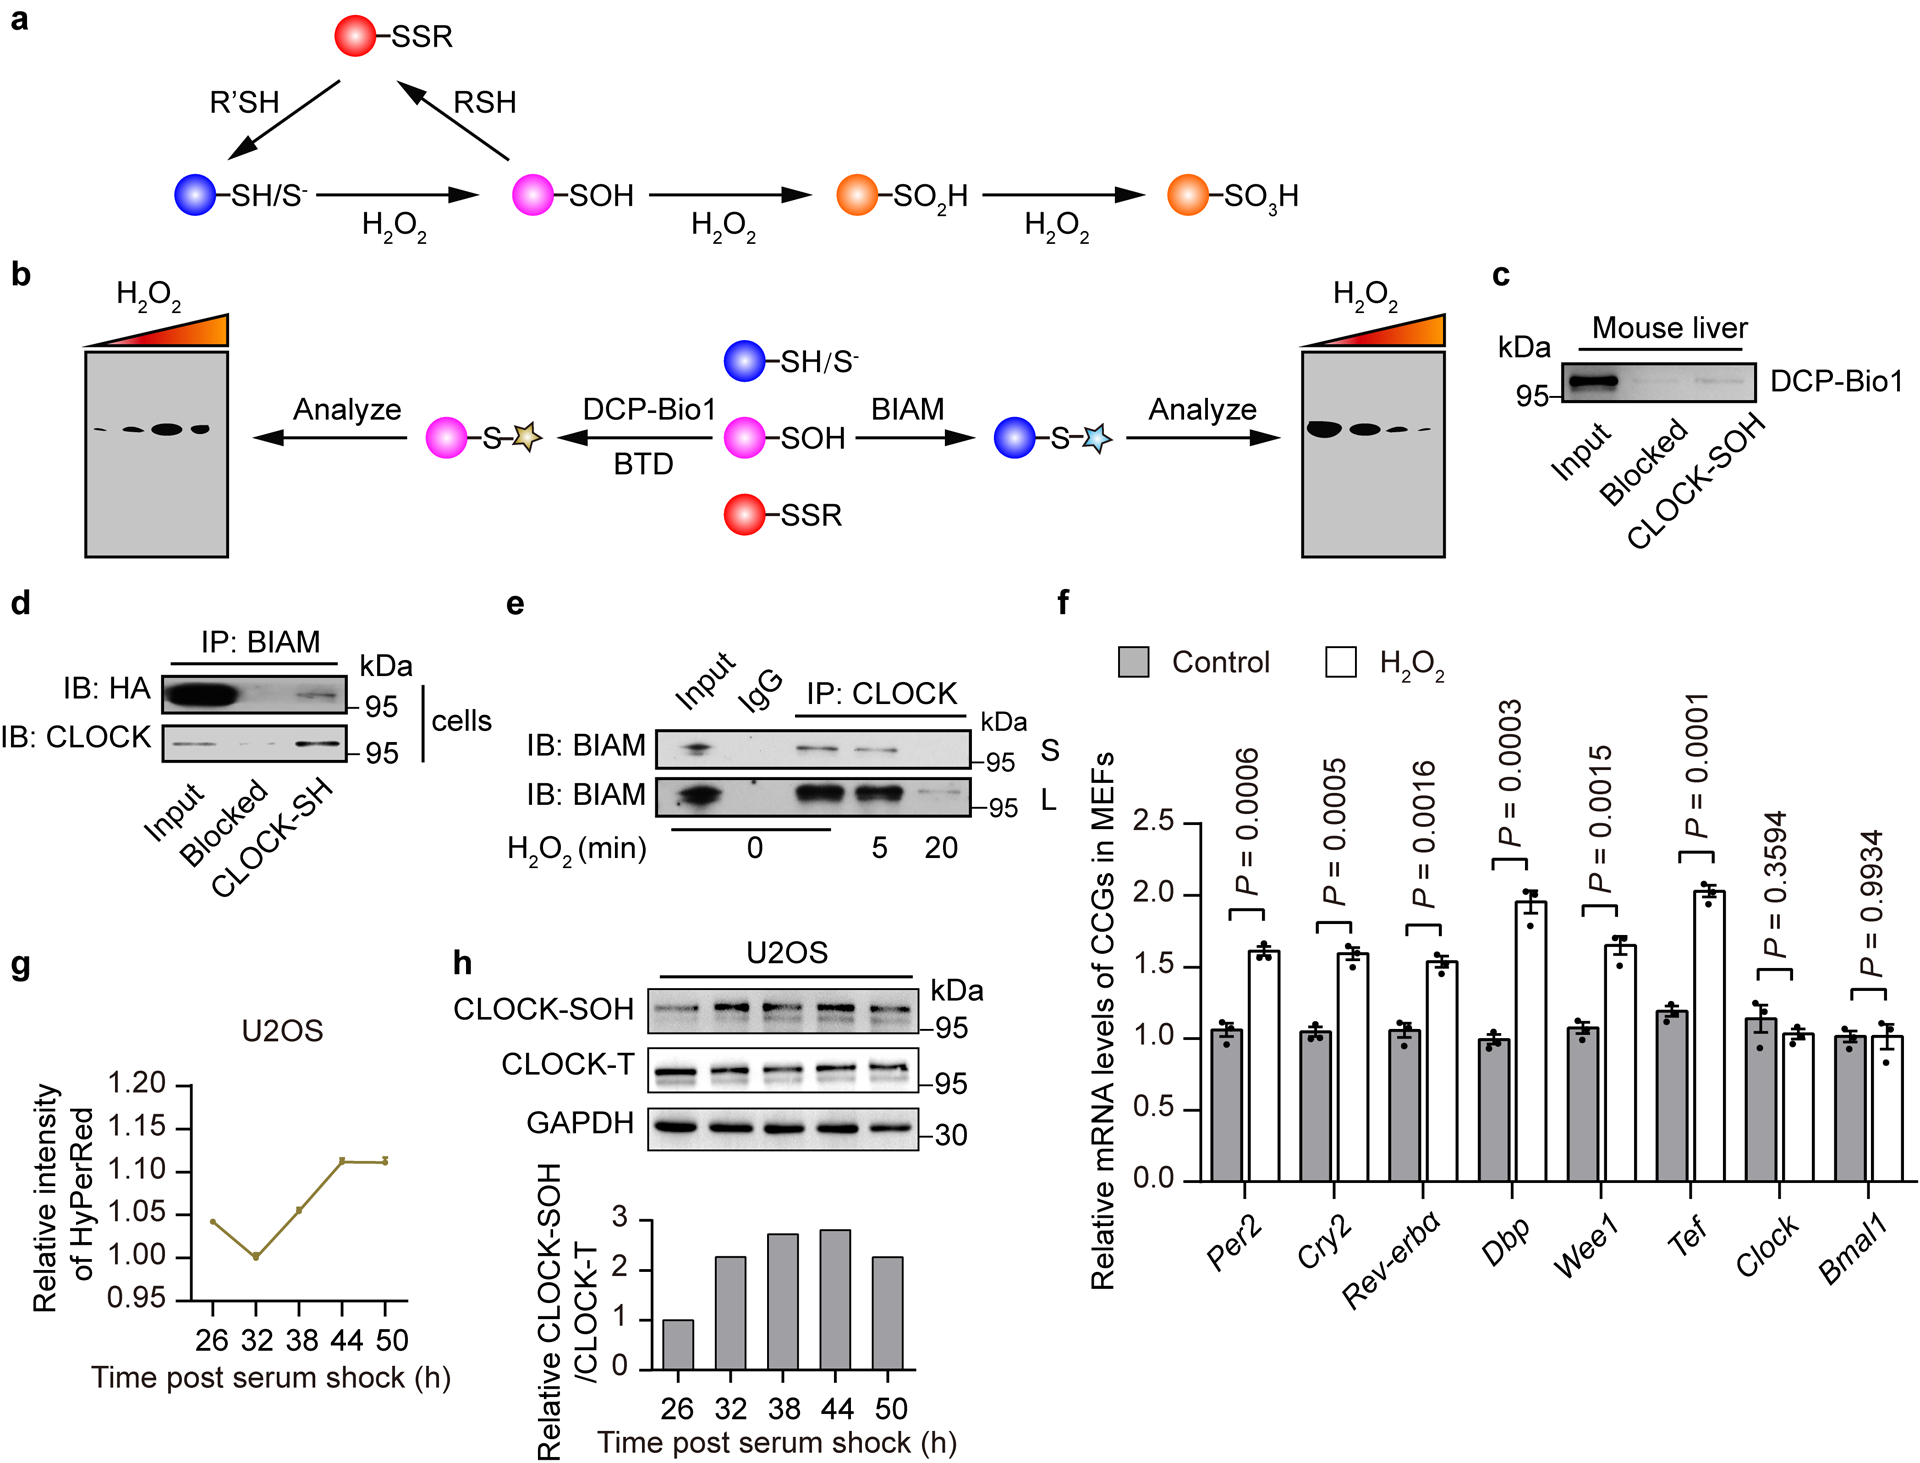
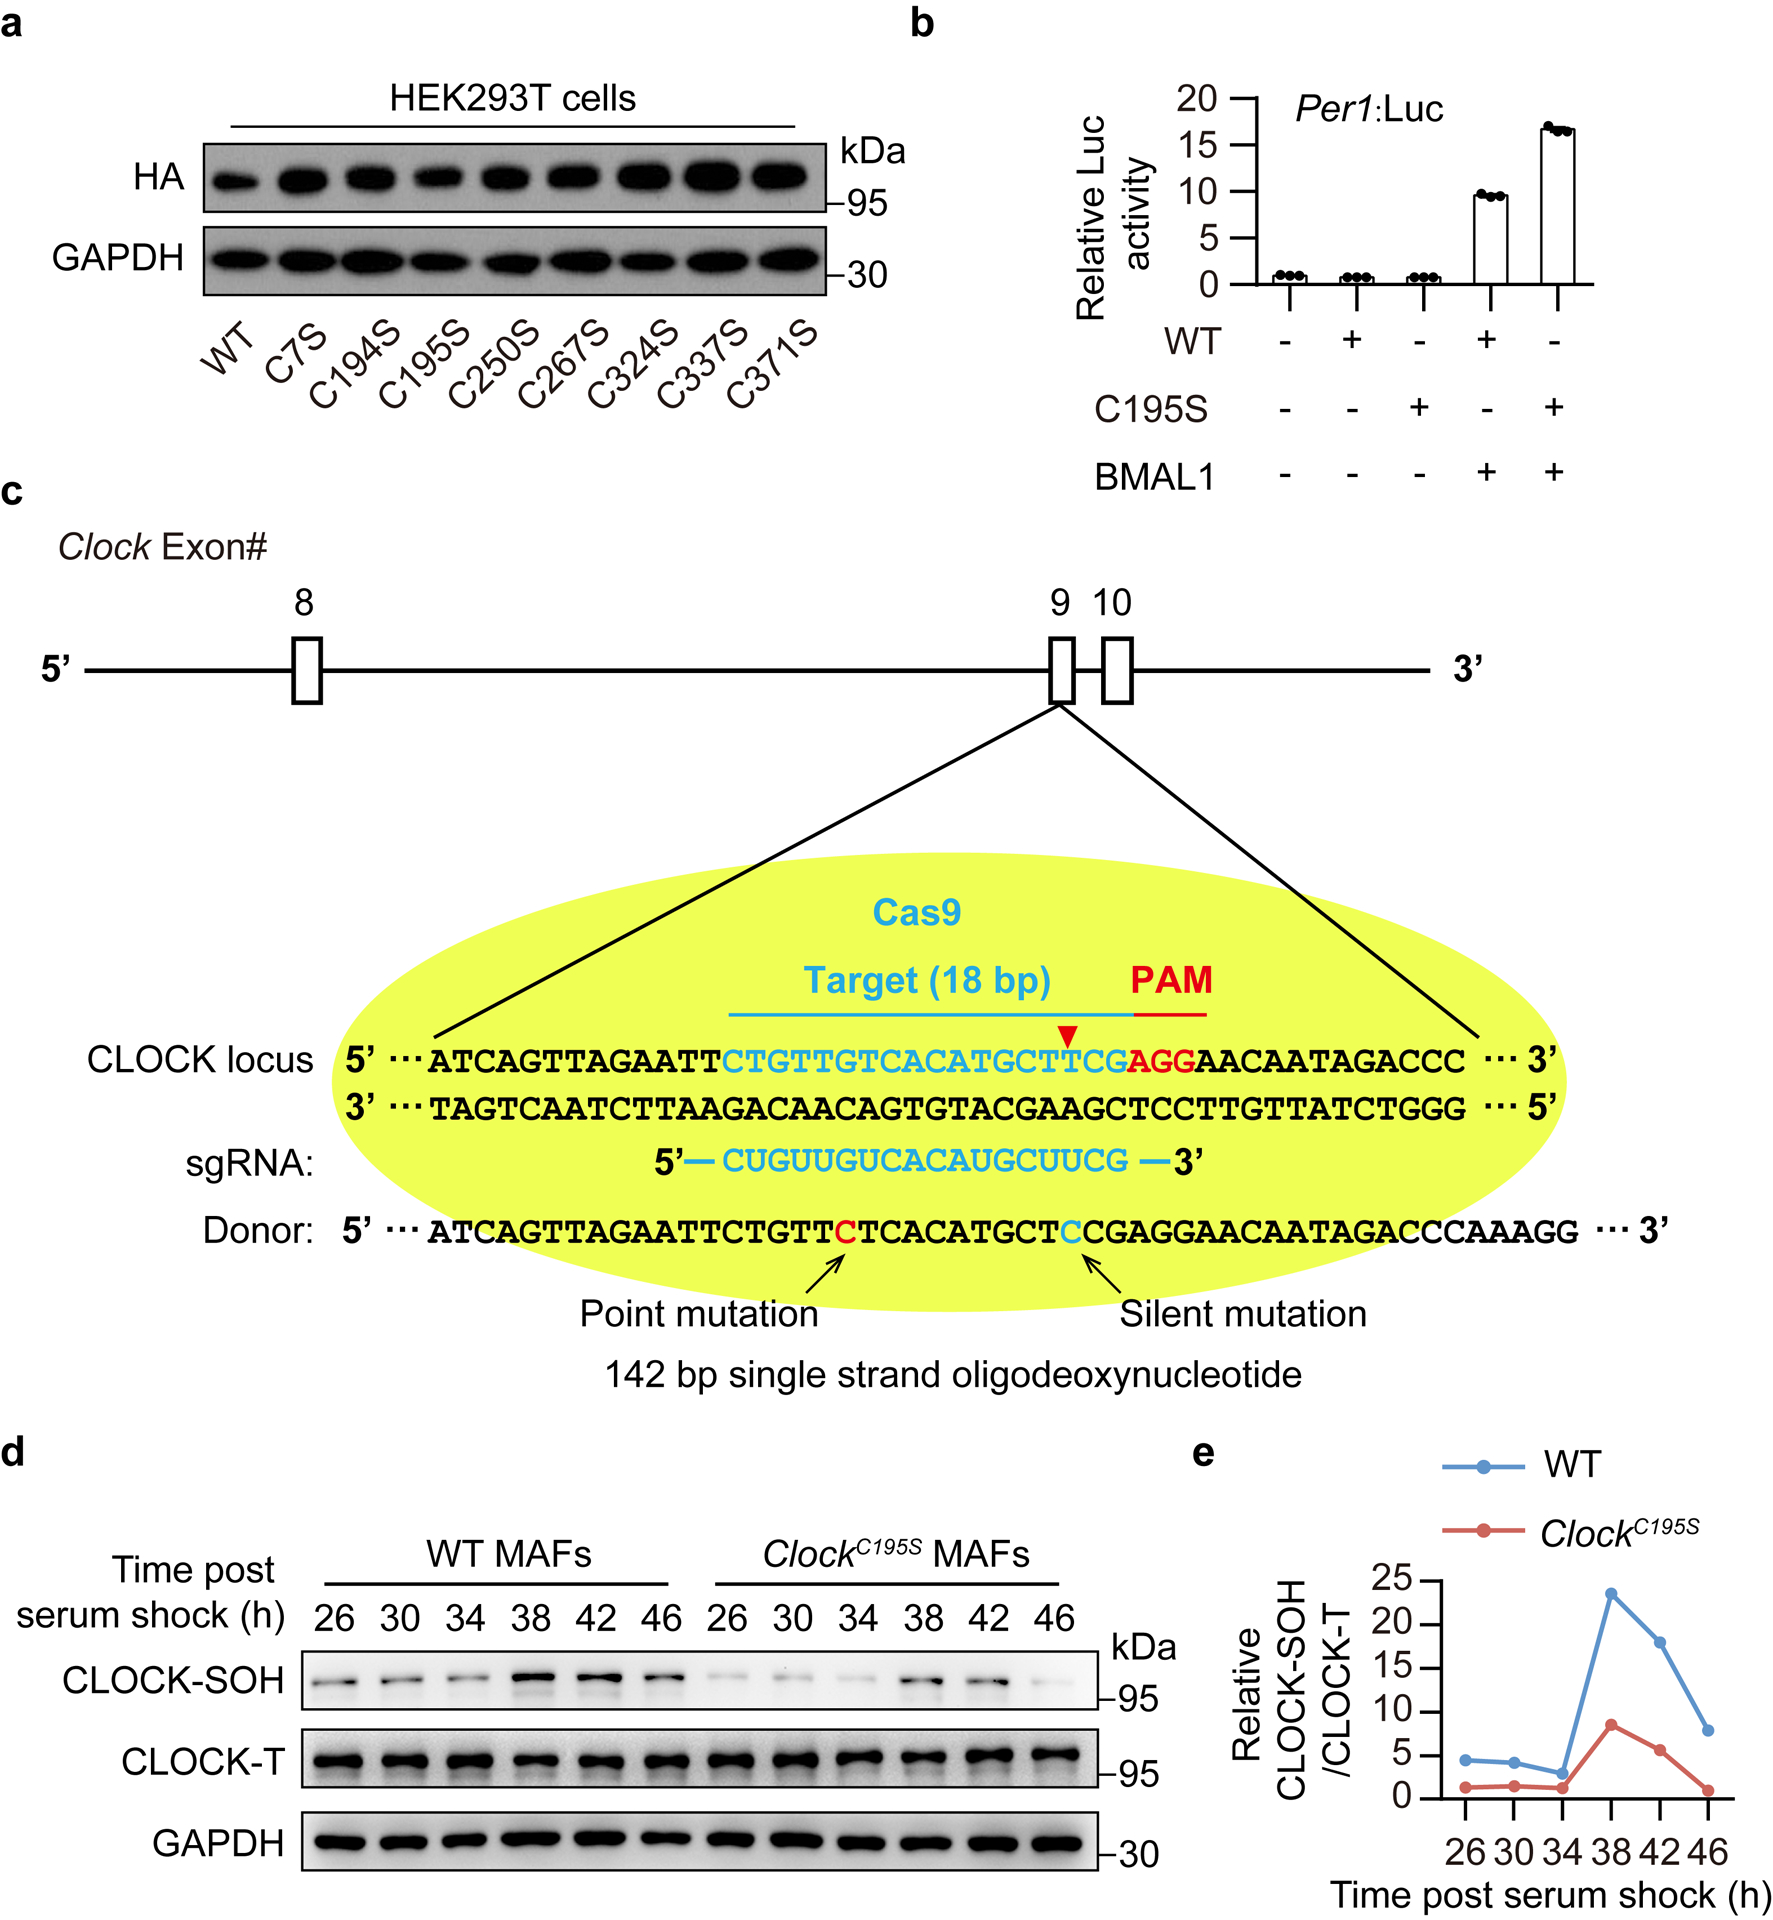
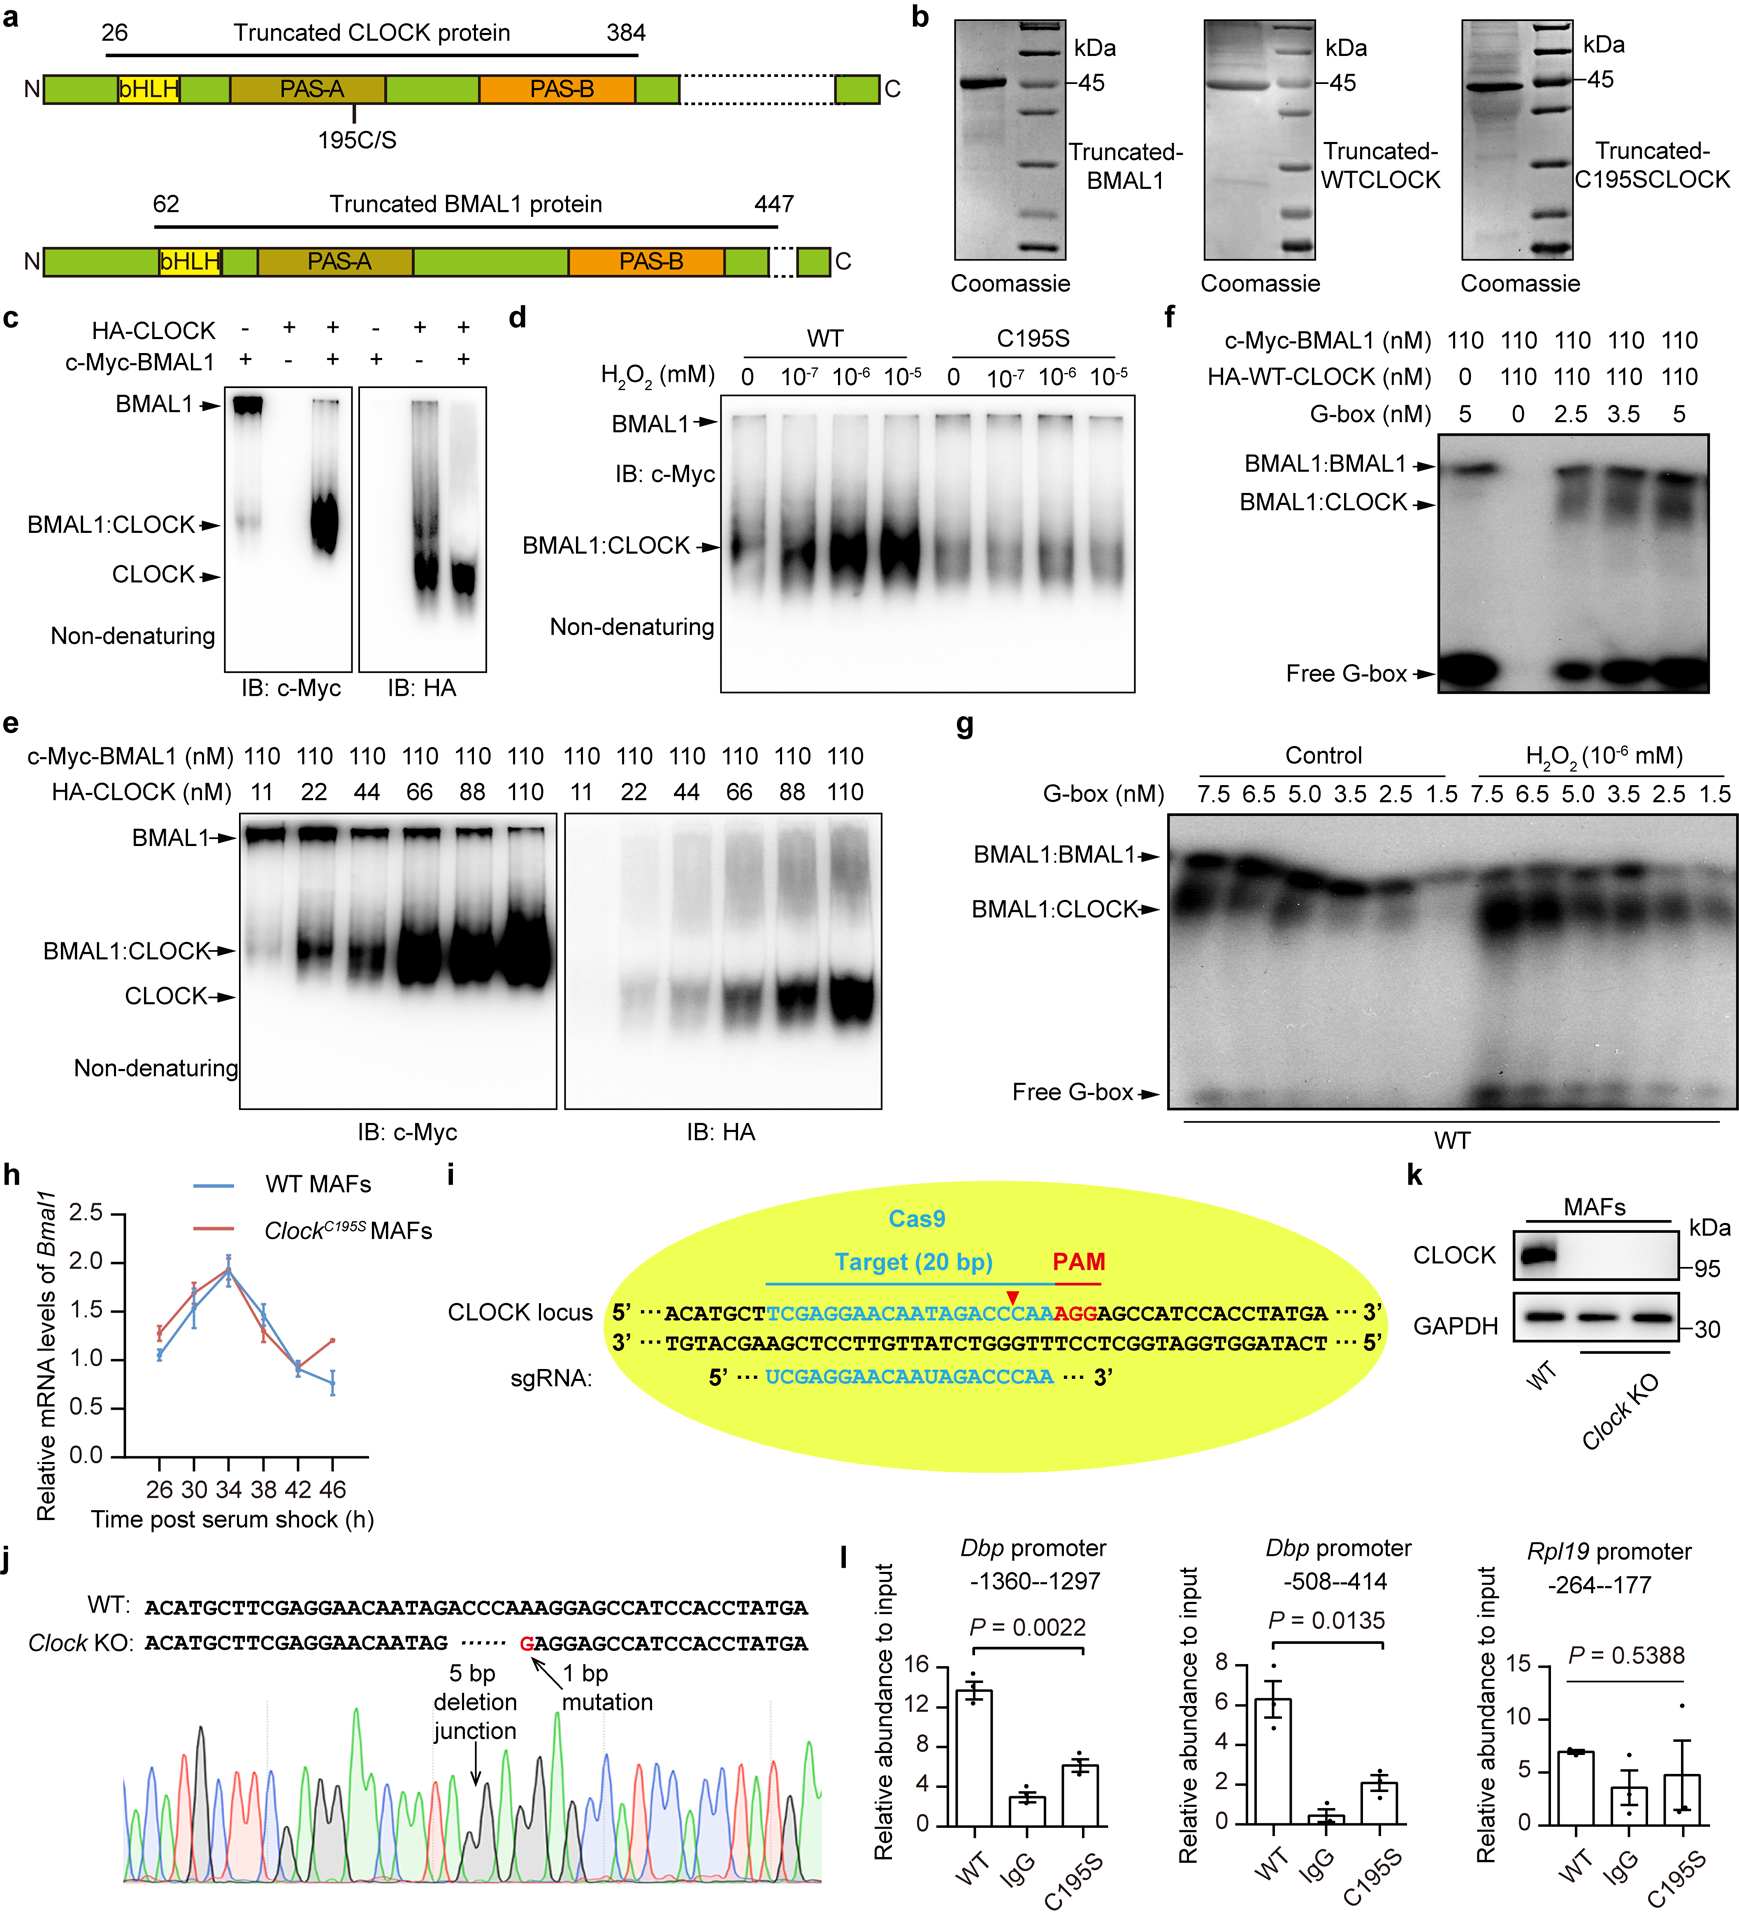
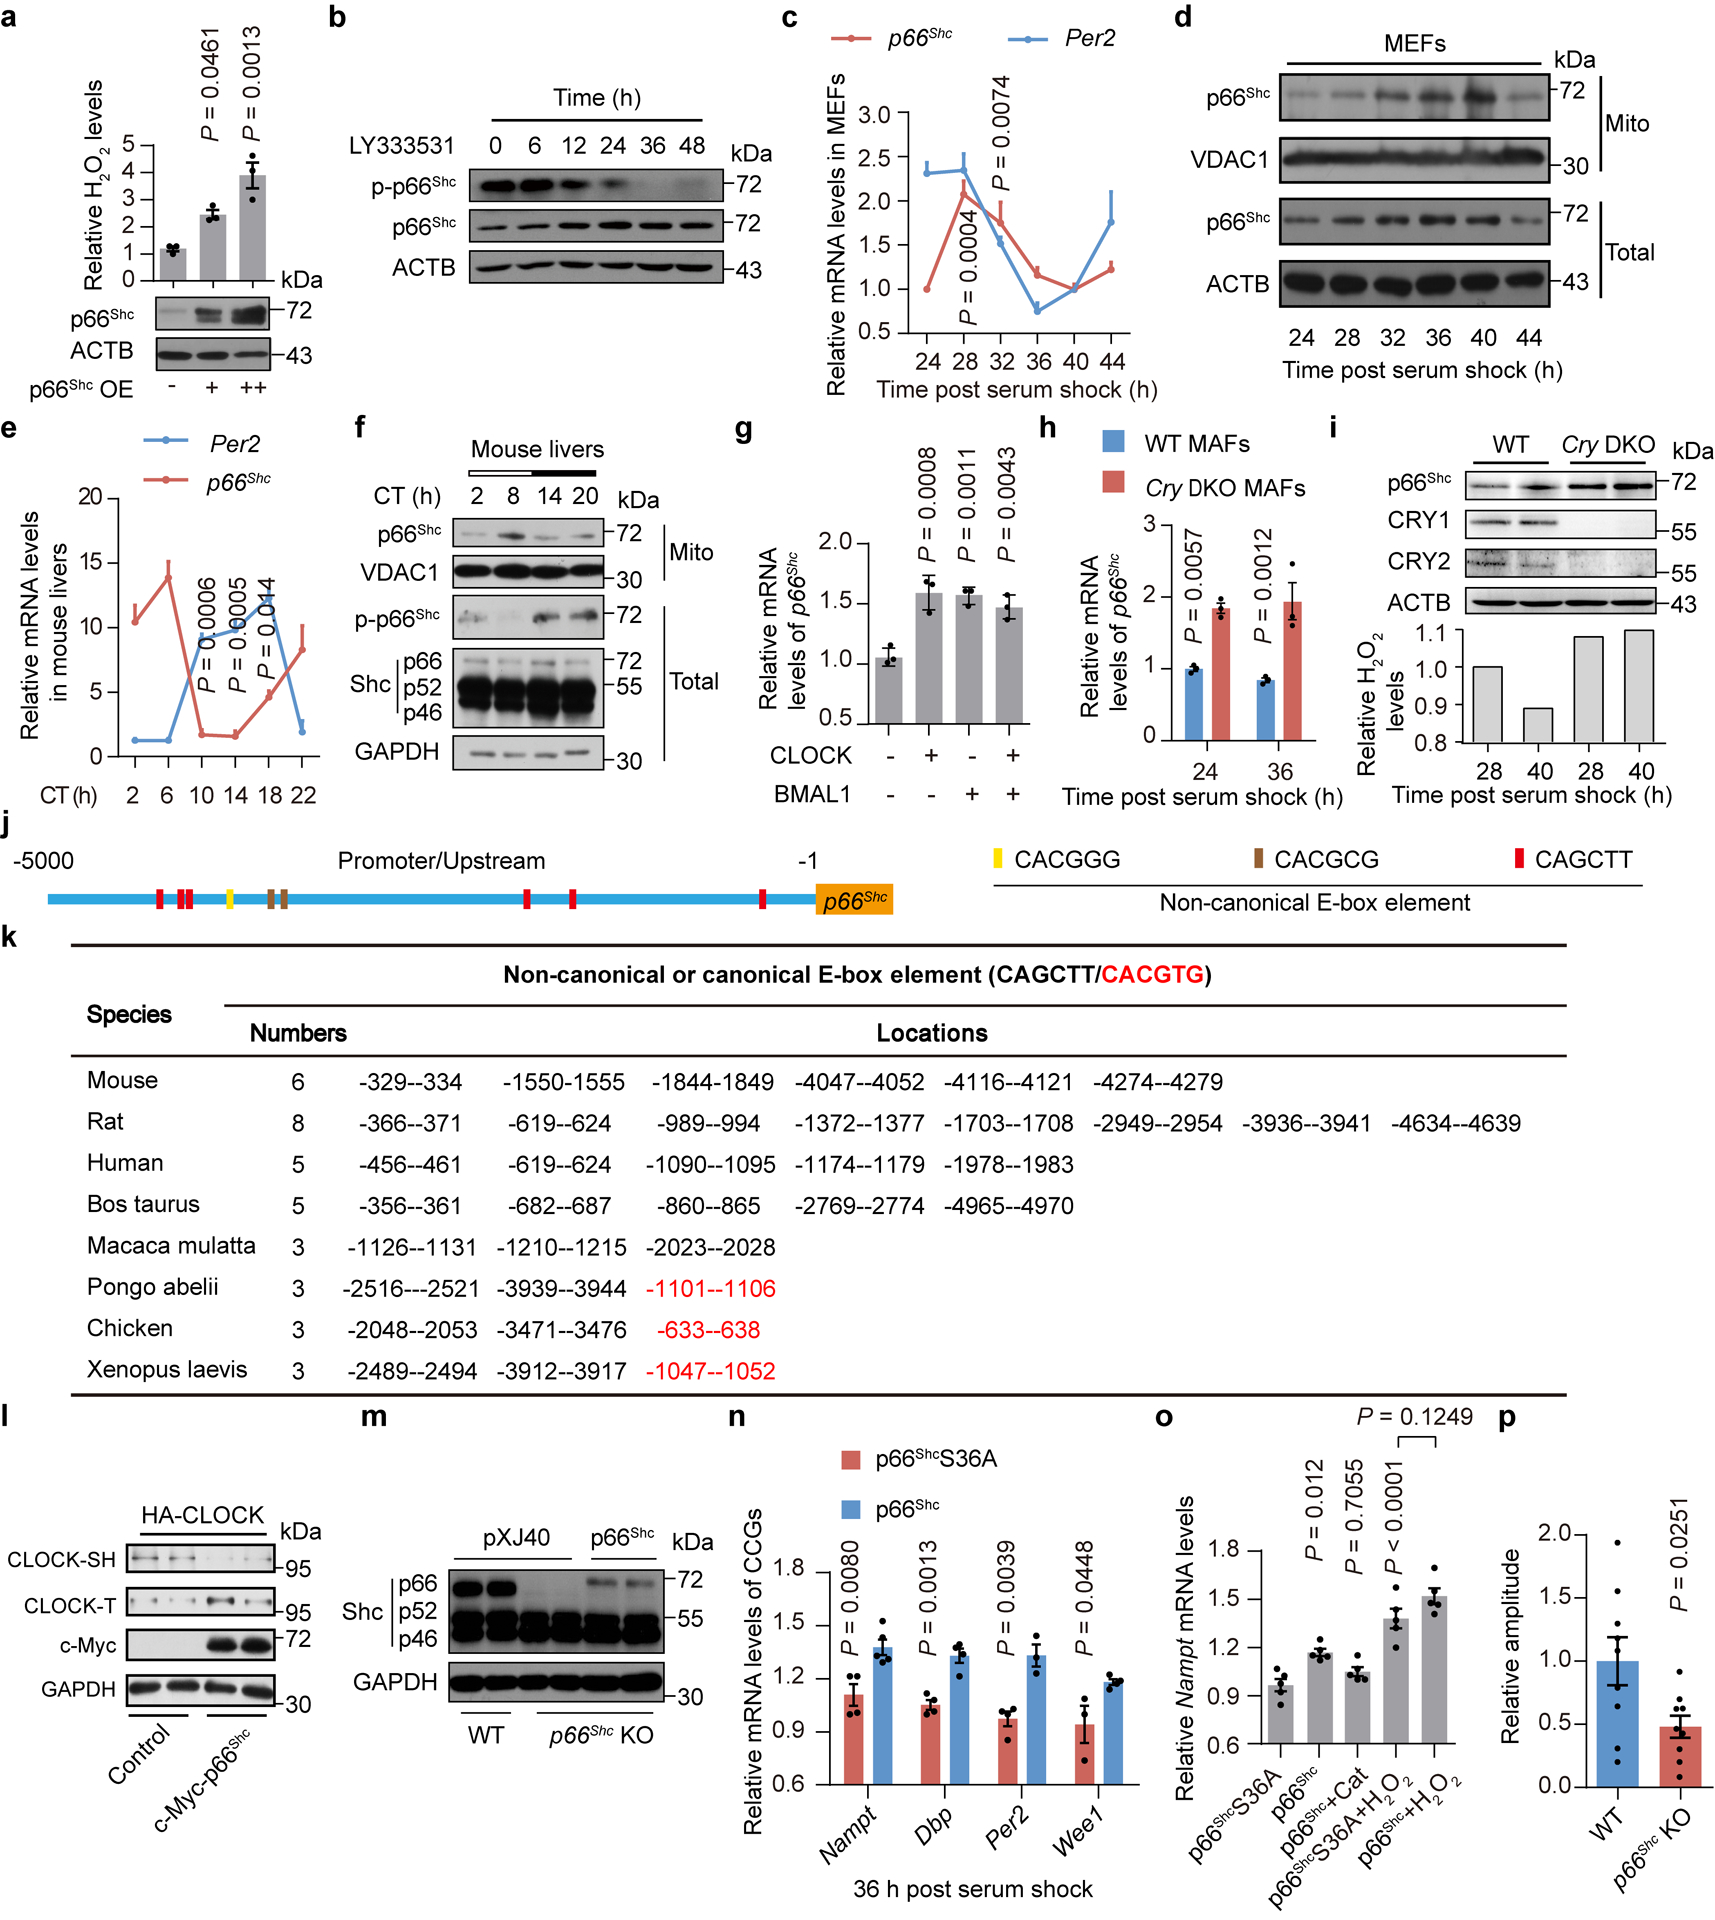
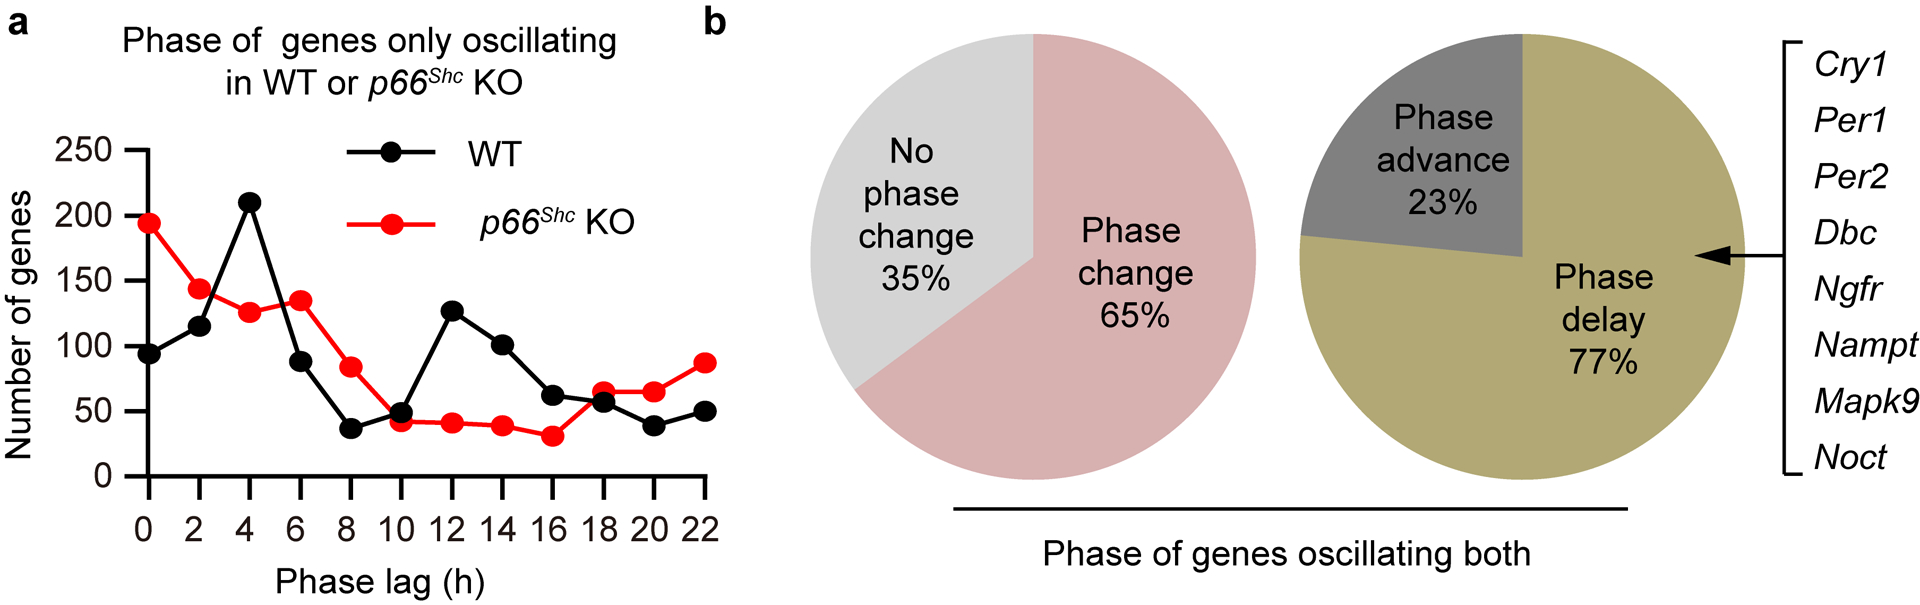
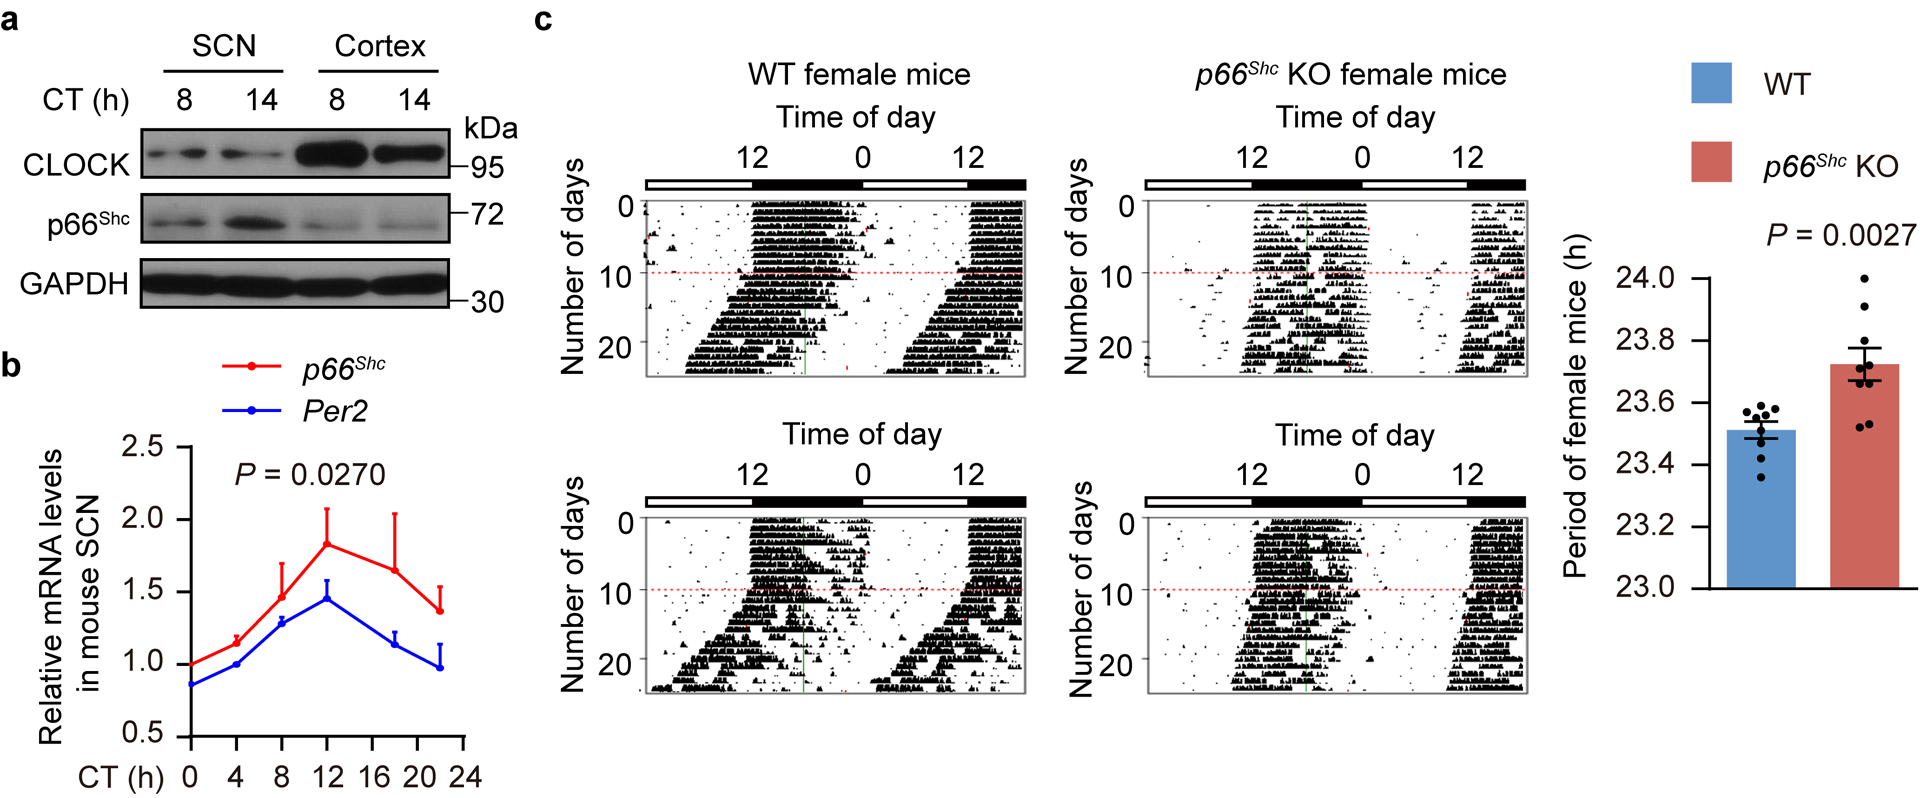
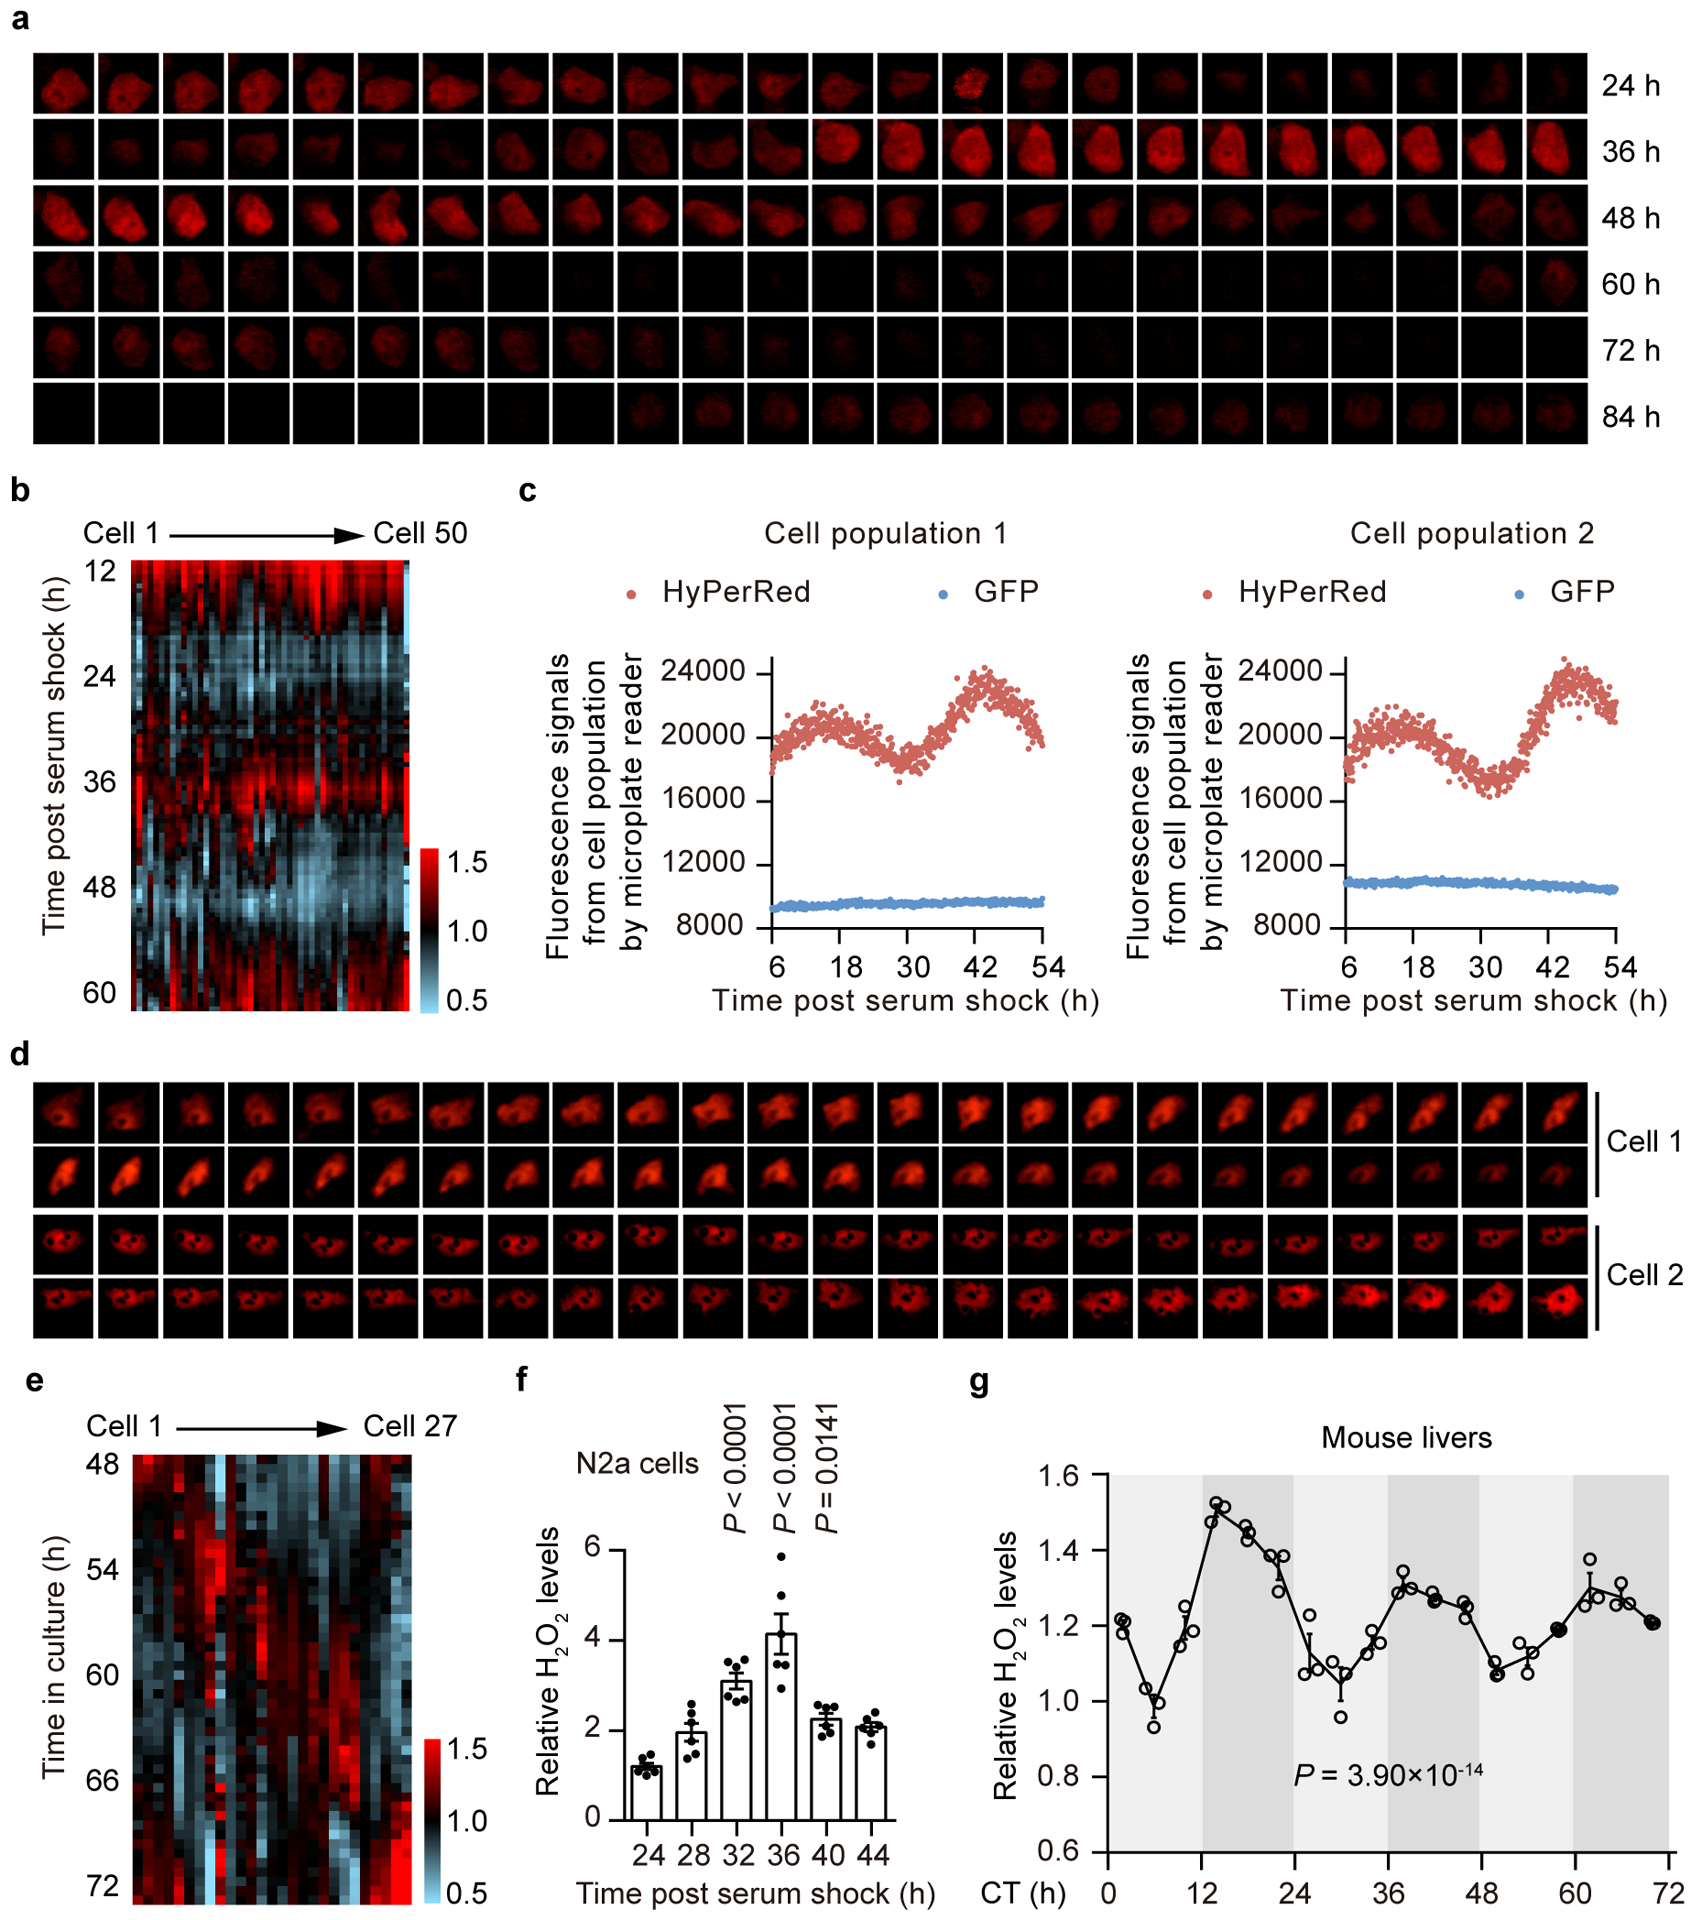
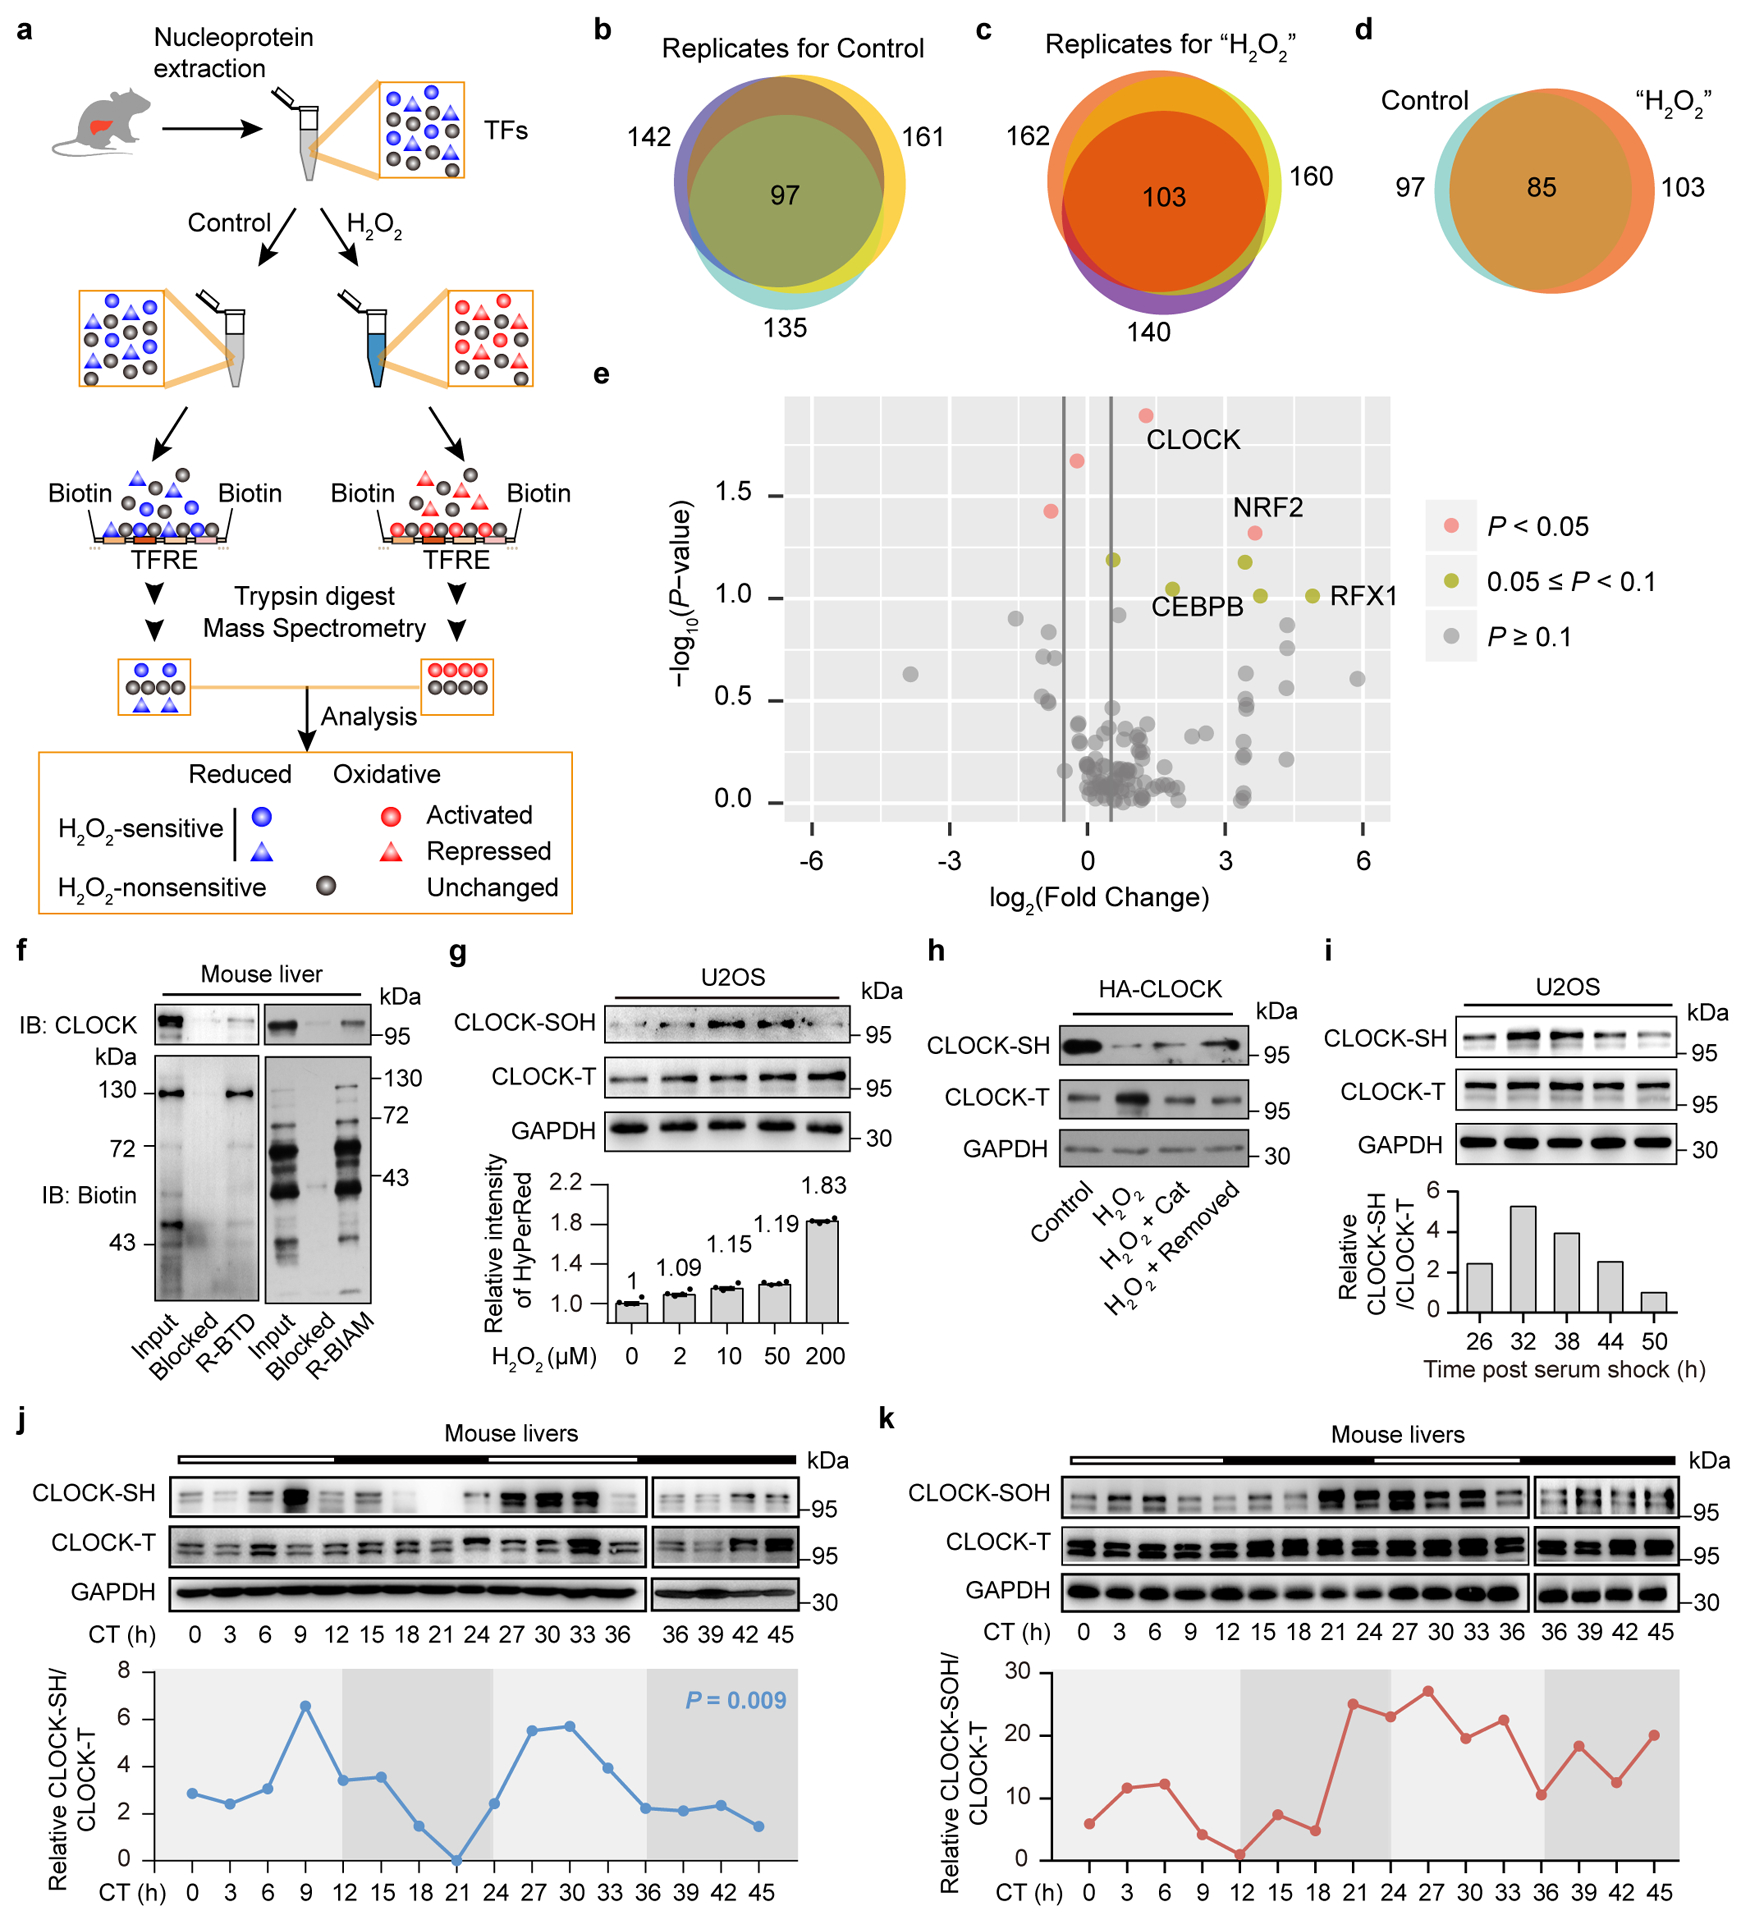
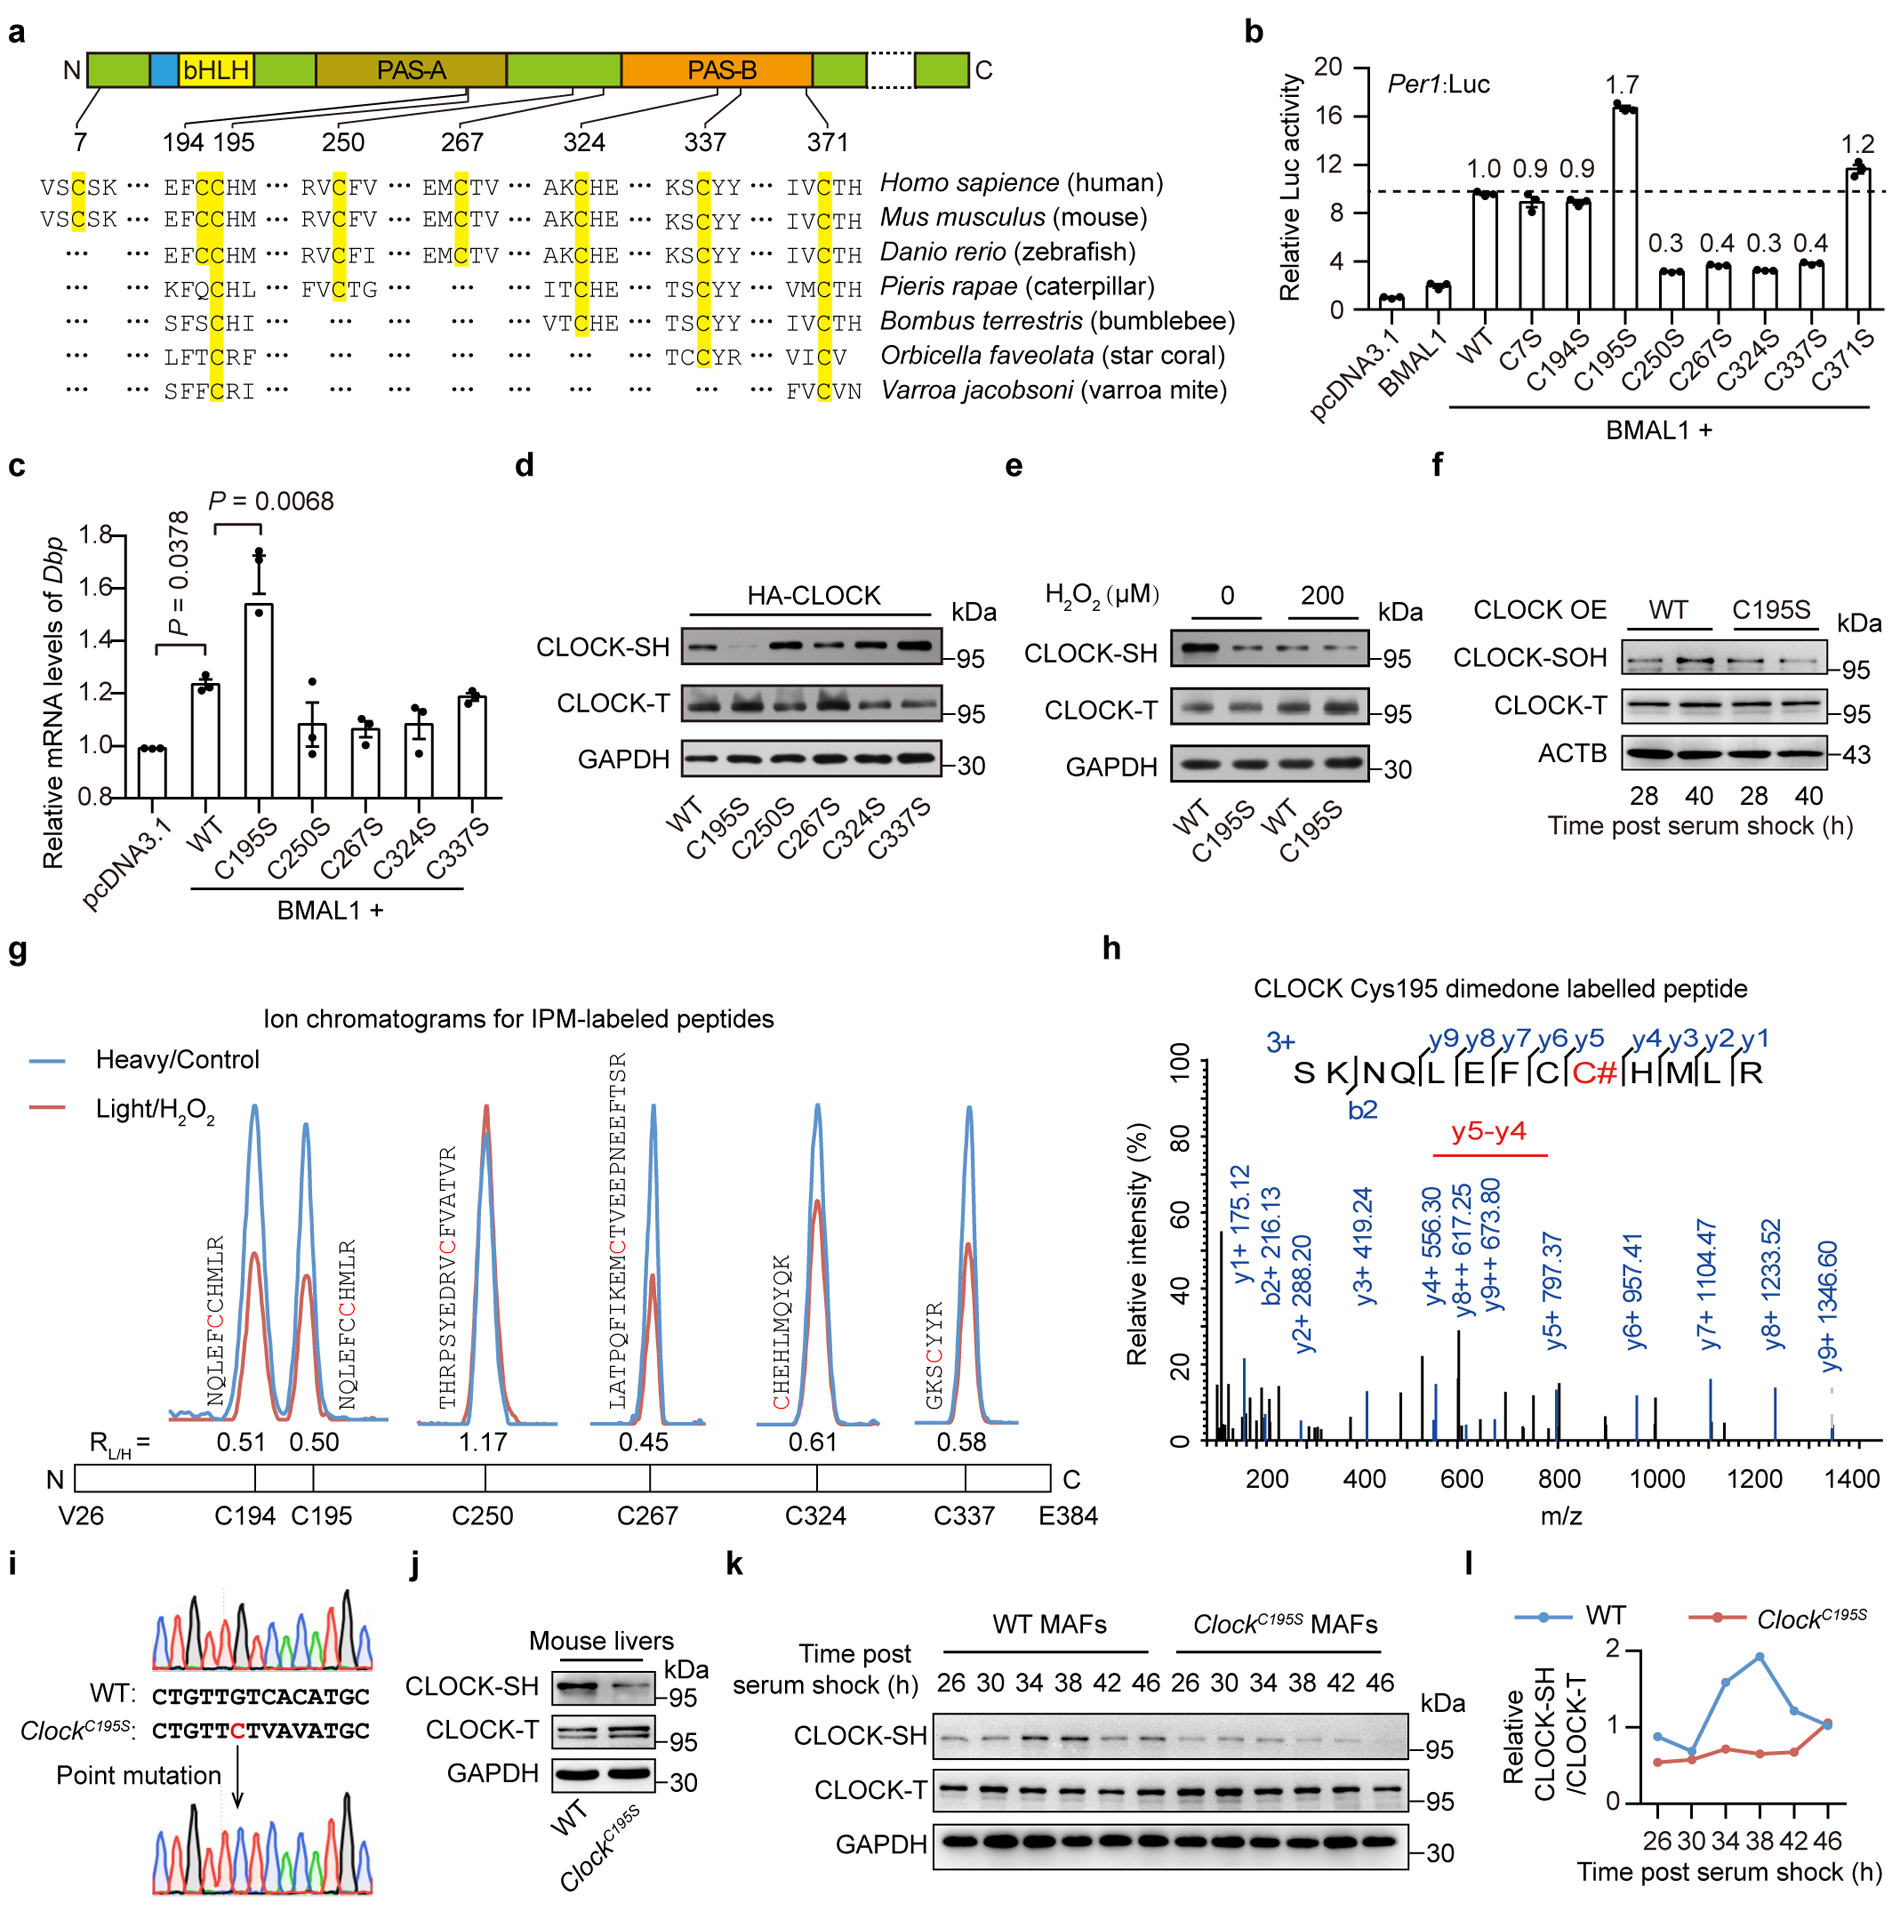
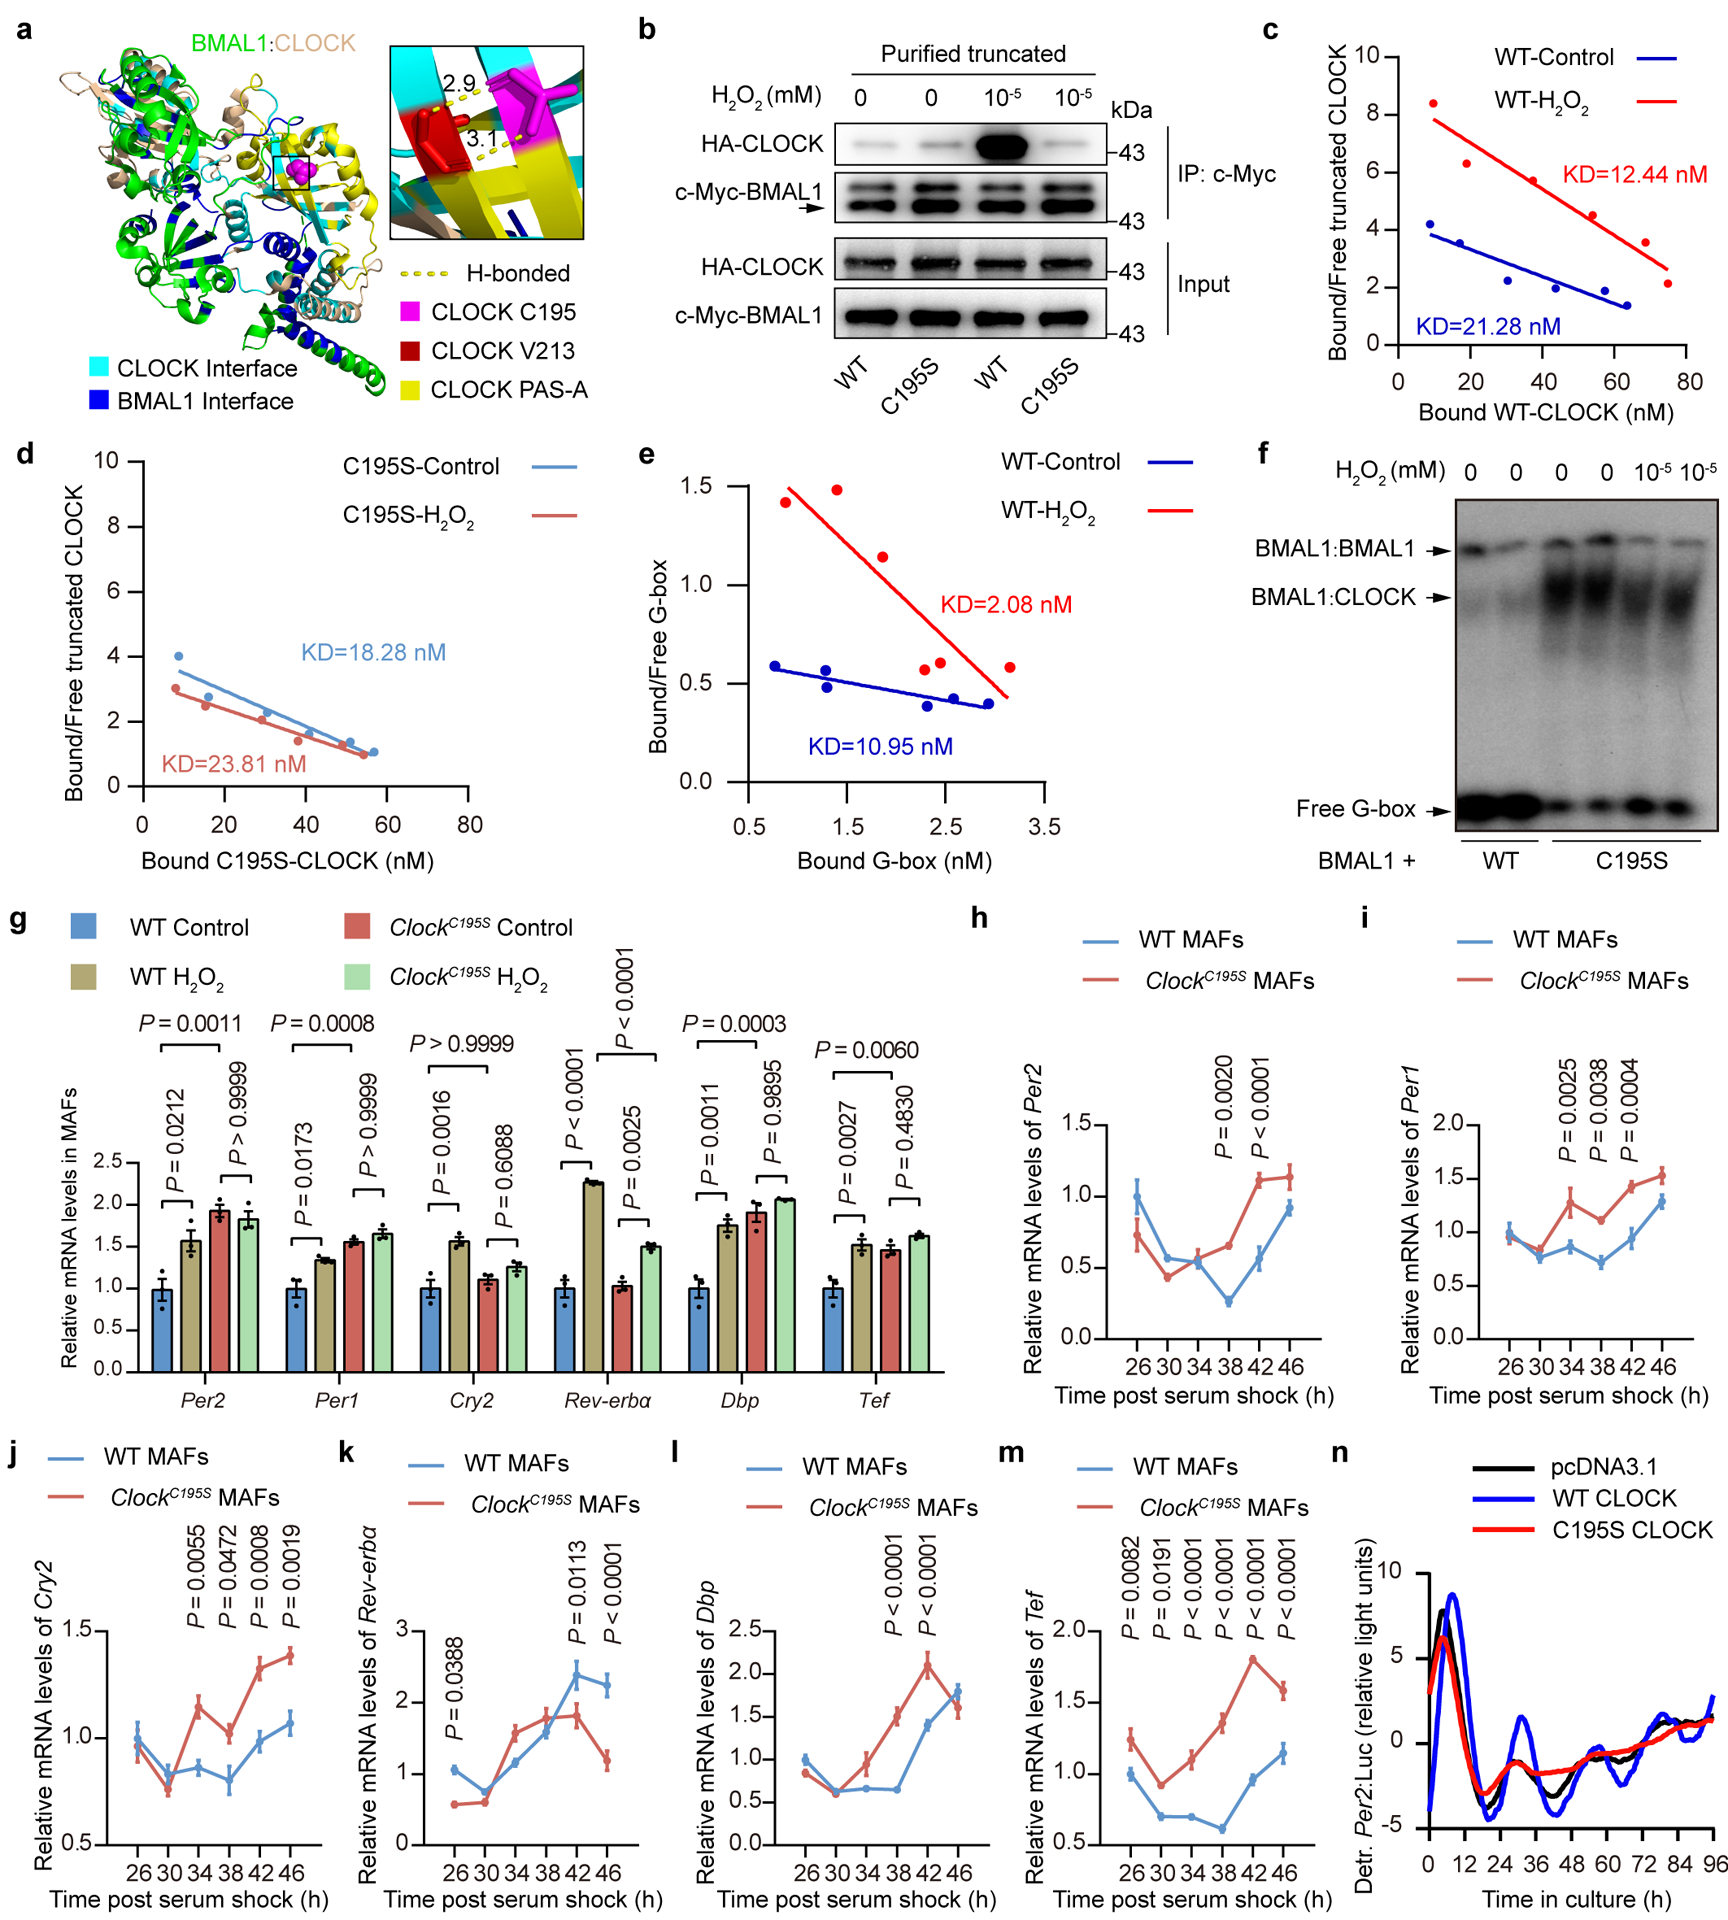
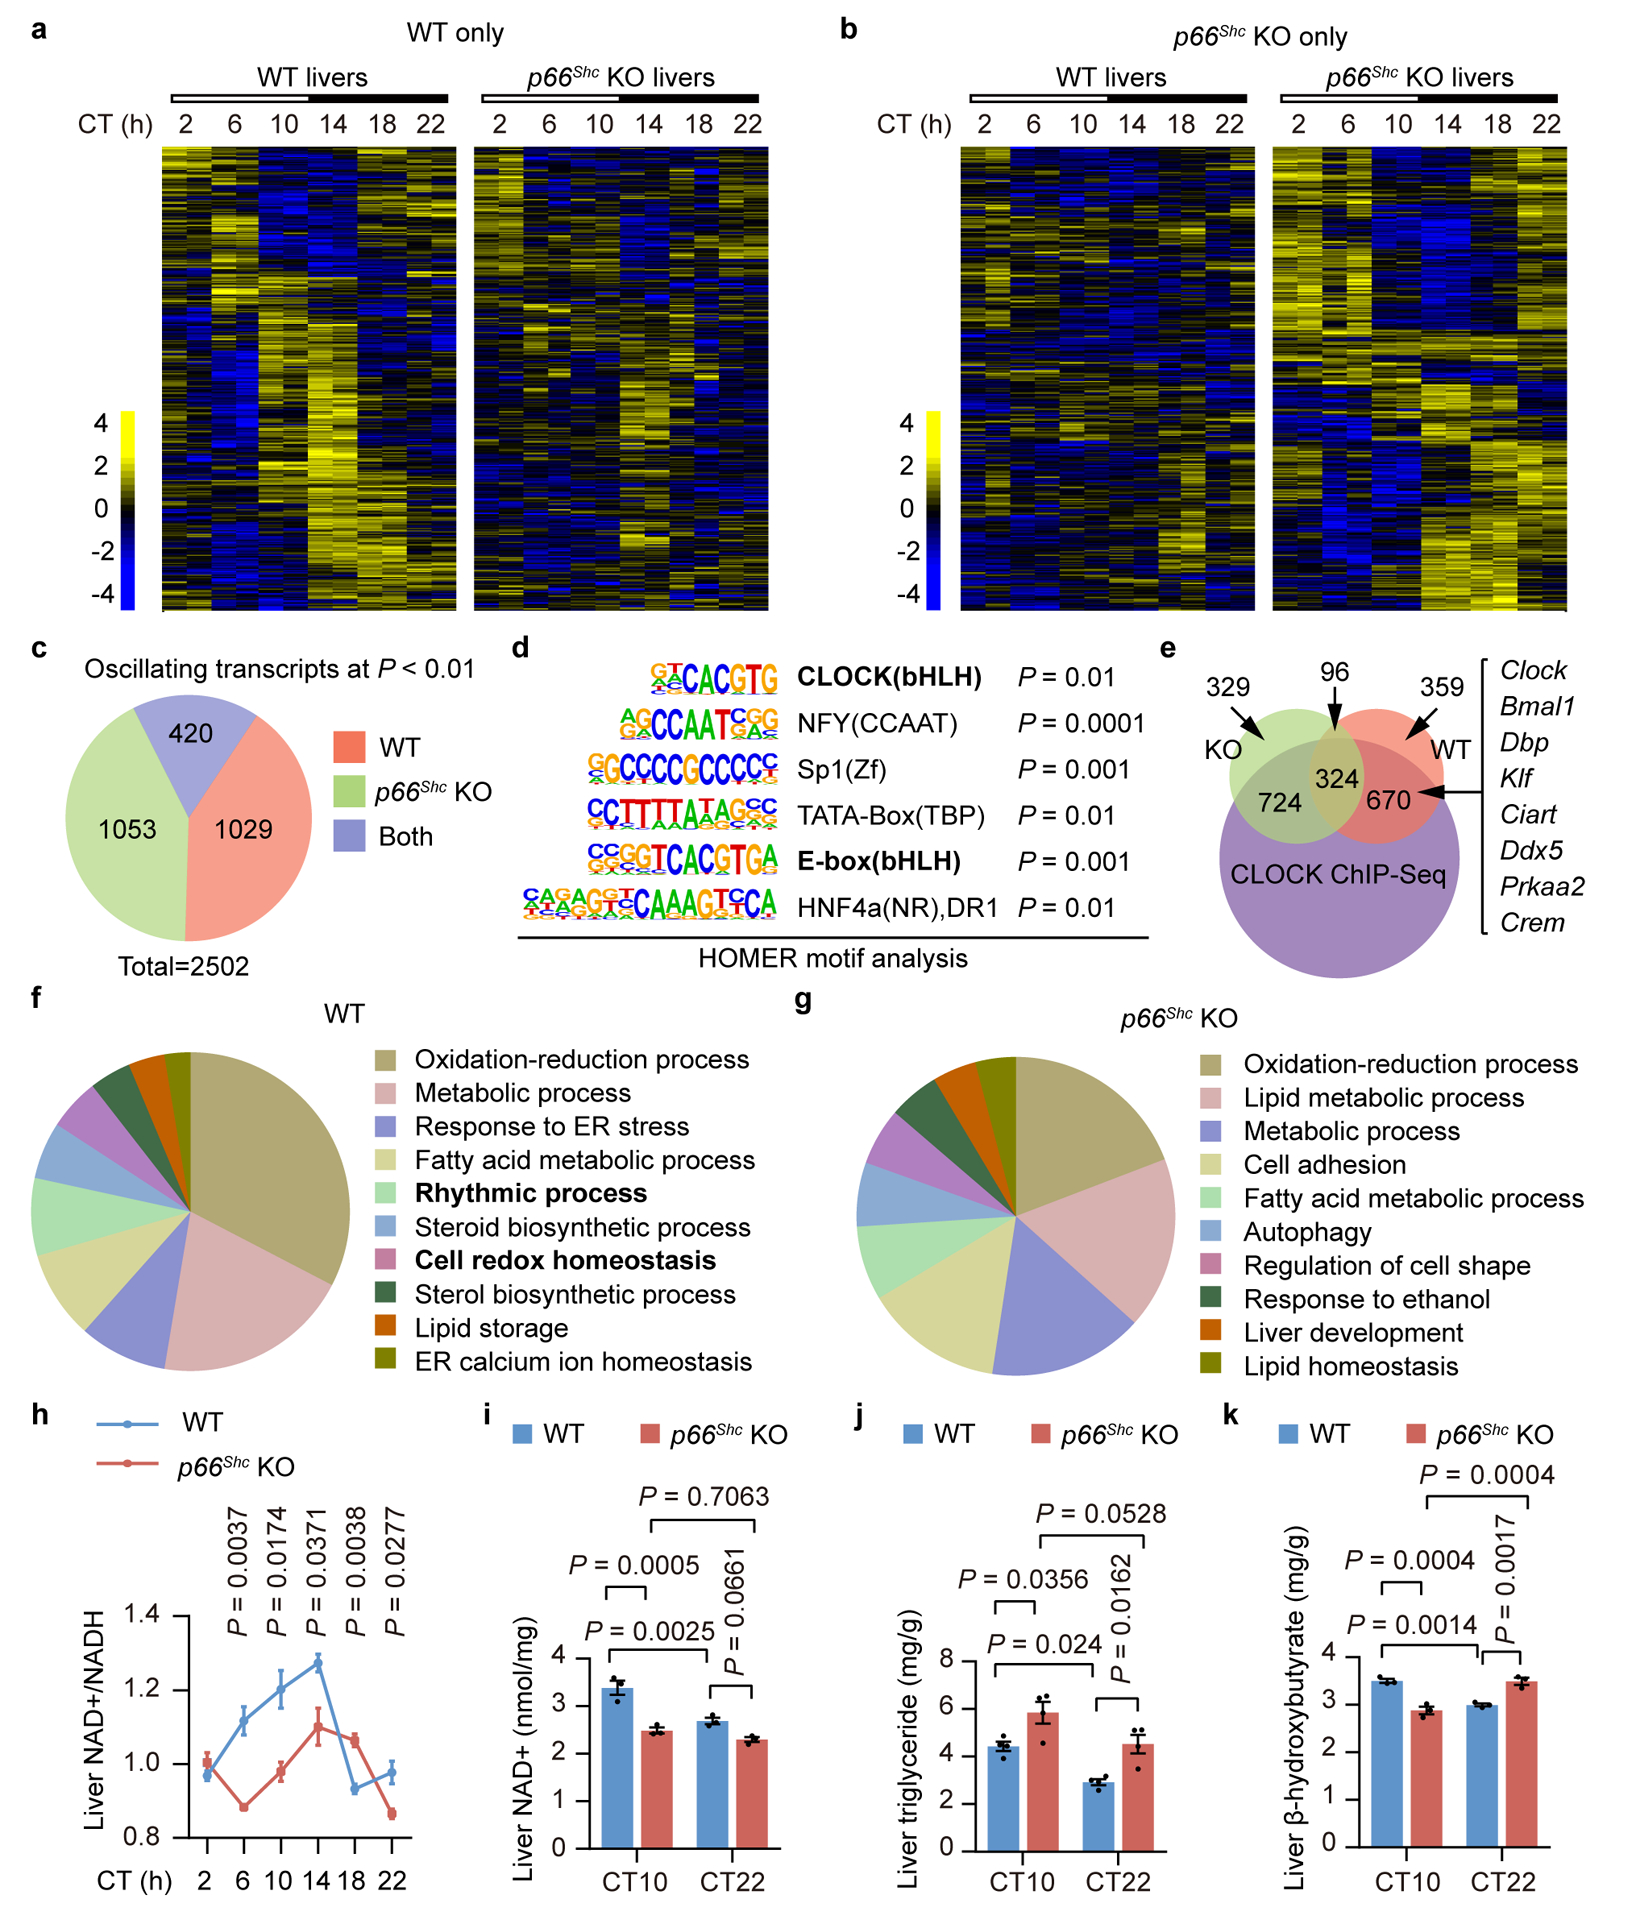
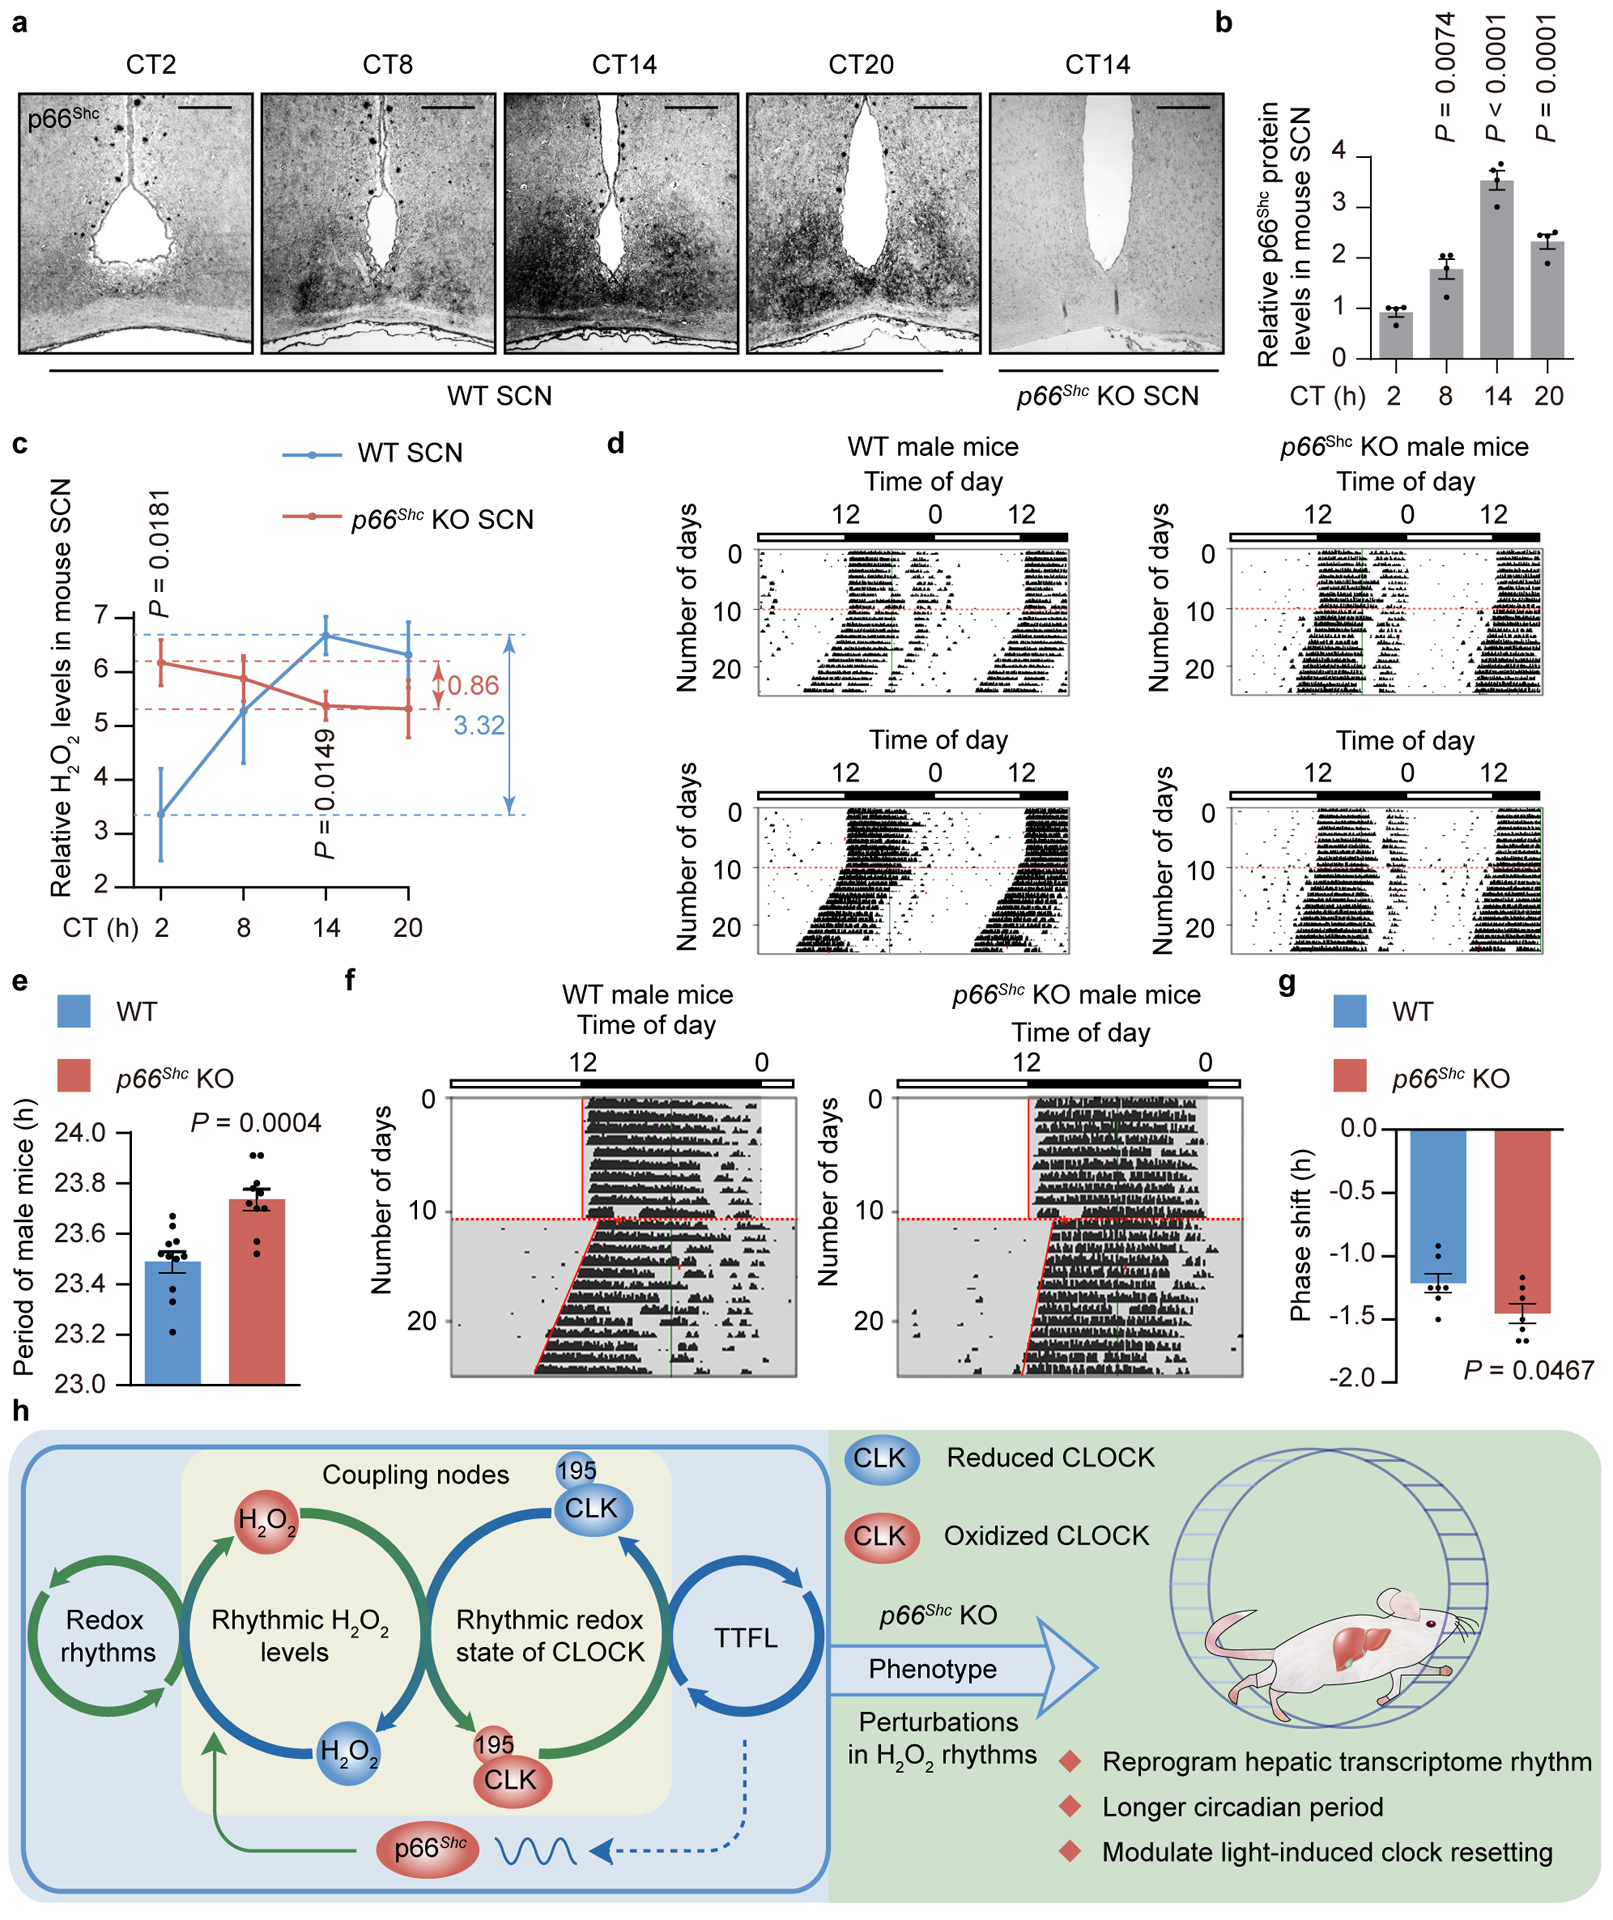
Redox balance, an essential feature of healthy physiological steady states, is regulated by circadian clocks, but whether or how endogenous redox signalling conversely regulates clockworks in mammals remains unknown. Here, we report circadian rhythms in the levels of endogenous H2O2 in mammalian cells and mouse livers. Using an unbiased method to screen for H2O2-sensitive transcription factors, we discovered that rhythmic redox control of CLOCK directly by endogenous H2O2 oscillations is required for proper intracellular clock function. Importantly, perturbations in the rhythm of H2O2 levels induced by the loss of p66Shc, which oscillates rhythmically in the liver and suprachiasmatic nucleus (SCN) of mice, disturb the rhythmic redox control of CLOCK function, reprogram hepatic transcriptome oscillations, lengthen the circadian period in mice and modulate light-induced clock resetting. Our findings suggest that redox signalling rhythms are intrinsically coupled to the circadian system through reversible oxidative modification of CLOCK and constitute essential mechanistic timekeeping components in mammals.


Conflict of interest statement

Competing interests

The authors declare no competing interests.

Figures

Extended Data Figure 1.
Extended Data Figure 1.. Endogenous H2O2 levels oscillate rhythmically in cells.
a, Time-lapse microscopy of circadian HyPerRed fluorescence in three individual cells for one day post-serum shock. N2a cells were transfected with HyPerRed, and images were obtained every 30 min (n = 3 independent experiments with similar results). b, Time-lapse microscopy of circadian HyPerRed fluorescence in three individual cells for one day without a serum treatment. U2OS cells were stably expressing HyPerRed, and images were obtained every 30 min. Note that the three cells have widely different similar results). b, Time-lapse microscopy of circadian HyPerRed fluorescence in three individual cells for one day without a serum treatment. U2OS cells were stably expressing HyPerRed, and images were obtained every 30 min. Note that the three cells have widely different phases (n = 3 independent experiments with similar results). c, Time-lapse microscopy of HyPerRed and GFP fluorescence under the same promoter in the same cell for one day without a serum treatment. U2OS cells were stably expressing HyPerRed and GFP, and images were obtained every 30 min (n = 3 independent experiments with similar results). Source data are provided in Statistics Source Data Extended Data Figure 1.
Extended Data Figure 2.
Extended Data Figure 2.. H2O2-sensitive transcription factor (TF) screening identifies that the redox state of CLOCK oscillates rhythmically.
a, Reactive thiols of cysteine residues in proteins are oxidized to S-sulfenic acids (–SOH) by H2O2. Sulfenic acids are unstable and further react with proximal thiol groups to form disulfides, which are reversible oxidative modifications that can be restored to free thiols. b, Changes in the redox state of cysteine residues in proteins are monitored by detecting free thiols with biotin-conjugated iodoacetamide (BIAM) and by detecting cysteine sulfenic acid (R-SOH) with DCP-Bio1 or BTD. c, Representative western blot of S-sulfenylated CLOCK (CLOCK-SOH) from mouse livers labelled by DCP-Bio1. Biotin-blocked streptavidin-magnetic beads were used as a negative control. d, Representative western blot of free reactive thiols in CLOCK labelled by BIAM in vivo and in vitro from N2a cells. Biotin-blocked streptavidin-magnetic beads were used as a negative control. e, Representative western blot of free thiols of CLOCK labelled by BIAM from N2a cells treated with H2O2 (200 μM) for 0, 5, or 20 min and fractionated, followed by immunoprecipitation with CLOCK antibody. f, Relative levels of CCG transcripts in MEFs treated with H2O2 (200 μM) for 12 h. Data are presented as the means ± SEM (n = 3 independent biological samples). P values were calculated using an unpaired two-tailed Student’s t test. g, Relative HyPerRed intensity in U2OS cells stably expressing HyPerRed throughout the circadian cycle (n = 6 independent biological samples). h, Representative western blot of CLOCK-SOH labelled by DCP-Bio1 in U2OS cells over the circadian cycle. n = 3 independent experiments for c,d and n = 2 independent experiments for e,h with similar results. Source data are provided in Statistics Source Data Extended Data Figure 2. Unprocessed blots are shown in Source Data Extended Data Figure 2.
Extended Data Figure 3.
Extended Data Figure 3.. Cysteine195 mediates the rhythmic oscillations of CLOCK’s redox state.
a, Expression levels of each mutant CLOCK plasmid in HEK293T cells examined by immunoblotting (n = 2 independent experiments with similar results). b, Relative luciferase activities of Per1:Luc in HEK293T cells transfected with WT or C195S mutant CLOCK plasmids in the absence or presence of BMAL1 (n = 3 independent biological samples). Data are presented as the means ± SEM. c, Schematic of the target site at the Clock locus. In the double-stranded DNA, the sgRNA target is shown in blue and the PAM sequence is shown in red. Red arrowhead indicates the Cas9 cleavage site. In the donor DNA, the replaced nucleotides are shown in red (for point mutation) or blue (for silent mutation). d,e, Representative western blot (d) and quantification (e) of CLOCK-SOH labelled by DCP-Bio1 in MAFs from WT and ClockC195S mice for one circadian cycle (n = 2 independent experiments with similar results). Source data are provided in Statistics Source Data Extended Data Figure 3. Unprocessed blots are shown in Source Data Extended Data Figure 3.
Extended Data Figure 4.
Extended Data Figure 4.. Redox regulation of CLOCK at Cysteine195 is essential for normal clock function.
a, Schematic of the recombinant WT/C195S-CLOCK (amino acids 26–384) and BMAL1 (amino acids 62–447) proteins. b, Coomassie Brilliant Blue staining of the recombinant BMAL1 and WT/C195S-CLOCK proteins. c,d, Representative image of a non-denaturing polyacrylamide gel electrophoresis (PAGE) gel showing the heterodimer of recombinant BMAL1 and WT- or C195S-CLOCK treated with or without different concentrations of H2O2. e, Representative image of a non-denaturing PAGE gel of the heterodimer of the recombinant BMAL1 protein and increasing concentrations of the recombinant WT-CLOCK protein. f,g, Representative EMSA of recombinant BMAL1 or the heterodimer of recombinant BMAL1 and WT-CLOCK binding to increasing concentrations of the G-box probe (f) and the heterodimer binding to G-box probe treated with or without H2O2 (10−6 mM) (g). h, Relative mRNA levels of Bmal1 in WT and ClockC195S MAFs over the circadian cycles (n = 3 independent biological samples per time point). i, Schematic of 20-nt sgRNA target sequence of Clock (blue) and PAM (red). Red arrowhead indicates Cas9 cleavage site. j, Sequencing of PCR product from a Clock KO mouse. Black arrows indicate the location of mutations introduced by CRISPR/Cas9. k, Representative immunoblot of CLOCK in WT and Clock KO MAFs. l, ChIP analysis of WT- and C195S-CLOCK proteins binding to the Dbp promoter (−1360 to −1297) (−508 to −414) in N2a cells. The Rpl19 promoter served as the negative control (n = 3 independent biological samples). P values were calculated using one way ANOVA with a Bonferroni’s post hoc test. n = 2 independent experiments for b-g,j,k with similar results. Data are presented as the means ± SEM. Source data are provided in Statistics Source Data Extended Data Figure 4. Unprocessed blots are shown in Source Data Extended Data Figure 4.
Extended Data Figure 5.
Extended Data Figure 5.. P66Shc is indispensable for robust oscillations of H2O2 levels and normal CLOCK function.
a, Relative H2O2 concentration in N2a cells transfected with a gradient mass of p66Shc (n = 3 independent biological samples). b, Representative immunoblot of p66Shc phosphorylation at Ser36 in MEFs treated with LY333531 (1 μM). c-i, Relative mRNA levels or representative immunoblot of p66Shc in MEFs (c,d), in livers (e,f), in N2a cells overexpressing CLOCK and BMAL1 (g), or in WT MAFs and Cry DKO MAFs (h,i) (n = 3 independent biological samples per group for c,e,g,h). j,k, Analysis of E-box elements on the promoter of mouse p66Shc (5 kb) (j) and its evolutionary conservation among multiple species (k). l, Representative immunoblot of reduced HA-CLOCK after transient transfection of p66Shc. m, Representative immunoblot of p66Shc in p66Shc KO MEFs rescued by p66Shc overexpression. n, Relative mRNA levels of CCGs in N2a cells overexpressing the WT or S36A mutant of p66Shc (n = 4 independent biological samples, except the Nampt in p66Shc group where n = 5, and the Per2 in p66Shc group and the Wee1 in p66S36A group where n = 3). o, Relative levels of Nampt mRNA in N2a cells overexpressing WT or S36A mutant of p66Shc and treated with H2O2 (200 μM) or catalase (1000 U/ml) (n = 5 independent biological samples). p, Relative amplitude of mPER2::LUC bioluminescence rhythms from WT and p66Shc KO liver explants (n = 9 independent biological samples). P values are shown for the comparisons to the control (a,g), to the first time point for p66Shc (c,e), to Cry DKO (h), to p66Shc (n), to p66S36A (o), and to WT group (p). P values were calculated using an unpaired two-tailed Student’s t test (n,p) and one-way ANOVA with a Bonferroni’s post hoc test (a,c,e,g,h,o). Data are presented as the means ± SEM. n = 3 independent experiments for b,d,f,i,m and n = 2 independent experiments for l with similar results. Source data are provided in Statistics Source Data Extended Data Figure 5. Unprocessed blots are shown in Source Data Extended Data Figure 5.
Extended Data Figure 6.
Extended Data Figure 6.. P66Shc KO reprograms hepatic transcriptome oscillations.
a, Phase analysis of transcripts that oscillate only in the WT or p66Shc KO group. b, Phase analysis of genes that retain oscillations in both WT and p66Shc KO mice. RNA-seq analysis of the whole transcriptome was performed using total RNA obtained from three mouse livers each time point, which were pooled and then divided into two samples, at 4-h intervals for one circadian cycle under DD conditions. All analyses are from n = 1 RNA-sequencing experiment. Source data are provided in Statistics Source Data Extended Data Figure 6.
Extended Data Figure 7.
Extended Data Figure 7.. P66Shc modulates circadian behaviours in mice.
a, Representative western blot of p66Shc in mouse SCN and cortex at CT8 and CT14 under DD conditions. Three mouse SCNs or cortices were pooled per time point (n = 3 independent experiments with similar results). b, Relative levels of p66Shc mRNA in the SCN for one circadian cycle under DD conditions (n = 3 independent biological samples per time point). P values are shown for the comparisons to the first time point for p66Shc. Data are presented as the means ± SEM. c, Representative double-plot actograms of wheel-running activities and period lengths from two WT (left) and two p66Shc KO female mice (right) under DD conditions after LD entrainment. Red lines indicate the day on which DD conditions were initiated. P values are shown for the comparisons of p66Shc KO with WT. Values are presented as the means ± SEM (n = 9 mice). P values were calculated using one-way ANOVA with a Bonferroni’s post hoc test (b) and an unpaired two-tailed Student’s t test (c). Source data are provided in Statistics Source Data Extended Data Figure 7. Unprocessed blots are shown in Source Data Extended Data Figure 7.
Figure 1.
Figure 1.. Endogenous H2O2 levels oscillate rhythmically in cells and in mouse livers.
a,d, Time-lapse microscopy of circadian HyPerRed fluorescence in an individual cell for three consecutive days post serum shock (a) or in two individual cells for 24 h without serum shock (d). Images were obtained every 30 minutes (min) (n = 3 independent experiments with similar results). b,e, Circadian fluorescence profiles of HyPerRed from n = 50 individual cells post serum shock (b) or n = 27 individual cells without serum shock (e). Note that fluorescence intensity varies dramatically between cells. Fluorescence intensity was quantified and plotted against time after normalization to mean values of individual cells. c, Fluorescent signals of HyPerRed and GFP under the same promoter in the same U2OS cell population at 5-min intervals for two days post serum shock (n = 3 independent experiments with similar results). f, Concentration of H2O2 in N2a cells determined by Amplex Red at 4-h intervals for one circadian cycle post serum shock. Data are presented as the means ± standard errors of the means (SEM) (n = 6 independent biological samples per time point). P values are shown for the comparisons to 24 h by one-way analysis of variance (ANOVA) with a Bonferroni’s post hoc test. g, Concentration of H2O2 in mouse livers determined by Amplex Red at 4-h intervals over a 72-h period under DD conditions. Data are presented as the means ± SEM (n = 3 independent biological samples per time point). JTK _Cycle analysis was used to determine rhythmicity, and P < 0.05 was considered rhythmic. Source data are provided in Statistics Source Data Figure 1.
Figure 2.
Figure 2.. H2O2-sensitive transcription factor (TF) screening identifies that the redox state of CLOCK oscillates rhythmically.
a, Schematic of the experimental design used to profile the proteomic landscape of TFs with DNA-binding activity that was influenced by H2O2 treatment (200 μM). Nuclear extracts obtained from three livers were pooled for experiment. b,c, Venn diagram illustrating the overlap of TFs identified in three independent biological samples of the control group (b) and H2O2-treated group (c). d, Venn diagram illustrating TF enrichment and identification comparison between control and H2O2 treatments. e, Volcano plot illustrating the different abundance of individual TFs identified in the H2O2-treated group versus the control group. The y-axis represents the -log10 (P-value) based on a paired two-tailed Student’s t test (n = 3 independent biological samples). The x-axis represents the log2 (fold change). A fold change of 1.5 is indicated by grey lines. TFs with a P-value < 0.05 are depicted in pink and TFs with a P-value < 0.1 are depicted in breen. f, Representative western blot of S-sulfenylated CLOCK (CLOCK-SOH) labelled by BTD and reduced CLOCK (CLOCK-SH) proteins labelled by BIAM from livers. g, Representative western blot showing the CLOCK-SOH (upper panel) labelled by DCP-Bio1 and HyPerRed intensity (lower panel) (n = 4 independent biological samples) in U2OS cells stably expressing HyPerRed and treated with different doses of H2O2. Data are presented as the means ± SEM. h, Representative western blot of HA-tagged CLOCK-SH from N2a cells treated with H2O2 (200 μM) alone or followed by catalase treatment (1000 U/ml) or removal of H2O2. i-k, Representative western blot and quantification of CLOCK-SH in U2OS cells (i), in mouse livers (j), and CLOCK-SOH levels in mouse livers (k) over the circadian cycle. Each time point consists of a mixture of liver extracts from three mice. JTK _Cycle analysis was used to determine rhythmicity, and P < 0.05 was considered rhythmic. n = 2 independent experiments for f,h and n = 3 independent experiments for g,i-k with similar results. Source data are provided in Statistics Source Data Figure 2. Unprocessed blots are shown in Source Data Figure 2.
Figure 3.
Figure 3.. Cysteine195 mediates the rhythmic oscillations of CLOCK’s redox state.
a, Analysis of evolutionary conservation of cysteines in CLOCK. b, Relative luciferase activities of Per1:Luc in HEK293T cells transfected with WT or a series of cysteine mutant CLOCK plasmids in the presence of BMAL1 overexpression (n = 3 independent biological samples). Data are presented as the means ± SEM. c, Relative mRNA levels of Dbp in N2a cells transfected with WT or corresponding mutant CLOCK in the presence of BMAL1 overexpression (n = 3 independent biological samples). P values were calculated using an unpaired two-tailed Student’s t test. Data are presented as the means ± SEM. d,e, Representative western blot of free thiols in WT and corresponding mutant CLOCK (d) or followed by treatment with 200 μM H2O2 (e). f, Representative western blot showing the levels of sulfenylated thiols in WT- and C195S-CLOCK at 28 h and 40 h post serum shock. g, Representative mass spectrum (MS) ion chromatograms for the peptides corresponding to the iodoacetamide-alkyne probe (IPM)-labelled cysteines from H2O2 (150 μM)-treated recombinant CLOCK (amino acids 1–351) or control CLOCK. H2O2 treatment significantly decreased the levels of reduced C195 and C267 labelled by IPM in recombinant CLOCK (0.5-fold as the cut-off value). h, Representative MS of dimedone-labelled recombinant CLOCK peptide at C195. C#, dimedone-labelled C195. i, Sequencing of PCR products from wild-type mice (top) and ClockC195S mice (bottom). Black arrow indicates the location of mutation introduced by CRISPR/Cas9. The replaced nucleotide is shown in red. j, Representative western blot showing levels of CLOCK-SH labelled by BIAM in livers from WT and ClockC195S mice at CT28. Each genotype consists of a mixture of liver extracts from three mice. k,l, Representative western blot (k) and quantification (l) of CLOCK-SH labelled by BIAM in MAFs from WT and ClockC195S mice for one circadian cycle. n = 2 independent experiments for f-l and n = 3 independent experiments for d,e with similar results. Source data are provided in Statistics Source Data Figure 3. Unprocessed blots are shown in Source Data Figure 3.
Figure 4.
Figure 4.. Redox regulation of CLOCK at Cysteine195 is essential for normal clock function.
a, Environment of the C195 thiol in the CLOCK:BMAL1 crystal structure. b, Representative western blot showing the interactions between recombinant BMAL1 (amino acids 49–434) and recombinant WT- or C195S-CLOCK after treatment with or without H2O2 (10−5 mM). c,d, Scatchard analysis of the equilibrium binding of recombinant BMAL1 to recombinant WT-CLOCK (c) and C195S-CLOCK (d) treated with or without H2O2 (10−6 mM). e, Scatchard analysis of the equilibrium binding of the heterodimer of recombinant BMAL1:WT-CLOCK treated with or without H2O2 (10−6 mM) to a G-box probe. f, Representative EMSA of the heterodimer of BMAL1 and WT- or C195S-CLOCK proteins treated with or without H2O2 (10−6 mM) binding to the G-box probe. g, Relative mRNA levels of Per2, Per1, Cry2, Rev-erbα, Dbp, and Tef in WT MAFs and ClockC195S MAFs treated with or without H2O2 (50 μM) for 10 h (n = 3 independent biological samples). h-m, Relative mRNA levels of Per2 (h), Per1 (i), Cry2 (j), Rev-erbα (k), Dbp (l), and Tef (m) in WT and ClockC195S MAFs over the circadian cycle (n = 3 independent biological samples per time point). P values are shown for the comparisons of ClockC195S with WT. n, Representative baseline detrended bioluminescence recordings from synchronized Clock KO MAFs rescued by WT or C195S mutant CLOCK. P values were calculated using one-way ANOVA with a Bonferroni’s post hoc test (g) and an unpaired two-tailed Student’s t test (h-m). Data are presented as the means ± SEM. n = 3 independent experiments for b,f and n = 2 independent experiments for c-e and n = 6 independent experiments for n with similar results. Source data are provided in Statistics Source Data Figure 4. Unprocessed blots are shown in Source Data Figure 4.
Figure 5.
Figure 5.. P66Shc is indispensable for robust oscillations of H2O2 levels and normal CLOCK function.
a, Relative H2O2 levels in WT and p66Shc KO MEFs treated with alcohol or LY333531 (n = 3 independent biological samples). b-d, Oscillations of H2O2 levels in MEFs (b) or liver (c) from WT and p66Shc KO mice or in WT MEFs treated with alcohol or LY333531 (1 μM) (d) (n = 3 independent biological samples per time point, except the liver from WT mice where n = 5 animals). e,f, Free thiols of CLOCK in MEFs (e) or livers (f) from WT and p66Shc KO mice for one circadian cycle. g,h, Relative mRNA levels of CCGs in WT and p66Shc KO MEFs (g) or KO MEFs treated with p66Shc over-expression or Clock knockdown (h) (n = 3 independent biological samples). i, Representative baseline detrended bioluminescence recordings and period lengths of mPER2::LUC liver explants from WT or p66Shc KO mice (n = 7 independent biological samples). j,k, Representative baseline detrended bioluminescence recordings, period lengths and representative western blot of total p66Shc protein or phosphorylation at Ser36 from synchronized PLuc cells treated with p66Shc knockdown by siRNA (j) (n = 3 independent biological samples, except the control where n = 5), or CGP53353, a phosphorylation inhibitor of p66Shc at Ser36 (k) (n = 3 independent biological samples). P values in b,c,g,i are shown for the comparisons of p66Shc KO with WT. P values in d,j,k are shown for the comparisons of control with others. P values in h are shown for the comparisons of p66Shc overexpression with others. P values were calculated using an unpaired two-tailed Student’s t test (b,c,d,g,i) and one-way ANOVA with a Bonferroni’s post hoc test (a,h,j,k). Data are presented as the means ± SEM. n = 2 independent experiments for e,f and n = 6 independent experiments for j,k with similar results. Source data are provided in Statistics Source Data Figure 5. Unprocessed blots are shown in Source Data Figure 5.
Figure 6.
Figure 6.. P66Shc KO reprograms hepatic transcriptome oscillations and metabolic homeostasis.
a,b, Heatmaps for genes uniquely oscillating in WT (a) or p66Shc KO (b) mouse livers (P < 0.05, JTK_Cycle). RNA-seq analysis of the whole transcriptome was performed using total RNA obtained from three mouse livers each time point, which were pooled and then divided into two samples, at 4-h intervals for one circadian cycle under DD conditions. c, Pie charts indicate actual numbers of oscillating transcripts only in the WT, only in the p66Shc KO, or in both the WT and p66Shc KO groups (P < 0.01, JTK_Cycle). d, HOMER known motif analysis of transcription factor-binding sites enriched in promoters of the gene whose expression was altered when p66Shc was disrupted. ZOOPS scoring (zero or one occurrence per sequence) coupled with the hypergeometric enrichment calculations was used to determine motif enrichment (total target sequences = 1823, total background sequences = 28426), and P < 0.05 was considered statistically significant. e, Venn diagram of overlap between transcripts with altered circadian oscillations and CLOCK cistrome at CT12 determined by ChIP-seq. f,g, Top 10 GO terms for biological processes in which oscillatory expression is lost in p66Shc KO mice (f) or newly oscillating genes exclusively expressed in the p66Shc KO group (g) identified using the DAVID pathway analysis tool. h, Oscillations of NAD+/NADH levels in livers from WT and p66Shc KO mice (n = 3 independent biological samples per time point). P values are shown for the comparisons of p66Shc KO with WT. i-k, Relative NAD+ (i), triglyceride (j), and β-hydroxybutyrate (k) levels in WT and p66Shc KO mouse livers (n = 3 independent biological samples, except the triglyceride where n = 4). P values in h are shown for the comparisons of p66Shc KO with WT. P values were calculated using an unpaired two-tailed Student’s t test (h) and one-way ANOVA with a Bonferroni’s post hoc test (i,j,k). Data are presented as the means ± SEM. Source data are provided in Statistics Source Data Figure 6.
Figure 7.
Figure 7.. P66Shc modulates circadian behaviours in mice.
a,b, Representative immunohistochemical staining of p66Shc protein in SCN at 6-h intervals over a 24-h period under DD conditions; p66Shc KO SCN served as a negative control. Scale bar, 100 μm. Bar diagrams show quantitative data from 4 independent biological samples. P values are shown for the comparisons to CT2. c, Relative H2O2 levels in WT and p66Shc KO SCN for one circadian cycle (n = 6 independent biological samples, except the WT at CT2 and CT14 and p66Shc KO at CT2 and CT20 where n = 5). d,e, Representative double-plot actograms of wheel-running activities (d) and period lengths (e) from two WT (left) and two p66Shc KO male mice (right) under DD conditions after LD entrainment (n = 11 mice for WT and n = 10 mice for p66Shc KO). Red lines indicate the day on which DD conditions were initiated. f,g, Representative actograms of wheel-running activities (f) and phase shifts (g) from WT (left) and p66Shc KO male mice (right) under DD conditions after exposure to a single light pulse (15 min, 400 lux) at CT14 (n = 7 mice for WT and n = 8 mice for p66Shc KO). Red asterisks denote a light pulse. P values in c,e,g are shown for the comparisons of p66Shc KO with WT. P values were calculated using an unpaired two-tailed Student’s t test (c,e,g) and one-way ANOVA with a Bonferroni’s post hoc test (b). Data are presented as the means ± SEM. h, Model showing that redox rhythms and TTFLs are intrinsically coupled to cooperatively regulate the biological clock through diurnal oscillations of endogenous H2O2 and rhythmic redox modification of CLOCK. Source data are provided in Statistics Source Data Figure 7.

References

    1. Bass J & Takahashi JS Circadian integration of metabolism and energetics. Science 330, 1349–1354 (2010). - PMC - PubMed
    1. Dodd AN et al. Plant circadian clocks increase photosynthesis, growth, survival, and competitive advantage. Science 309, 630–633 (2005). - PubMed
    1. Takahashi JS Transcriptional architecture of the mammalian circadian clock. Nat. Rev. Genet 18, 164–179 (2017). - PMC - PubMed
    1. Reddy AB & Rey G Metabolic and Nontranscriptional Circadian Clocks: Eukaryotes. Annu. Rev. Biochem 83, 165–189 (2014). - PMC - PubMed
    1. O’Neill JS & Reddy AB Circadian clocks in human red blood cells. Nature 469, 498–503 (2011). - PMC - PubMed

Publication types

Substances