

doi: 10.1038/s41592-019-0638-x.
Epub 2019 Nov 25.
DIA-NN: neural networks and interference correction enable deep proteome coverage in high throughput
Affiliations
- PMID: 31768060
- PMCID: PMC6949130
- DOI: 10.1038/s41592-019-0638-x
Item in Clipboard
DIA-NN: neural networks and interference correction enable deep proteome coverage in high throughput
Nat Methods.
2020 Jan.
Abstract
We present an easy-to-use integrated software suite, DIA-NN, that exploits deep neural networks and new quantification and signal correction strategies for the processing of data-independent acquisition (DIA) proteomics experiments. DIA-NN improves the identification and quantification performance in conventional DIA proteomic applications, and is particularly beneficial for high-throughput applications, as it is fast and enables deep and confident proteome coverage when used in combination with fast chromatographic methods.
Conflict of interest statement
The authors declare no competing interests.
Figures
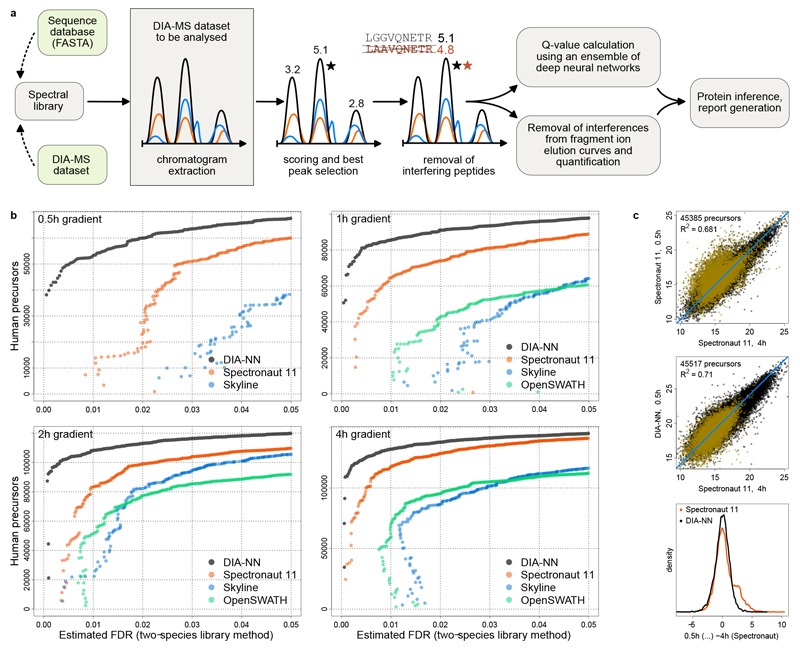
a, Schematic: DIA-NN workflow. Chromatograms are extracted for each precursor ion and all its fragment ions (the chromatograms are shown schematically, with different colours corresponding to different fragments). Putative elution peaks are then scored, and the ‘best’ peak (marked with a star) is selected. Potentially interfering peptides are then detected and removed. The precursor-peak matches obtained allow to calculate q-values using an ensemble of deep neural networks as well as remove interferences from the fragment elution curves. b, Identification performance of DIA-NN when processing technical repeat injections of a HeLa tryptic digest analysis (QExactive HF, 0.5h - 4h gradient lengths). Precursor identification numbers are plotted against the FDR, estimated using a two-species compound human-maize spectral library method (Methods). Each point on the graph corresponds to a decoy (maize) precursor, its x-axis value reflecting the estimated FDR at the respective score threshold and its y-axis value being the number of identified target (human) precursors at this threshold. The 0.5h acquisition was not analysed with OpenSWATH for technical reasons. c, Log2-quantities of precursors reported for both the 0.5h acquisition – among top 50000 by Spectronaut (top panel) or DIA-NN (middle panel), and the 4h acquisition (among top 100000 by Spectronaut). R2 values were calculated using linear regression with unity slope. Precursors identified exclusively by either Spectronaut (8379 total) or DIA-NN (8511 total) at 0.5h (i.e. those precursors, identifications of which are not supported by the other tool at the same gradient) are highlighted in yellow. For these, the distribution densities of the differences (centered) between the 0.5h log2-quantities reported by Spectronaut or DIA-NN and 4h log2-quantities reported by Spectronaut (bottom panel) were plotted.
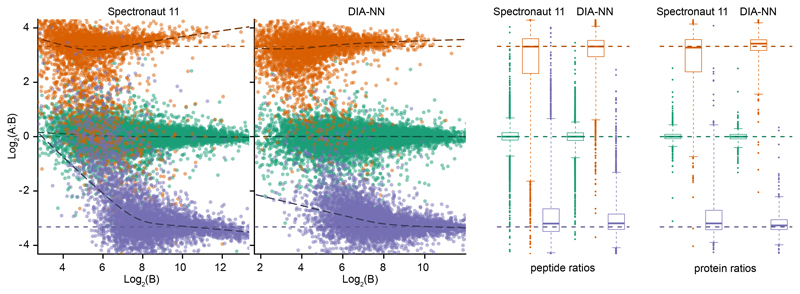
Quantification precision was benchmarked using two peptide preparations (yeast and E.coli) that were spiked in two different proportions (A and B, three repeat injections each) into a human peptide preparation. The data were processed at 1% q-value (reported by the software tools themselves, i.e. the effective FDR for DIA-NN and Spectronaut may be different) using a spectral library generated from a fractionated sample analysis with DDA. Peptide ratios between the mixtures were visualised using the LFQbench R package (left panel; the dashed lines indicate the expected ratios). Right panel: peptide and protein quantification performance given as box-plots (boxes: interquartile range, whiskers: 1-99 percentile; n = 15442 and 15743 (human), 3403 and 3755 (yeast), 4494 and 4997 (E.coli) for peptide ratios obtained from the reports of Spectronaut and DIA-NN, respectively; n = 1921 and 1950 (human), 529 and 550 (yeast), 566 and 616 (E.coli) for protein ratios obtained from the reports of Spectronaut and DIA-NN, respectively).
References
Publication types
MeSH terms
Substances
Grants and funding
- 200829/WT_/Wellcome Trust/United Kingdom
- MC_PC_17179/MRC_/Medical Research Council/United Kingdom
- BB/N015282/1/BB_/Biotechnology and Biological Sciences Research Council/United Kingdom
- BB/N015215/1/BB_/Biotechnology and Biological Sciences Research Council/United Kingdom
- FC001134/WT_/Wellcome Trust/United Kingdom
LinkOut - more resources
Full Text Sources
Other Literature Sources
Molecular Biology Databases
