Clinical Trial
. 2019 Dec;25(12):1928-1937.
doi: 10.1038/s41591-019-0652-7. Epub 2019 Nov 25.

High-intensity sequencing reveals the sources of plasma circulating cell-free DNA variants

Affiliations
Clinical Trial

High-intensity sequencing reveals the sources of plasma circulating cell-free DNA variants

Pedram Razavi et al. Nat Med. 2019 Dec.

Abstract

Accurate identification of tumor-derived somatic variants in plasma circulating cell-free DNA (cfDNA) requires understanding of the various biological compartments contributing to the cfDNA pool. We sought to define the technical feasibility of a high-intensity sequencing assay of cfDNA and matched white blood cell DNA covering a large genomic region (508 genes; 2 megabases; >60,000× raw depth) in a prospective study of 124 patients with metastatic cancer, with contemporaneous matched tumor tissue biopsies, and 47 controls without cancer. The assay displayed high sensitivity and specificity, allowing for de novo detection of tumor-derived mutations and inference of tumor mutational burden, microsatellite instability, mutational signatures and sources of somatic mutations identified in cfDNA. The vast majority of cfDNA mutations (81.6% in controls and 53.2% in patients with cancer) had features consistent with clonal hematopoiesis. This cfDNA sequencing approach revealed that clonal hematopoiesis constitutes a pervasive biological phenomenon, emphasizing the importance of matched cfDNA-white blood cell sequencing for accurate variant interpretation.


Figures

Extended Data Fig. 1
Extended Data Fig. 1. Study overview
Patient enrollment, inclusion and evaluable group are defined in the blue boxes. Detailed clinical, tissue and cfDNA exclusions are shown in the gray boxes.
Extended Data Fig. 2
Extended Data Fig. 2. Comparison of sequence depth and raw error rate distributions across cancer cohorts (n=124) and non-cancer controls (n=47)
(a) Comparison of deduplicated and uncollapsed mean target sequence depth between cfDNA and WBC. The p values were obtained using paired two-sided Mann-Whitney U-tests comparing cfDNA against WBC. (b) Deduplicated and collapsed mean target sequence depth in cfDNA and WBC between the different cancer cohorts and non-cancer controls. (c) Association between the amount of cfDNA used for library preparation and the mean target deduplicated and collapsed sequencing depth. The diagonal line represents a linear regression with 99% confidence intervals. The p value was obtained using an F-test. (d) Distribution of mean target deduplicated and collapsed sequencing depth across the different cohorts. (e,f) Comparison of (e) raw substitution error rate and (f) raw substitution and indel error rate across the different cohorts. In (b) and (d-f), the p values were obtained from pairwise comparisons using two-sided Mann-Whitney U-tests and adjusted for multiple testing using the Bonferroni method. In (e), the substitution error rate represents the percentage of collapsed bases with non-reference base. Similarly, in (f) the combined error rate represents the percentage of collapsed bases with non-reference base or indels. In all panels, the cohorts consist of n=39 MBC, n=41 NSCLC and n=44 CRPC patients and n=47 non-cancer controls. In (a-b) and (d-f), the horizontal bars indicate the median and the boxes represent the interquartile range (IQR). The whiskers extend to 1.5 × IQR on either side.
Extended Data Fig. 3
Extended Data Fig. 3. Hierarchical Bayesian model for calibrated analysis of somatic cfDNA variants and performance assessment
(a,b) Plate models showing the hierarchy of statistical relationships for (a) single nucleotide variants and (b) small insertions and deletions influencing the observed quantity of alternate alleles ynp in each sample n at each position p conditional on both latent parameters μ (the rate of events), θ (the type of event), α, β as well as fixed covariates xp (of X types) such as trinucleotide context and, separately, depth of sequencing at a position (dp). Note that insertions and deletions have additional complexity as one must account for length of the insertion/deletion event in the model as insertions and deletions of differing lengths have differing probabilities. The model was fitted to the training data consisting of n=43 unrelated non-cancer controls, estimates for the parameters were fixed and applied to new samples for scoring. (c,d) The posterior distributions of site-specific λp (μp dp) were summarized by their mean μp and displayed for a subset of representative sites in (c) by type of mutation and (d) by trinucleotide context. In both panels, the midpoint indicates the mean and the vertical bars represent the 95% Gaussian confidence limits based on the t-distribution. (e) Estimated μp against the observed λp for samples in the training set. Note the data points at the bottom are all positions p with non-zero mean posterior μp and zero observed alternate allele counts. (f) Comparison of the estimated probability of observing an event (x-axis) with the actual empirical probability of observing such an event (y-axis). The plot was calibrated based on estimates of μp on chromosome 21. Note the initial sharp rise reflects the number of sites with zero observed alternate allele counts whilst the excess low probability events at the other end reflects the difficulty of stringently filtering out rare biological events such as clonal hematopoiesis. (g) Mean number of variants detected in healthy control individuals (x-axis) against the recall rate of biopsy-matched variants (y-axis) for the different cancer types. At Q60, one can expect one false positive per million bases. Here, to exclude potentially CH derived variants, a fixed threshold of 0.8 on the posterior probability of detected variants originating from cfDNA (i.e. PGTKXGDNA) was adopted. (h) Mean number of variants detected in healthy control individuals (x-axis) against the recall rate of biopsy-matched variants (y-axis) at different probabilities for allowing variants to be assigned to cfDNA. The thresholds displayed were obtained by cross-validation holding out each cancer type and selecting a threshold which retains most of the biopsy-matched variants whilst still filtering out variants of potential hematopoietic origin. Here, to exclude variants potentially due to noise, a fixed threshold of Q60 was adopted.
Extended Data Fig. 4
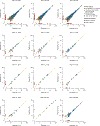
Extended Data Fig. 4. Reproducibility of the high-intensity DNA assay
Six patient samples were selected for processing using two versions of the assay protocol (V1 and V2). These are labelled Replicate 1 and Replicate 2. A subset of three samples were further retested using version V2 and labelled Replicate 3. The panels illustrate the pairwise comparisons of measured VAF between all available replicates for each patient. In all panels, the variants are shape coded based on their origin, whether they were also detected in the matched tumor biopsy and color coded according to their category, whether they were detected in both replicates and whether they were assigned to similar source categories (i.e. VUSo, WBC-matched or noise). In all panels, the samples are labelled on top.
Extended Data Fig. 5
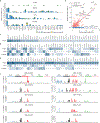
Extended Data Fig. 5. Top mutated genes carrying VUSo and 96 base substitution profiles of ten hypermutated cfDNA samples
(a) Frequency of genomic alterations in cfDNA of 47 non-cancer controls and 124 cancer patients. The genes were sorted by their frequency of alterations in the tumor. The colors indicate whether the alterations were biopsy-matched, detected in the tumor but below the threshold of the MSK-IMPACT assay (biopsy-subthreshold), or were specific to cfDNA (i.e. variants of unknown source, VUSo). (b) Correlation of the number of VUSo per gene and per patient (y-axis) in the ten hypermutated and 114 non-hypermutated cancer patients against the length of the coding region sequenced (x-axis) of each target gene. (c-e) Heat maps showing the top mutated genes harboring somatic variants detected in plasma cfDNA that are neither tumor-matched (biopsy-matched or subthreshold) nor WBC-matched across each cohort in (c) 47 non-cancer controls, (d) 114 non-hypermutated and (e) 10 hypermutated cancer patients. The numbers in the cells indicate the number of patients. (f) 96 base substitution profiles of the 10 hypermutated patients. For each patient, the number of C>A, C>G, C>T, T>A, T>C, and T>G substitutions together with the sequence context immediately 3’ and 5’ are expressed as a percentage of the total number of substitutions.
Extended Data Fig. 6
Extended Data Fig. 6. Characterization of biological sources and composition of cfDNA variants
(a) The bar plots show the number of somatic variants detected in plasma cfDNA per megabase (Mb, y-axis) for each sample (x-axis) stratified by cancer status and biological sources and ordered by increasing number of somatic WBC-matched variants. The panels show control samples (top left) and patients with MBC (top right), NSCLC (bottom left) and CRPC (bottom right). The colors indicate WBC-matched variants, tumor biopsy-matched variants, biopsy-subthreshold and VUSo. (b) Top mutated genes carrying WBC-matched variants for each cohort. The number in the cells indicate the overall number of variants for each gene in the corresponding cohort. In (a,b), the cohorts consist of n=39 MBC, n=41 NSCLC and n=44 CRPC patients. Additionally, in (a) n=47, non-cancer controls are shown. (c,d) Distribution of Variant Allele Fractions (VAFs) of somatic mutations detected in cfDNA and WBC using the high-intensity sequencing assay where variants are color coded according to source of origin. Somatic variants are displayed for n=114 non-hypermutated cancer patients and n=47 non-cancer controls. The allelic (AD) and total (DP) depths are obtained from raw pileups without base alignment quality filtering (BAQ). In (c), the VAF is smoothed with added pseudocounts to AD and DP such that AD′ = AD + 2 and DP′ = DP + 4. In (d), variants detected with zero AD in WBC were displayed as 0.01% VAF in WBC due to the logarithmic scaled axes.
Extended Data Fig. 7
Extended Data Fig. 7. Somatic mutations occurring at high sequencing depth in cfDNA
Somatic mutations detected at sequencing depth >10,000 in cfDNA occur mostly in hypermutated samples and are related to sample level mean target collapsed depth which is itself a function of the amount of input DNA used for library preparation. (a) Number of somatic mutations occurring at >10,000 sequence depth (n=215) per patient and categorized into WBC-matched, VUSo or Tumor-matched where the latter category is composed of Biopsy-matched and Biopsy-subthreshold mutations. (b) Variant level collapsed depth for all somatic mutations detected in cfDNA categorized into Tumor-matched, VUSo or WBC-matched and grouped according to the amount of input DNA used for library preparation. (c) Variant level collapsed depth for all somatic mutations detected in cfDNA against sample level mean collapsed target depth. (d) variant level collapsed depth for all somatic mutations against modeled VAF in cfDNA. 121 of 215 (56.3%) somatic mutations detected at sequencing depth >10,000 in cfDNA occurred in the hypermutated patient MSK-VB-0023. (e,f) Log2 ratios of (e) tumor biopsy and (f) cfDNA of patient MSK-VB-0023. The tumor biopsy and cfDNA showed similar copy number alterations (i.e. 1q+ and 16q-). No high-level copy number amplifications were observed in either the tumor biopsy or the cfDNA which could explain the high sequencing depth. Three replicate sequencing of cfDNA and WBC were available for that patient. (g) and (h) Pairwise comparisons of VAF for the 121 mutations detected at depth >10,000 using version V1 of the assay. In (a), ‘1’ denotes hypermutated samples. In (b), the midpoint indicates the median whilst the violins extent to the full range of the data. In (b-d), the sequencing depths of somatic variants for the cohort of n=124 cancer patients are shown. In (e) and (f), the grey points represent the raw Log2 ratios and are ordered according to their genomic coordinates. The solid red lines indicate the segmented values. In (g) and (h), the variants are shape coded based on their origin (i.e. whether they were also detected in the matched tumor biopsy and color coded according to their category; whether they were called in both replicates and assigned to similar source categories, namely VUSo, WBC-matched or noise).
Extended Data Fig. 8
Extended Data Fig. 8. Characterization of CH derived variants through direct analysis of WBC
(a) CH-related somatic mutations in the top 14 mutated genes across the 114 non-hypermutated cancer patients and 47 non-cancer controls together with the marginal frequencies by patient (top) and by gene (right). DNMT3A, TET2 and PPM1D are the top mutated genes in WBC and harbor multiple hits (i.e. two or more mutations per patient). (b) Clustering within genes of CH-derived mutations detected in WBC. The clusters and associated p values were computed using a modification of OncodriveCLUST which assumes the number of mutations in clusters follows a Poisson distribution. The resulting p values are two-sided. (c,d) Distribution of mutations in PPM1D (c) according to genomic coordinates and for DNMT3A (d). Mutations detected in PPM1D are clustered in the C-terminus of the protein.
Extended Data Fig. 9
Extended Data Fig. 9. Copy number profile derived from cfDNA of non-cancer controls and cancer patients
(a-b) Log2 ratios estimated from the cfDNA of (a) n=24 female and (b) n=23 male control individuals. For each individual, the raw Log2 ratios were smoothed using a cubic spline. The two panels show the superimposed splines for all control samples according to gender. (c-e) Log2 ratios of tumor biopsies (top panels) and their corresponding matched cfDNA (bottom panel) for three cases (c) MSK-VB-0008, (d) MSK-VL-0056 and (e) MSK-VP-0004 where amplification of CCND1, FGFR1, EGFR and a homozygous deletion of BRCA2 were reported, respectively. The arrows point to the reported amplifications or deletions. The segmented Log2 ratios were used to compute the Pearson correlation coefficient comparing segments overlapping >75% in the tumor biopsies and cfDNA samples. In (a-e), the Log2 ratios are displayed according to their genomic coordinates. In (c-e), the grey dots show the raw estimates while the red lines represent the segmented values. (f) The association of the Pearson’s r against the ctDNA fraction and purity of the tumor biopsies. The cohort consists of n=124 cancer patients with paired tumor biopsy and cfDNA samples. The p values were obtained using a permutation based one-sided Jonckheere-Terpstra test for increasing Pearson’s r with ctDNA fraction or tumor purity. The horizontal bars indicate the median and the boxes represent the interquartile range (IQR). The whiskers extend to 1.5 × IQR on either side. NE; not evaluable.
Extended Data Fig. 10
Extended Data Fig. 10. Comparison of copy number alterations in tumor biopsies and matched cfDNA samples
(a) Heatmap of all genes where an amplification or a homozygous deletion was found in either the tumor biopsy or cfDNA. The samples are interleaved (i.e. tumor biopsy and cfDNA) and represented along the rows, whilst genes are ordered in columns relative to their genomic coordinates. (b,c) Receiver operating characteristic curves comparing (b) copy number amplifications and (c) homozygous deletions detected in the tumor biopsies with the absolute copy numbers inferred in cfDNA. Each tumor-cfDNA sample pair was used to construct individual curves. These were averaged after fitting a local polynomial regression and estimating the sensitivities over fixed intervals of specificities. In (a-c), only tumor-cfDNA sample pairs from n=49 patients with ctDNA fraction >10% were used. (d) Four MBC patients: MSK-VB-0006, MSK-VB-0044, MSK-VB-0059 and MSK-VB-0069 with a reported amplification of ERBB2 on chromosome 17q are shown together with one NSCLC patient, MSK-VL-0044 with a reported MET amplification on chromosome 7q. The tumor biopsies are displayed on the left and the matched cfDNA are shown on the right together with the corresponding chromosome ideogram. The genomic coordinates of ERBB2 and MET are displayed by orange arrows and labelled accordingly.
Fig. 1.
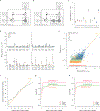
Fig. 1.. Assay workflow and reproducibility.
(a) Tumor and cfDNA samples were collected from patients with metastatic breast (MBC), lung (NSCLC), and prostate (CRPC) cancers. Tumor and matched normal samples were sequenced using the MSK-IMPACT assay, while plasma and buffy coat samples from cancer patients and non-cancer controls from the San Diego Blood Bank underwent sequencing followed by de novo assembly and mutation detection using the high-intensity targeted cfDNA assay by GRAIL, Inc (Menlo Park, CA) based on a bespoke joint-variant-calling pipeline. Tumor and cfDNA somatic variant detection results were unblinded for concordance analyses. (b) Analytical performance of the targeted DNA assay. The detection probability is shown as a function of increasing variant allele fraction in HD753 cell line DNA titrations. The curves correspond to the mean target coverage of 2,430X from 30 ng cell line DNA input and the mean target coverage of 4,577X obtained from simulated FASTQs. (c) Estimated variant calling specificity using non-cancer control samples and corresponding variant calling sensitivity using methods as described in the supplementary methods (joint variant analysis using the machine learning error model). Non-cancer controls were not used to train the model here. (d) Comparison of allele fraction of variants detected using either of the two targeted DNA assay protocols in five patients. One MBC hypermutated patient, shown in (e), was excluded from this analysis to avoid biased regression. Concordant mutation detection between the two replicates (triangles indicate biopsy-matched, circles indicate biopsy-unmatched variants) is enriched in allele fraction above limit of detection. (f) Comparison of variant allele fraction (VAF) measured using the targeted DNA assay (y-axis) and ddPCR (x-axis). cfDNA extracted from five cancer patients with canonical hotspot mutations were subjected to ddPCR. An aliquot of the same cfDNA sample was employed for the targeted DNA assays using two versions of the protocol (V1 and V2). One sample lacking canonical hotspot mutation in the ddPCR measurements was excluded.
Fig. 2.
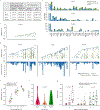
Fig. 2.. Concordance of cfDNA variants with tumor biopsy.
(a) Summary statistics of concordance between the cfDNA and tumor biopsy assays for 124 patients with MBC (n=39), NSCLC (n=41), and CRPC (n=44) cancer. (b) Frequency of genomic alterations by in cfDNA of the same patients with MBC, NSCLC, and CRPC. The genes were sorted by their frequency of alterations in the tumor tissue. (c) Plasma variant allele fractions (VAF) of somatic variants sorted by the maximum VAF in control individuals. (d) Upper panels depict plasma VAFs of somatic variants in MBC, NSCLC, and CRPC. The lower panels show the number of variants identified in each individual by MSK-IMPACT. Colors indicate whether alterations were biopsy-matched, biopsy-subthreshold, biopsy-only (detected in tumor only and not in cfDNA), or VUSo. (e) Increasing detection rate of tumor variants in cfDNA with clonality of mutations in the tumor biopsy. The midpoint of the interval plot shows the median proportion of tumor mutations from the MSK-IMPACT assay which were also detected in cfDNA of MBC, NSCLC, and CRPC patients, stratified by the cancer cell fraction (CCF) in the tumor, whilst the error bars indicate the 95% binomial confidence intervals. The CCF was strongly associated with detection rate in cfDNA (overall p= 5.33e-21). All p values are based on two-sided X2 trend test. (f) Distribution of tumor derived cfDNA fraction estimates (i.e. ctDNA fraction) in MBC, NSCLC, and CRPC patients (n=105 patients with evaluable ctDNA fraction, two-sided Kruskal-Wallis H-test p=0.0046). The midpoints indicate the median ctDNA fraction by cancer type and the violins extend to the full range of the data. (g) Distribution of ctDNA fraction estimates as a function of disease burden. In MBCs (n=34) and NSCLC (n=29), disease volume was obtained through volumetric measurements of pre-cfDNA collection CT scans. In CRPC (n=39), the automated bone scan index (aBSI) was used to estimate disease burden. The association between tertiles of disease burden for each cohort and the ctDNA fraction was estimated using a one-sided Jonckheere-Terpstra test for increasing ctDNA fraction. Triangles indicate patients from whom some distant metastases could not be measured and the estimates for these lesions were not included in the volumetric assessment. Note that as aBSI was employed for CRPC, not all sites of metastatic disease (e.g. visceral disease) were included in the disease burden in the CRPC patients. The horizontal bar indicates the median, while the boxes shows the interquartile range (IQR). The whiskers extend to 1.5 × IQR on either side.
Fig. 3.
Fig. 3.. Tumor mutational burden and mutational signatures derived from cfDNA targeted assay.
(a) Distribution of the somatic tumor mutation burden (TMB), defined as the number of nonsynonymous mutations per megabase (Mb), in tumor (x-axis) and cfDNA (y-axis). The vertical dashed line indicates the threshold for samples with a high TMB based on tumor biopsy (13.8 mutations/Mb) and the horizontal dashed line indicates the threshold for samples with a high TMB in cfDNA (22.7 mutations/Mb). (b) Venn diagrams showing the total number of mutations detected in cfDNA and tumor and their overlap. The upper panel shows the distribution of mutations in the 10 hypermutated cases (MBC n=5, NSCLC n=2, and CRPC n=3), while the lower panel shows the same in the remaining 114 patients (MBC n=34, NSCLC n=39, CRPC n=41). The 10 hypermutated cases account for 60% of total cfDNA variants and 75% of cfDNA-only variants (VUSo). (c) Bar charts displaying the fraction of mutational signatures in the hypermutated cases. The upper panel shows the Pearson correlation between the observed and expected 96 base substitutions profile. All the MBC cases and one of the CRPC cases demonstrated a dominant APOBEC signature. (d) Microsatellite instability (MSI) scores obtained using a modified MSIsensor algorithm from the tumor (x-axis) and cfDNA (y-axis). (e) A 55-year-old patient with castration- and enzalutamide-resistant prostate cancer displaying an MMR signature and high MSI score based on both cfDNA and tumor targeted sequencing data. Upon initiation of treatment on an anti-PD-L1 immunotherapy regimen, rapid tumor regression was observed. Line charts show relative tumor size based on Response Evaluation Criteria in Solid Tumors (RECIST v1.1) criteria and serum prostate-specific antigen (PSA) levels. CT images show the decreasing tumor size at indicated time points.
Fig. 4.
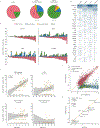
Fig. 4.. Characterization of biological sources and composition of cfDNA variants.
(a) Pie charts representing the distribution of cfDNA somatic mutation for controls (n=47), non-hypermutated cancer cases (n=110) and hypermutated cancer cases (n=10). (b) Bar plots showing the number of somatic variants detected in plasma cfDNA per megabase (Mb, y-axis) for each sample (x-axis) stratified by cancer status and biological sources and ordered by increasing number of somatic WBC-matched variants. The panels show control samples (top left) and patients with MBC (top right), NSCLC (bottom left) and CRPC (bottom right) cancers. The colors are indicated in (a). (c) Association between age (x-axis) and number of cfDNA variants per Mb categorized as WBC-matched, VUSo, tumor biopsy-matched and biopsy-subthreshold. In all panels, the p values were obtained using two-sided Wald tests on the coefficients of zero-inflated Poisson regression models with cancer status and smoking history where applicable as covariates. The cohort consists of n=114 non-hypermutated cancer patients and n=47 non-cancer controls. Only cases with a non-zero number of variants are displayed. (d) Top mutated genes carrying WBC-matched variants for each cohort. The number in the cells indicate the overall number of variants for each gene in the corresponding cohort. (e) Posterior distribution of variant allele fractions (VAF). The scatter plot shows the distribution in VAFs of somatic mutations detected in cfDNA and WBC using the targeted DNA assay and color coded according to source of origin for n=114 non-hypermutated cancer patients and n=47 non-cancer controls. (f) Orthogonal validation of VUSo detected in cfDNA using ddPCR. The VAF measured using ddPCR (x-axis) was plotted according to the cfDNA targeted assay (y-axis). Plasma cfDNA samples and pre-enrichment libraries from seven cancer patients with hotspot mutations not detected in the matched tumor sequencing were subjected to four ddPCR assays. For one patient, only cfDNA isolated from plasma was available. For two patients, both cfDNA and pre-enrichment sequencing libraries were available whilst for the remaining four patients, only libraries were assayed. The sequencing libraries from 12 patients where the ddPCR target variants were not detected by sequencing were used as negative controls. All experiments were performed in triplicate. In (e) and (f), the diagonals represent the line y=x. ND; not detected.
Fig. 5.
Fig. 5.. Characterization of WBC variants.
(a) Direct analysis of somatic variants in WBC. The upper bar plot shows the number of somatic variants detected across 1.1 Mb of genome grouped by age category and ordered by increasing mutational burden. The bottom panel shows the variant allele fractions (VAFs) of all somatic variants in 15 canonical genes associated with clonal hematopoiesis (CH) together with the variant occurring at maximal VAF in WBC. (b) Association of age (x-axis) and number of somatic variants in WBC per Mb (y-axis). The p value was obtained using a two-sided Wald test on the coefficients of a zero-inflated Poisson regression with cancer status as covariate. The analysis included 47 controls and 124 cancer cases. (c) Bar plot showing the percentage of cancer patients (n=114) and control individuals (n=47) harboring a mutation with maximal VAF in a given CH gene. * indicates p=0.0115 and ** indicates p=0.0008. The p values were obtained using a permutation-based likelihood ratio test to assess the significance of the coefficients of a logistic regression with age and smoking history as covariates where applicable. (d) Frequency of mutations in CH genes as a function of the number of non-cancer or cancer patients in the given arm and colored according to the percentage of truncating mutations including frameshifting indel, nonsense and nonstop mutations. Note that some of these patients have ≥1 variant affecting the same canonical CH genes (e.g. DNMT3A, TET2, PPM1D, and ASXL1). The sum of the size of the circles can, therefore, exceed 100%. In all panels, the cohort consists of n=114 cancer patients and n=47 non-cancer controls. In (b), only cases with a non-zero number of CH variants are displayed.

Comment in

Similar articles

Cited by

References

    1. Stroun M, Anker P, Lyautey J, Lederrey C & Maurice PA Isolation and characterization of DNA from the plasma of cancer patients. Eur J Cancer Clin Oncol 23, 707–712 (1987). - PubMed
    1. Leon SA, Shapiro B, Sklaroff DM & Yaros MJ Free DNA in the serum of cancer patients and the effect of therapy. Cancer Res 37, 646–650 (1977). - PubMed
    1. Jr LAD & Bardelli A Liquid Biopsies: Genotyping Circulating Tumor DNA. Journal of Clinical Oncology 32, 579–586 (2014). - PMC - PubMed
    1. Wan JCM, et al. Liquid biopsies come of age: towards implementation of circulating tumour DNA. Nat Rev Cancer 17, 223–238 (2017). - PubMed
    1. Lanman RB, et al. Analytical and Clinical Validation of a Digital Sequencing Panel for Quantitative, Highly Accurate Evaluation of Cell-Free Circulating Tumor DNA. PLoS One 10, e0140712 (2015). - PMC - PubMed

Methods-Only References

    1. Tamborero D, Gonzalez-Perez A & Lopez-Bigas N OncodriveCLUST: exploiting the positional clustering of somatic mutations to identify cancer genes. Bioinformatics 29, 2238–2244 (2013). - PubMed
    1. Shen R & Seshan VE FACETS: allele-specific copy number and clonal heterogeneity analysis tool for high-throughput DNA sequencing. Nucleic Acids Res 44, e131 (2016). - PMC - PubMed
    1. Carter SL, et al. Absolute quantification of somatic DNA alterations in human cancer. Nat Biotechnol 30, 413–421 (2012). - PMC - PubMed
    1. Ulmert D, et al. A novel automated platform for quantifying the extent of skeletal tumour involvement in prostate cancer patients using the Bone Scan Index. Eur Urol 62, 78–84 (2012). - PMC - PubMed
    1. Armstrong AJ, et al. Phase 3 Assessment of the Automated Bone Scan Index as a Prognostic Imaging Biomarker of Overall Survival in Men With Metastatic Castration-Resistant Prostate Cancer: A Secondary Analysis of a Randomized Clinical Trial. JAMA Oncol 4, 944–951 (2018). - PMC - PubMed

Publication types