. 2019 Dec;51(12):1702-1713.
doi: 10.1038/s41588-019-0531-7. Epub 2019 Nov 25.

Stalled developmental programs at the root of pediatric brain tumors

Affiliations

Stalled developmental programs at the root of pediatric brain tumors

Selin Jessa et al. Nat Genet. 2019 Dec.

Abstract

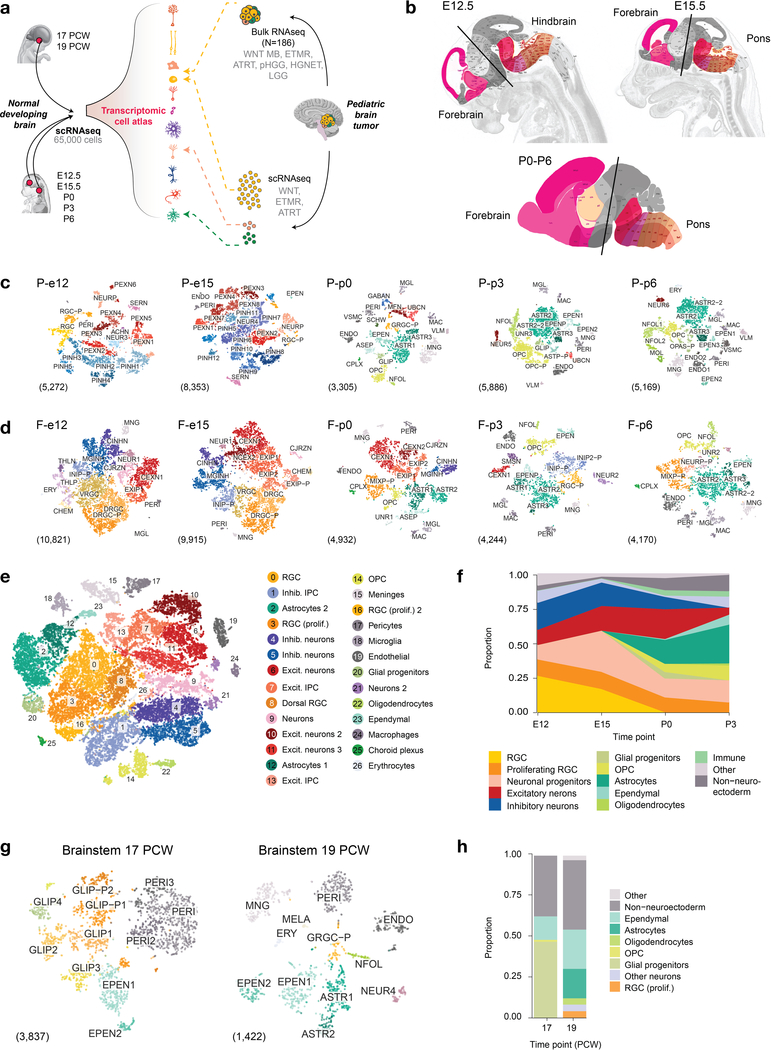
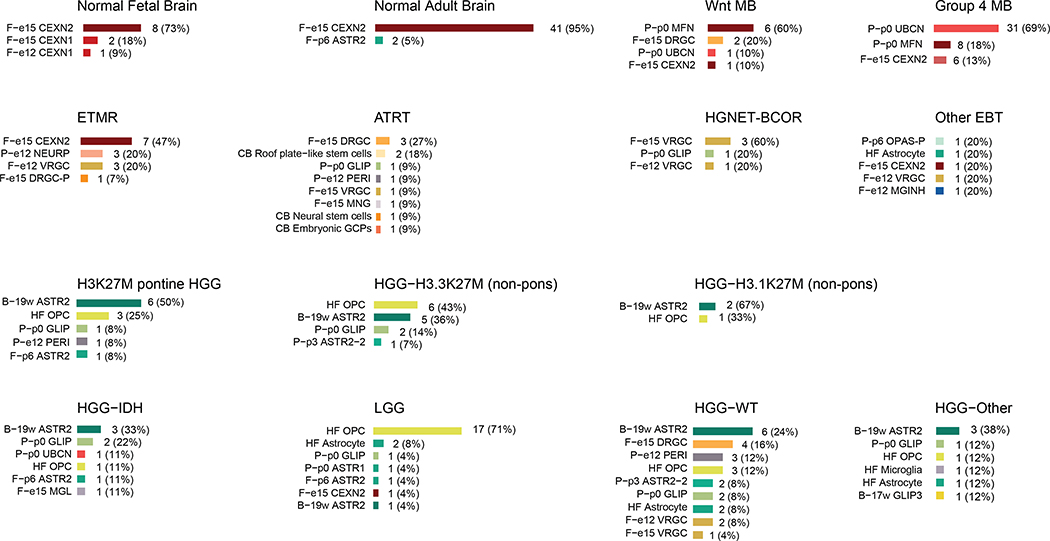
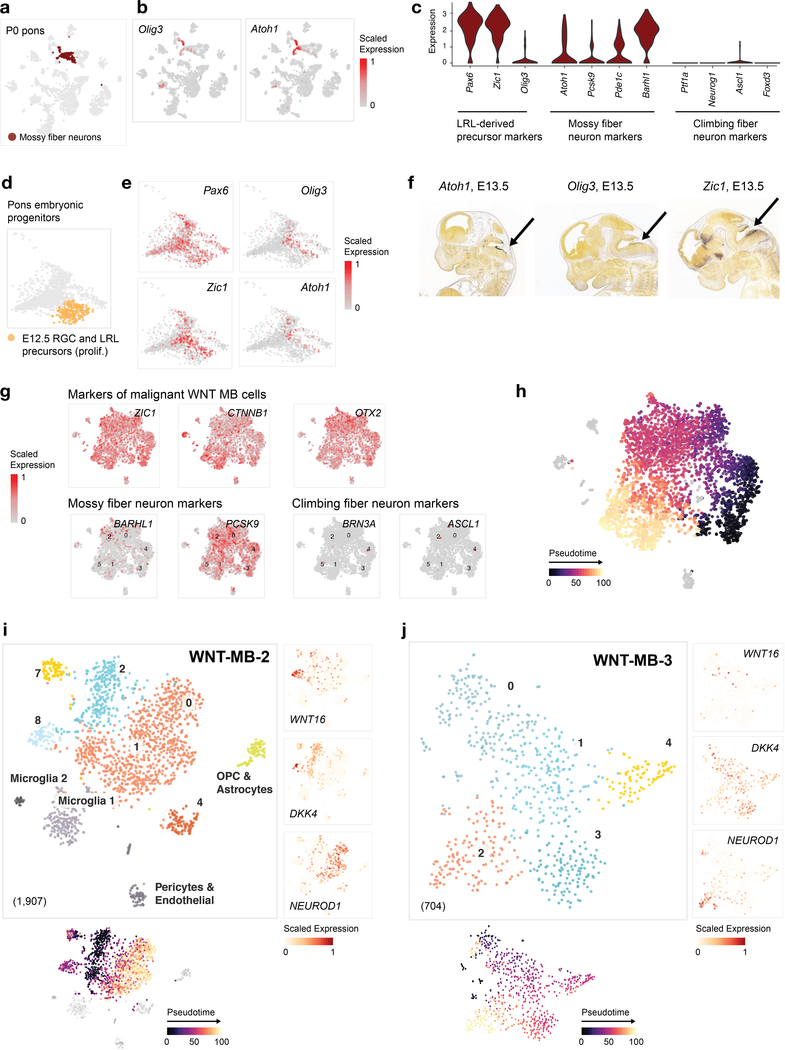
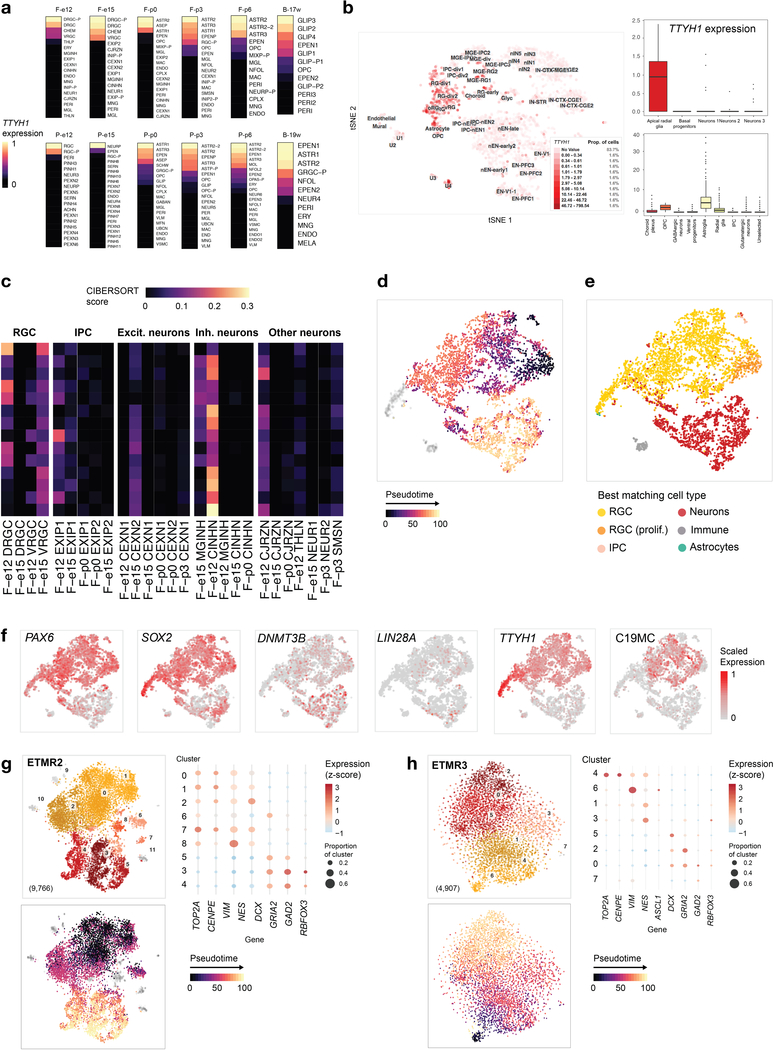
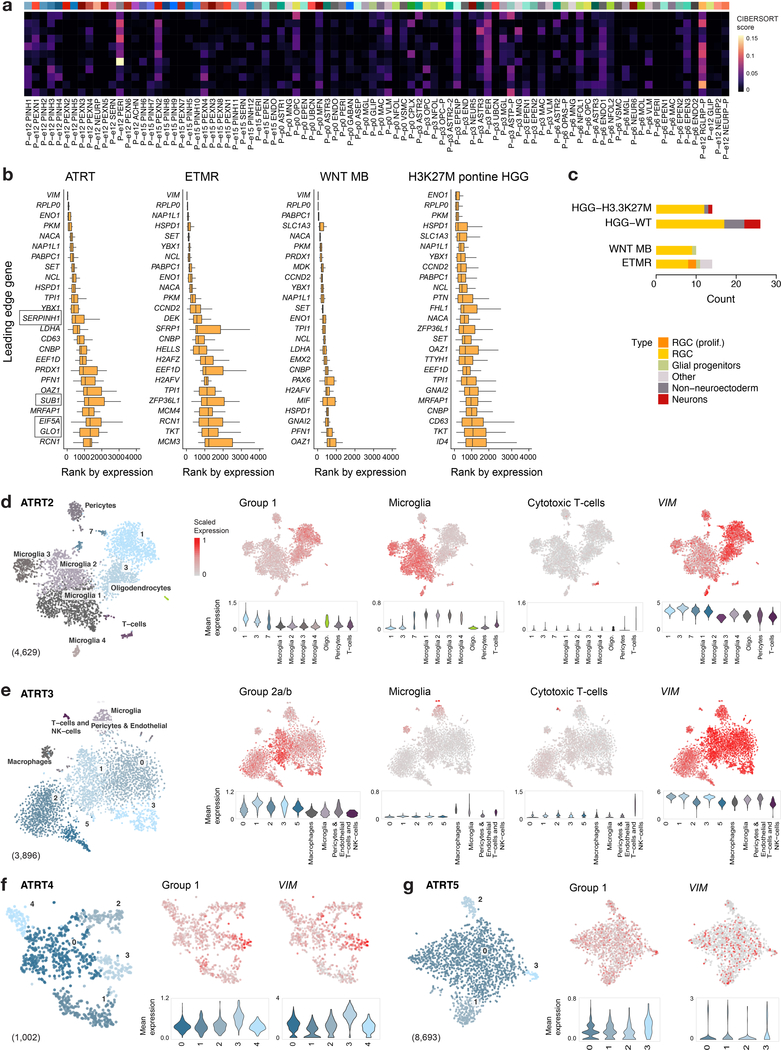
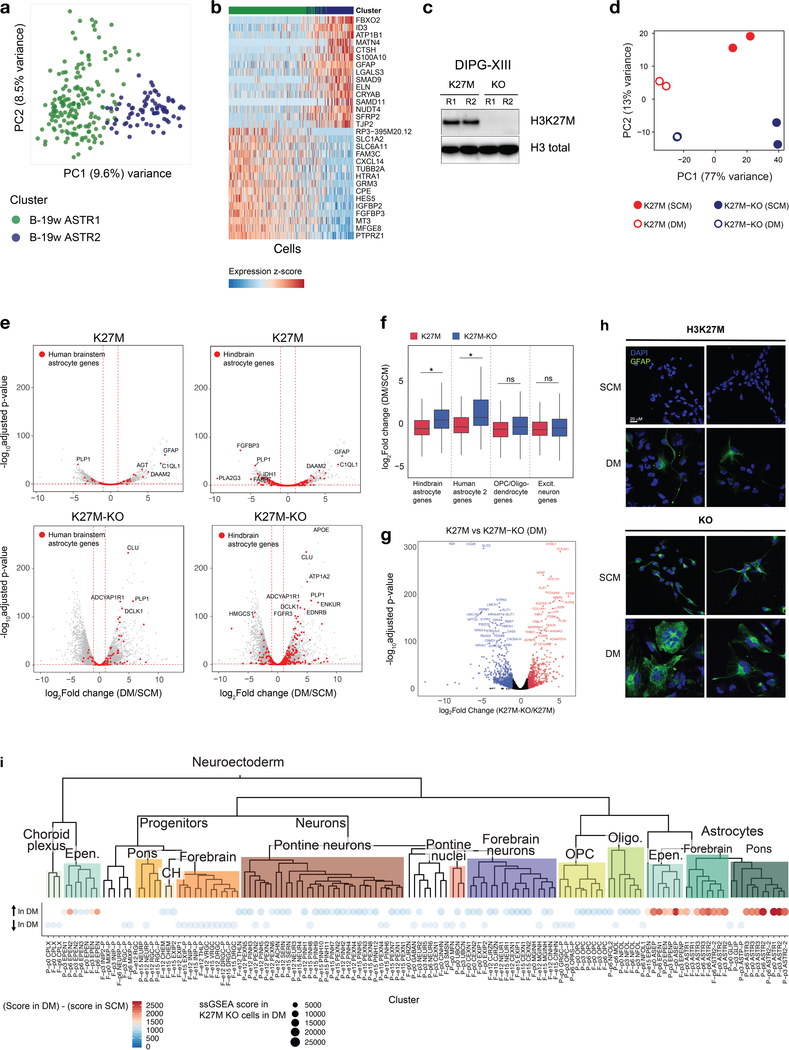
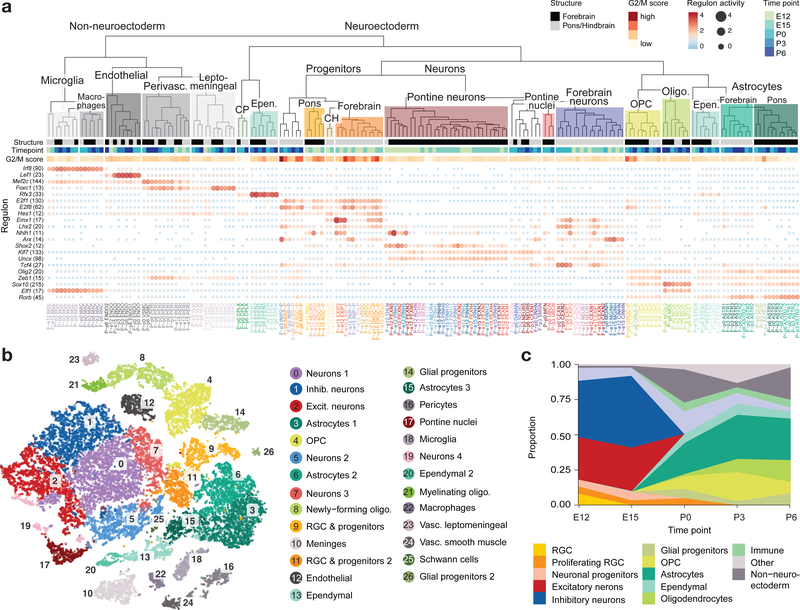
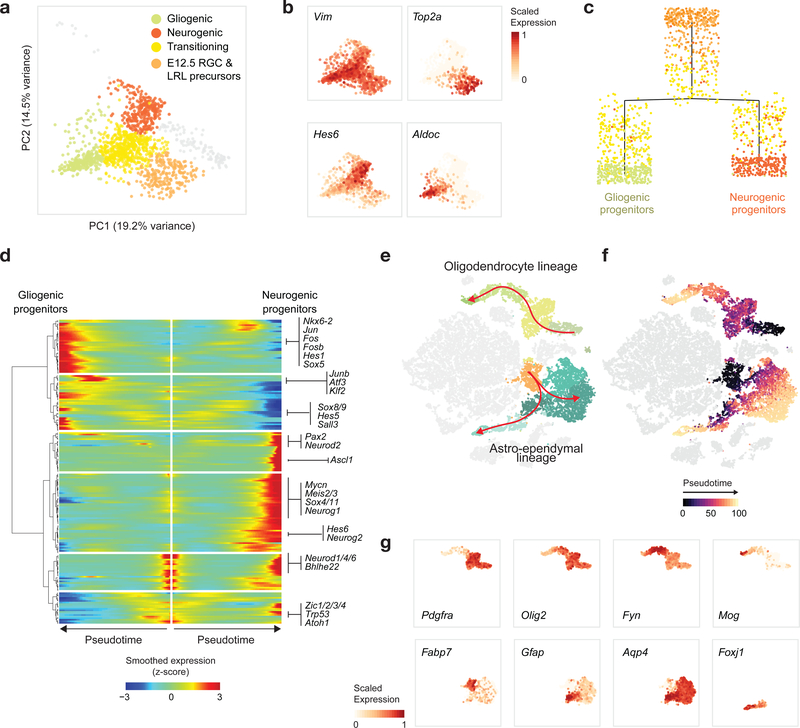
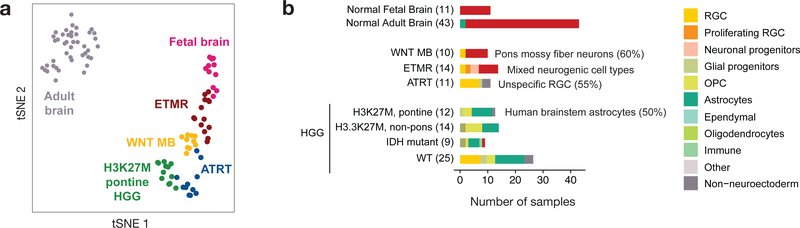
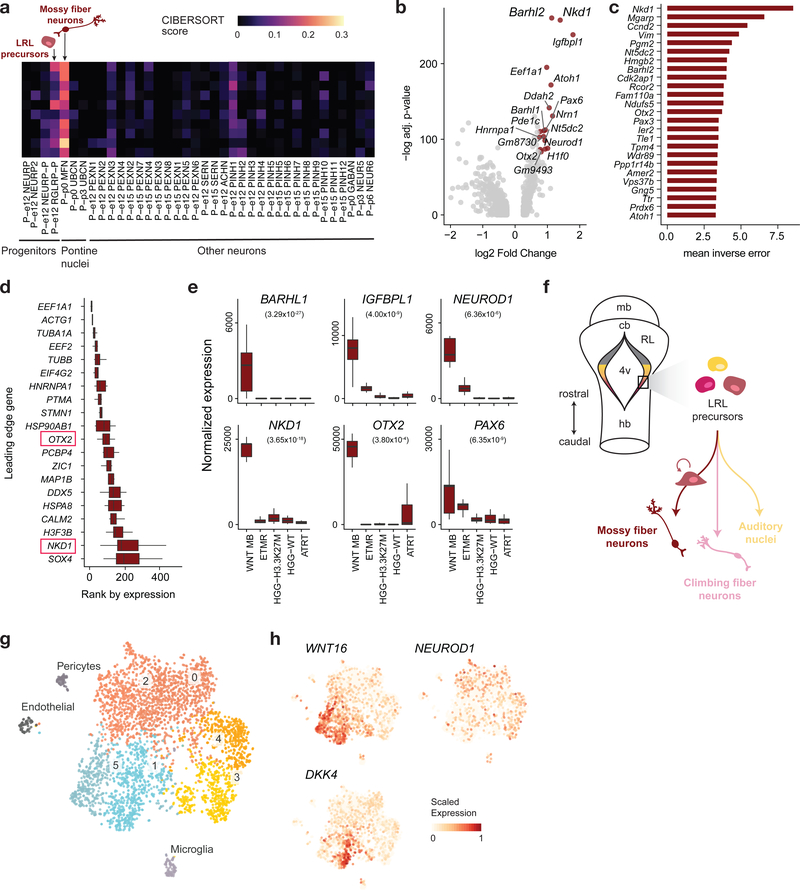
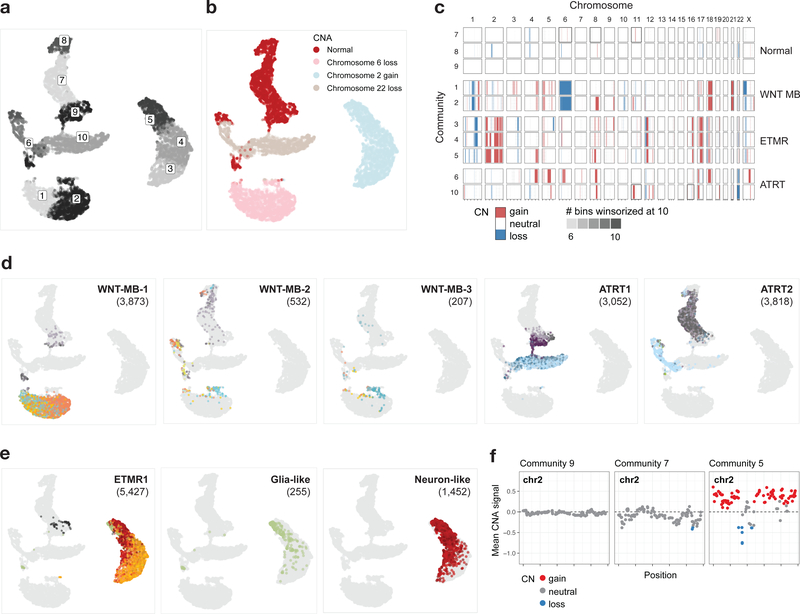
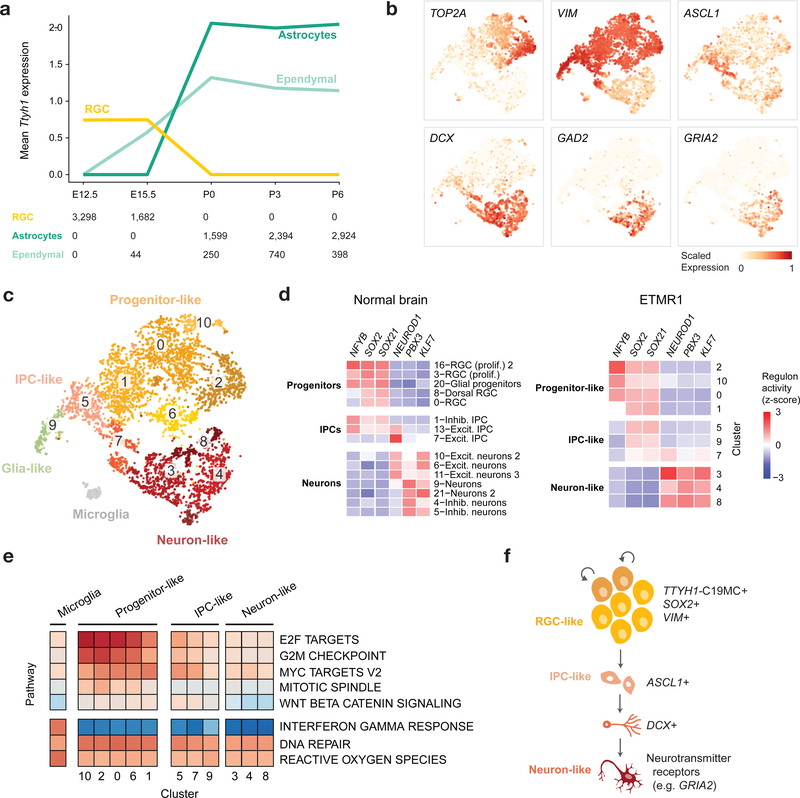
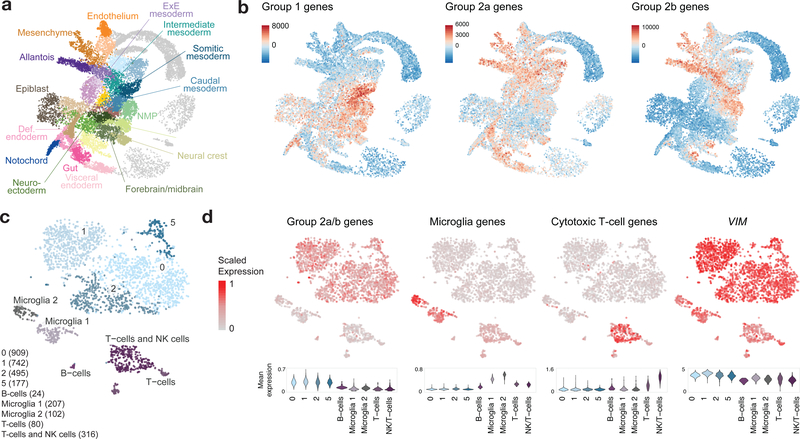
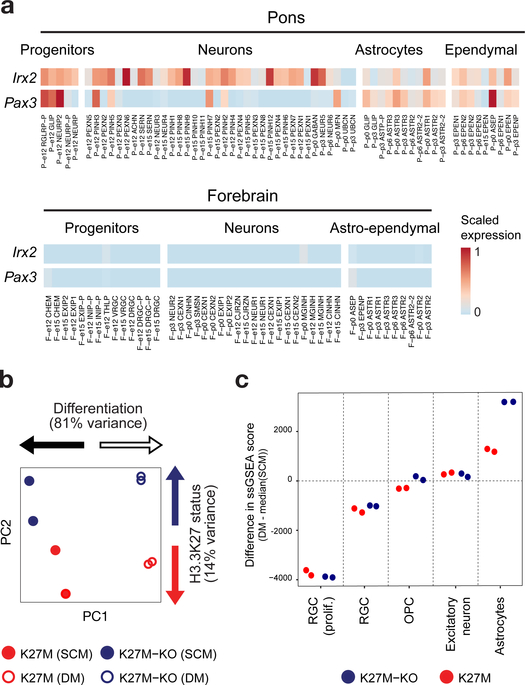
Childhood brain tumors have suspected prenatal origins. To identify vulnerable developmental states, we generated a single-cell transcriptome atlas of >65,000 cells from embryonal pons and forebrain, two major tumor locations. We derived signatures for 191 distinct cell populations and defined the regional cellular diversity and differentiation dynamics. Projection of bulk tumor transcriptomes onto this dataset shows that WNT medulloblastomas match the rhombic lip-derived mossy fiber neuronal lineage and embryonal tumors with multilayered rosettes fully recapitulate a neuronal lineage, while group 2a/b atypical teratoid/rhabdoid tumors may originate outside the neuroectoderm. Importantly, single-cell tumor profiles reveal highly defined cell hierarchies that mirror transcriptional programs of the corresponding normal lineages. Our findings identify impaired differentiation of specific neural progenitors as a common mechanism underlying these pediatric cancers and provide a rational framework for future modeling and therapeutic interventions.


Conflict of interest statement

Competing Interests Statement

The authors declare no competing interests

Figures

Extended Data Fig. 1
Extended Data Fig. 1. Overview of the single-cell transcriptomic atlas of the developing brain
a, Overview of the approach. PCW, post-conception weeks. WNT MB, WNT-subtype medulloblastoma; ETMR, embryonal tumors with multilayered rosettes; ATRT, atypical teratoid/rhabdoid tumors; pHGG, pediatric high-grade gliomas; HGNET, high-grade neuroepithelial tumor; LGG, low-grade gliomas. b, Schematics of mouse brain regions included in dissections; figures adapted from the Allen Brain Atlas. At E12.5 and E15.5, the hindbrain (E12.5) and pons (E15.5) dissections included all of the rhombomere 1 structures with the exception of the cerebellar hemisphere, and all of the structures in rhombomeres 2–11. The forebrain dissections included parts of the dorsal pallium, central subpallium, subpallium, and septopallidal transition area. At P0, P3, and P6, the pons dissections included all of the rhombomere 1 structures with the exception of the prepontine hindbrain, and all of rhombomeres 2–11 with the exception of the roof plate structures in rhombomeres 1 to 6. The forebrain dissections included parts of the alar and roof plates of the telencephalon (including the dorsal pallium and medial pallium), and parts of the thalamus in prosomere 2, the prethalamus in prosomere 3, the preoptic alar plate, and the alar parts of the peduncular and terminal hypothalamus (original figures: © 2008 Allen Institute for Brain Science. Allen Developing Mouse Brain Atlas. Available from: developingmouse.brain-map.org). c, tSNE embeddings of individual mouse hindbrain/pons samples, colored by cluster. Number of cells in each sample is indicated in parentheses at bottom left; see Supplementary Table 2a for description of clusters. d, tSNE embeddings for mouse forebrain samples, as in (c). e, Labeled tSNE embedding of the joint mouse forebrain (n = 33,641 cells; Supplementary Table 2b). f, Proportion of cells from each major cell class in the forebrain over the timecourse. g-h, Overview of single-cell human fetal brainstem dataset. g, Labeled tSNE plots for each sample. Number of cells in each sample is indicated in parentheses at bottom left; see Supplementary Table 2a for description of clusters. h, Proportion of cells from each major cell class in human samples.
Extended Data Fig. 2
Extended Data Fig. 2. Quality control and cell type labeling strategies in scRNAseq atlas of the developing brain
a, Distribution of quality control statistics for the E12.5 mouse forebrain. UMIs, unique molecular identifiers. Number of cells in each cluster is indicated in parentheses; clusters with >100 cells are shown. Violins are colored by cluster identity, and generated as in Figure 7. b, Illustration of quantification of cell-type specific gene sets (Supplementary Table 1a) to assign broad cell class. E12.5 mouse forebrain is shown. Number of cells in each cluster is indicated in parentheses. c-d, Gene expression distribution for selected cell type-specific canonical markers (Supplementary Table 1b) in clusters of the joint mouse pons (c) and forebrain (d). Number of cells in each cluster is indicated in Supplementary Table 2b–c. Violins are colored by cluster identity and generated as in Figure 7, with all violins scaled to the same width. e, Heatmaps of Spearman correlations of gene expression between clusters in the mouse dataset in this study (columns), and representative populations from a published atlas of the mouse central nervous system by Zeisel et al, 2018, Cell (rows). For populations within the Zeisel et al. dataset, a representative cluster was selected from each developmental compartment (see Supplementary Note for details). Color annotation on columns corresponds to cluster identity. Number of cells in each cluster is indicated in Supplementary Table 2a.
Extended Data Fig. 3
Extended Data Fig. 3. Patterning and differentiation dynamics during forebrain development
a, Re-embedding of mouse forebrain progenitor populations from embryonic time points (n = 7,673 cells). Cells are colored by cluster assignment in the re-embedded tSNE space. b, tSNE embedding colored by expression of top discriminant gene markers for each cluster, identified using a random forest-based approach (Supplementary Note). c, In situ hybridization of selected discriminant marker genes, from the Allen Brain Atlas (© 2008 Allen Institute for Brain Science. Allen Developing Mouse Brain Atlas. Available from: developingmouse.brain-map.org) d, Visualization of forebrain cells from E12-P0 by tSNE (n = 25,668 cells). Top row, cell clusters are highlighted by age (left panels), or inferred pseudotime for the cortical excitatory neuron trajectory (right). Bottom row: expression of representative gene markers. Expression of each gene was normalized to a [0, 1] scale for visualization. e, Transcription factor activity along the inferred cortical excitatory neuron trajectory (Supplementary Table 3). f-g, Differentiation dynamics in the ventral forebrain inhibitory lineage as in (d-e). h, Cells in the joint forebrain atlas, as in Extended Data Figure 1e, colored by inferred pseudotime of astro-ependymal and oligodendrocyte (n = 1,354 cells) lineages (n = 4,496 cells). i, Expression of gene markers representative of astro-ependymal (top) and oligodendrocyte (bottom) differentiation, shown in cells from the respective lineages.
Extended Data Fig. 4
Extended Data Fig. 4. Mapping of bulk transcriptomes onto developmental populations
Best matching signatures using ssGSEA for all samples within each tumor type. For ATRT tumors, populations from a recently published timecourse of the developing mouse cerebellum spanning E10-P14 were also included in the projections; cerebellar signatures are denoted by ‘CB’. HGNET-BCOR, high-grade neuroepithelial tumor with BCOR alteration; EBT, embryonal brain tumor; HGG-IDH, IDH-mutant high-grade gliomas; HGG-WT, High-grade gliomas wild-type for histone and IDH1/2 mutations; HF, signature from published scRNAseq human fetal brain dataset containing human cerebral cortex specimens spanning 5–37 PCW. Bars are colored by cluster from which signatures were derived.
Extended Data Fig. 5
Extended Data Fig. 5. Identification of pontine mossy fiber neurons and lower rhombic lip precursors, and analysis of WNT medulloblastoma scRNAseq
a, Mossy fiber neuron cluster (n = 198 cells) highlighted in the tSNE embedding of the P0 mouse pons. b, Left: expression of Olig3, a molecular marker of the lower rhombic lip (LRL), the progenitor domain that gives rise to pre-cerebellar neuron populations including mossy fiber (MF) and climbing fiber (CF) neurons,,. Right: expression of Atoh1, which identifies the MF lineage in the LRL,, and is required for their development. c, Violin plots quantifying expression of genes used to determine cluster identity in the MF neuron population (n = 198 cells). Left: Pax6, Zic1 and Olig3, markers of LRL progenitors that give rise to MF neurons, identified by lineage tracing and loss of function experiments,,,. Pax6 regulates cell fate allocation in the LRL, and Zic1 regulates MF neuron positioning and projections in the developing pons. Middle: Atoh1, a marker of MF lineage in the LRL,,. Pcsk9, a marker of the pontine nucleus, a prominent structure formed exclusively by MF neurons. Barhl1 is required for the formation of MF nuclei, and is expressed in RL-derivatives except for the inferior olivary nucleus (ION, the structure formed by CF neurons, and the source of climbing fibers to the cerebellum). Right: Genes marking the climbing fiber neuron lineage, which also originates from LRL precursors, are absent in the MF population, resolving the cluster identity (Ptf1a, Neurog1/Ngn1 and Ascl1/Mash1). Foxd3 is a marker of the mature ION. Brn3a, which marks the ION throughout its maturation, is undetected. Violin plots are generated as in Figure 7. d-e, PCA of re-clustered pontine progenitors as in Figure 2a, with cluster containing LRL precursors highlighted (d) (n = 393 cells), or cells colored by expression of selected gene markers for LRL precursors (e). Expression of each gene was normalized to a [0, 1] scale for visualization. f, In situ hybridization of selected markers in the E13.5 mouse from the Allen Brain Atlas illustrating expression patterns in the LRL. g, Expression of ZIC1, CTNNB1 and OTX2, mossy fiber neuron marker genes (BARHL1, PCSK9), and climbing fiber neuron marker genes (BRN3A, ASCL1) in the tSNE embedding of the WNT-MB-1 patient tumor sample (n = 3,975 cells). Expression of each gene was normalized to a [0, 1] scale for visualization. Similar expression patterns were observed in the other two patient samples. h, Inferred pseudotime reconstruction from the malignant cells, represented in the tSNE embedding of the WNT-MB-1 patient tumor sample. i-j, Characterization of two patient WNT medulloblastoma scRNAseq samples as in Figure 4. Top left: tSNE and clustering, with non-malignant clusters labeled, and number of cells indicated in parentheses. Top right: expression of marker genes of malignant tumor clusters. Bottom: cells in malignant tumor clusters colored by pseudotime inferred through trajectory analysis.
Extended Data Fig. 6
Extended Data Fig. 6. Profiling of TTYH1 expression and characterization of patient ETMR scRNA-seq and snRNA-seq samples
a, Heatmaps of TTYH1 expression across developing mouse and human brain samples in this study. Expression was normalized to a [0, 1] scale within each sample for visualization. Number of cells in each cluster is indicated in Supplementary Table 2a. b, Expression of TTYH1 in the developing human brain in datasets from three published scRNA-seq studies which profiled 11 human cerebral cortex specimens spanning 5–37 PCW (left, n = 4,261 cells); progenitor and neuron cell populations from 12 and 13 PCW human neocortex specimens (top right, n = 226 cells); and human pluripotent stem-cell derived forebrain organoids (bottom right, n = 11,838 cells). RG, radial glia; oRG, outer radial glia; vRG, ventricular radial glia; IPC, intermediate progenitor cells; IN, inhibitory neuron; EN, excitatory neuron. Boxplots: center line, median; box limits, upper and lower quartiles; whiskers, 1.5x interquartile range; points, outliers. c, Deconvolution (CIBERSORT) analysis of bulk ETMR samples (n = 14), using a panel of signatures from the cortical neuronal lineage. d-f, tSNE embedding of ETMR1 tumor sample (n = 5,427 cells), with cells colored by inferred pseudotime trajectory (d), by best matching cell type when tumor cells were projected onto the developmental atlas using ssGSEA (e), or by expression of selected marker and diagnostic genes (f). Expression of each gene was normalized to a [0, 1] scale for visualization. g-h, Characterization of two additional patient ETMR samples profiled using single-nuclei RNA-sequencing as in Figure 6. Top left: tSNE embedding with cells colored by clustering, and number of cells indicated in parentheses. Bottom left: inferred pseudotime. Right: bubble plots of neuronal lineage markers in tumor clusters.
Extended Data Fig. 7
Extended Data Fig. 7. Characterization and mapping of ATRT patient samples
a, Deconvolution analysis (CIBERSORT) of bulk ATRT patient samples (n = 11), using mouse developmental populations. b, Top 25 leading edge genes driving ssGSEA enrichment of F-e15 Dorsal RGC signature in bulk ATRT samples (n = 11), and other tumor types of focus (ETMR: n =14, WNT-MB: n = 10, HGG: n = 12). Genes which are specific to the leading edge of ATRT are indicated with boxes; all other genes appear in the leading edge for this signature in other tumors. Boxplots: center line, median; box limits, upper and lower quartiles; whiskers, 1.5x interquartile range. c, Best matching developmental populations for bulk tumors by ssGSEA, when the true lineage of origin (glial populations for HGG, and neuronal populations for WNT MB and ETMR) is removed, indicating that most tumors map non-specifically to RGCs in the absence of the lineage of origin. d-e, scRNAseq profiling of two additional patient ATRT samples as in Figure 7. Left: tSNE visualization and clustering, with non-malignant clusters labeled, and number of cells indicated in parentheses. Right panels: mean expression of inferred ATRT subtype, microglia, and cytotoxic T-cell gene signatures, and expression of VIM, represented in tSNE embedding (top) and violin plots generated as in Figure 7 (bottom). Expression of each gene set was normalized to a [0, 1] scale for visualization in tSNE embeddings. f-g, snRNAseq profiling of two additional patient ATRT samples as in (d-e).
Extended Data Fig. 8
Extended Data Fig. 8. Differentiation potential is impaired in H3K27M cells
a-b, Characterization of the 19 PCW human brainstem astrocytes (n = 258 cells), a predominant best match to H3K27M HGG. a, By PCA, the first principal component separates the two populations. b, Heatmap of expression of genes most strongly positively and negatively correlated with PC1. c, Western blot of K27M-mutant H3 protein and total H3 protein confirms presence of mutation and knock-out in each replicate of K27M and KO lines respectively. d-g, Analysis of bulk RNAseq data for DIPG cell lines (n = 2 independent experiments per condition, biological replicates). d, PCA plot. SCM, stem cell media; DM, differentiation media. e, Volcano plots of differential expression analysis between cells in DM vs. SCM for K27M lines (top) and KO lines (bottom). Red color highlights differentially expressed genes present in the human brainstem astrocyte 2 gene signature (left), and any brainstem or pontine astrocyte gene signature (right). P-values (two-sided Wald test) were adjusted using the Benjamini-Hochberg correction. f, Boxplots of log2 fold change of expression for genes in selected developmental signatures, between cells in DM vs. SCM for K27M lines (red) and KO (blue). Statistical significance was assessed using a two-tailed Student’s t-test (p-values: Hindbrain astrocyte: 1.46×10⁻¹³; Human astrocyte: 6.85×10⁻⁵; OPC/Oligodendrocyte: 0.14; Excit. Neuron: 0.12; ns: not significant). Boxplots: center line, median; box limits, upper and lower quartiles; whiskers, 1.5x interquartile range. g, Volcano plot of differential expression analysis between K27M and K27M-KO cell lines in DM; differential expression analysis was performed as described above. h, Representative morphology of GFAP+ cells among cell lines at 60X magnification. Experiment was repeated, and images are shown, for n = 2 biologically independent replicates per condition. i, Bubbleplot of projection of K27M-KO cell lines onto developmental atlas using ssGSEA, shown for the neuroectodermal cell types. The color of the bubbles indicates the change in ssGSEA score for each signature between cell lines in SCM and DM, while the size of the bubbles indicates the ssGSEA score in DM. Cell types are stratified into two rows based on direction of change of the score, upon differentiation. No bubbles are shown for clusters with non-specific gene signatures.
Figure 1 |
Figure 1 |. Single-cell profiling of the developing mouse pons and forebrain.
a, Molecular taxonomy of all cell populations identified at the individual sample level, constructed based on pairwise correlations of gene expression (Spearman). Brain structure, time point, and G2/M score are indicated for each cluster. Select transcription factors with inferred active regulatory modules (regulons) are shown. The activity of each regulon, z-scored across clusters, is indicated by size and color of the bubbles, and the number of target genes in each regulon is indicated in parentheses. CP, choroid plexus; CH, cortical hem; IPC, intermediate progenitor cells; OPC, oligodendrocyte precursor cells; RGC, radial glial cells. b, Labeled tSNE embedding of the mouse pons (n = 27,954 cells; see Supplementary Table 2c). c, Proportion of cells from each major cell class in the pons over the time course.
Figure 2 |
Figure 2 |. Patterning and differentiation dynamics during pontine neurogenesis and gliogenesis.
a, PCA of pontine progenitors from embryonic time points (n = 976 cells). Cells are colored by cluster assignment. RGC, radial glial cells; LRL, lower rhombic lip. b, Pontine progenitors colored by expression of selected canonical gene markers for progenitor-like (Vim), proliferating (Top2a), neurogenic (Hes6), or astrocytic (Aldoc) programs, in the PCA space as in a. c, Inferred differentiation trajectory of pontine progenitors. d, Expression of transcription factors associated with fate decisions along the pontine progenitor differentiation trajectory (Supplementary Table 3). e,f, tSNE plot of the mouse pons as in Figure 1b, with cells in oligodendrocyte (n = 3,800 cells) and astro-ependymal lineages (n = 6,276 cells) indicated (e), or colored by inferred pseudotime for those lineages (f). g, Expression of canonical genes marking oligodendrocyte (top), astrocytic (bottom, Fabp7, Gfap, Aqp4), or ependymal (bottom, Foxj1) differentiation, shown in cells from the respective lineages in tSNE embedding as in e and f.
Figure 3 |
Figure 3 |. Projection onto developmental lineages stratifies bulk patient samples.
a, tSNE visualization of bulk tumor and normal brain samples based on their ssGSEA projections to the developmental atlas segregates tumors by type. ssGSEA scores for the complete developmental dataset are used as features. Visualization is shown for normal fetal (n = 11) and adult (n = 43) brain, and tumor groups of focus. ETMR, embryonal tumor with multilayered rosettes (n = 14); HGG, high-grade glioma (n = 12); WNT MB, WNT-subtype medulloblastoma (n = 10); ATRT, atypical teratoid/rhabdoid tumors (n = 14). b, Best matching developmental populations for normal brain and tumor types of focus. Additional tumors are presented in Extended Data Figure 4. Only tumor samples (excluding cell lines and xenografts) are displayed. For select tumors, the cell type exhibiting the dominant match is indicated. Bar lengths represent number of samples within each tumor type.
Figure 4 |
Figure 4 |. WNT medulloblastomas mirror the lower rhombic lip-derived mossy fiber neurons.
a, Deconvolution analysis (CIBERSORT) of bulk WNT medulloblastoma (MB) patient samples (n = 10), using a panel of signatures comprising pontine neurons and refined progenitors from the mouse embryonic pons. b, Volcano plot for differential gene expression analysis between mossy fiber neurons (n = 198 cells) and all other postnatal pontine neuron clusters (n = 939 cells). P-values (two-sided Wilcoxon rank sum test) were adjusted for multiple testing using the Bonferroni correction. c, Genes discriminant of mossy fiber neurons, identified using a random forest-based approach (Supplementary Note), are ranked by their classification score. d, Top 20 genes contributing to the ssGSEA enrichment of the mossy fiber neuron signature in bulk WNT MB transcriptomes (n = 10), identified using a leading-edge analysis. Boxplots represent the rank of expression of each gene in bulk transcriptomes, and genes are sorted by their median rank of expression. Center line, median; box limits, upper and lower quartiles; whiskers, 1.5x interquartile range. Genes highly specific to mossy fiber neurons as identified in b and c are indicated by a red box. e, Boxplots of bulk RNA-seq expression of mossy fiber neuron lineage genes, which are significantly upregulated in WNT MB compared to other tumor types shown (WNT MB: n = 10; ETMR: n = 14; HGG-H3.3K27M: n = 12; HGG-WT: n = 24; ATRT: n = 10). P-values (two-sided Wald test) adjusted using the Benjamini-Hochberg correction are indicated in parentheses. Center line, median; box limits, upper and lower quartiles; whiskers, 1.5x interquartile range. f, Model of WNT medulloblastoma lineage of origin. mb, midbrain; cb, cerebellum; RL, rhombic lip; 4v, fourth ventricle; hb, hindbrain; LRL, lower rhombic lip. g,h, Visualization of a patient WNT medulloblastoma scRNA-seq sample (n = 3,875 cells). g, tSNE and clustering, with non-malignant clusters labeled by cell type, and malignant clusters labeled with numbers. h, Expression of marker genes of malignant tumor clusters. Complementary analysis for additional scRNA-seq samples is shown in Extended Data Figure 5.
Figure 5 |
Figure 5 |. Copy number aberration (CNA) analysis on scRNA-seq tumor samples.
a, UMAP embedding of cells based on copy number signal, colored by community. Communities are defined based on copy number signal (n = 16,966 cells; Supplementary Note). b, UMAP embedding of cells colored by prominent copy number change. c, Copy number profile per community per chromosome. Copy number is called per community defined in a, with each community containing cells from one or more patient samples. d, UMAP embedding, with cells from each WNT and ATRT tumor sample colored by their cluster assignment in the individual sample space, and others in gray. Number of cells is indicated for each sample in parentheses. e,f, CNA calling for ETMR1 sample. e, ETMR1 cells in UMAP space, colored by cluster as in d (left) with similar plots for glia-like (middle) or neuron-like (right) tumor cells only. f, Binned copy number signal on chromosome 2, colored by segmentation from the HMM-based approach to call copy number, shown for communities 5, 7, and 9. Each point represents a genomic bin.
Figure 6 |
Figure 6 |. ETMRs fully recapitulate a neuronal lineage.
a, Mean expression of Ttyh1 in the developing mouse brain. RGCs, astrocytes, and ependymal cells are shown, with number of cells for each type indicated at the bottom. Expression across the complete dataset is presented in Extended Data Figure 6. b-e, scRNA-seq profiling of an ETMR patient sample (n = 5,427 cells). Additional samples are shown in Extended Data Figure 6. b, Gene expression of representative markers from the neuronal differentiation path. Expression of each gene was scaled to [0, 1] for visualization. c, tSNE and clustering, with non-malignant cluster labeled by cell type and malignant clusters labeled with numbers only. d, Heatmap of inferred transcription factor regulon activation in the normal mouse forebrain (left) and clusters of the ETMR patient sample (right). e, Heatmap of ssGSEA enrichment of Hallmark biological pathways (rows) in clusters of the ETMR patient sample (columns). f, Model of ETMR tumor architecture, recapitulating a neuronal differentiation program.
Figure 7 |
Figure 7 |. Group 2a/b ATRTs do not match neuroectodermal cell types.
a, UMAP visualization of a published atlas of mouse embryogenesis between E6.5-E8.5 (n = 18,140 cells). Def, definitive; ExE, extra-embryonic; NMP, neuromesodermal progenitors. b, ssGSEA scores of ATRT molecular subtype gene signatures (Supplementary Table 1a) in the embryogenesis atlas. c, scRNA-seq profiling of a patient ATRT sample: tSNE visualization and clustering, with non-malignant tumor clusters labeled by cell type, and malignant clusters labeled with numbers only. Number of cells in each cluster is indicated at bottom left in parentheses. Additional samples shown in Extended Data Figure 7. d, Mean expression of ATRT Group 2a/b, microglia, and cytotoxic T-cell gene signatures (Supplementary Table 1a), and expression of VIM, represented in the tSNE embedding (top) and violin plots (bottom). Violin plots display a kernel density estimate computed on the full range of the underlying data without removal of outliers. The tails of the resulting violins are trimmed to the range of the data. Violins are scaled to the same area.
Figure 8 |
Figure 8 |. Differentiation potential is impaired in H3K27M cells.
a, Heatmap of expression of Irx2 and Pax3, core transcription factors in H3K27M HGG, in the mouse atlas. Expression was normalized to a [0, 1] scale for visualization. b,c, RNA-seq from H3.3 K27M pontine HGG primary tumor-derived cell lines and isogenic K27M-KO lines maintained in stem cell media (SCM) or subjected to a differentiation protocol (DM). Experiment was performed for n = 2 biologically independent replicates per condition. b, PCA based on ssGSEA projections of bulk transcriptomes onto developmental cell populations. c, Change in ssGSEA score after differentiation protocol for each individual replicate, for select signatures. All neuroectodermal signatures are shown in Extended Data Figure 8.

Similar articles

Cited by

References

    1. Kieran MW, Walker D, Frappaz D & Prados M Brain tumors: from childhood through adolescence into adulthood. J Clin Oncol 28, 4783–4789 (2010). - PubMed
    1. Fontebasso AM et al. Epigenetic dysregulation: a novel pathway of oncogenesis in pediatric brain tumors. Acta neuropathologica 128, 615–627 (2014). - PMC - PubMed
    1. Jacob K et al. Genetic aberrations leading to MAPK pathway activation mediate oncogene-induced senescence in sporadic pilocytic astrocytomas. Clin. Cancer Res. 17, 4650–4660 (2011). - PubMed
    1. Johann PD et al. Atypical teratoid/rhabdoid tumors are comprised of three epigenetic subgroups with distinct enhancer landscapes. Cancer Cell 29, 379–393 (2016). - PubMed
    1. Northcott PA et al. The whole-genome landscape of medulloblastoma subtypes. Nature 547, 311–317 (2017). - PMC - PubMed

Methods-only references

    1. Nguyen QH et al. Profiling human breast epithelial cells using single cell RNA sequencing identifies cell diversity. Nat. Commun 9, 2028 (2018). - PMC - PubMed
    1. Nagy C et al. Single-nucleus RNA sequencing shows convergent evidence from different cell types for altered synaptic plasticity in major depressive disorder. bioRxiv, 384479, doi:10.1101/384479 (2019). - DOI
    1. Morrissy AS et al. Divergent clonal selection dominates medulloblastoma at recurrence. Nature 529, 351–357 (2016). - PMC - PubMed
    1. Bolger AM, Lohse M & Usadel B Trimmomatic: a flexible trimmer for Illumina sequence data. Bioinformatics 30, 2114–2120 (2014). - PMC - PubMed
    1. Li H et al. The Sequence Alignment/Map format and SAMtools. Bioinformatics 25, 2078–2079 (2009). - PMC - PubMed

Publication types

MeSH terms