. 2020 Jan;21(1):42-53.
doi: 10.1038/s41590-019-0539-2. Epub 2019 Nov 25.

Endogenous oxidized phospholipids reprogram cellular metabolism and boost hyperinflammation

Affiliations

Endogenous oxidized phospholipids reprogram cellular metabolism and boost hyperinflammation

Marco Di Gioia et al. Nat Immunol. 2020 Jan.

Abstract

Pathogen-associated molecular patterns (PAMPs) have the capacity to couple inflammatory gene expression to changes in macrophage metabolism, both of which influence subsequent inflammatory activities. Similar to their microbial counterparts, several self-encoded damage-associated molecular patterns (DAMPs) induce inflammatory gene expression. However, whether this symmetry in host responses between PAMPs and DAMPs extends to metabolic shifts is unclear. Here, we report that the self-encoded oxidized phospholipid oxPAPC alters the metabolism of macrophages exposed to lipopolysaccharide. While cells activated by lipopolysaccharide rely exclusively on glycolysis, macrophages exposed to oxPAPC also use mitochondrial respiration, feed the Krebs cycle with glutamine, and favor the accumulation of oxaloacetate in the cytoplasm. This metabolite potentiates interleukin-1β production, resulting in hyperinflammation. Similar metabolic adaptions occur in vivo in hypercholesterolemic mice and human subjects. Drugs that interfere with oxPAPC-driven metabolic changes reduce atherosclerotic plaque formation in mice, thereby underscoring the importance of DAMP-mediated activities in pathophysiological conditions.


Figures
Extended Data Fig. 1
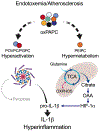
Extended Data Fig. 1. oxPAPC drives hyperactivation and hypermetabolism in macrophages.
Schematic depicting oxPAPC activities. oxPAPC is a mixture of oxidized phospholipids that induce an hyperinflammatory state in phagocytes upon LPS encounter and/or during atherosclerosis development. Moieties such as POVPC or PGPC contained in oxPAPC drive the formation of hyperactive cells that are characterized by inflammasome activation in the absence of pyroptosis. In contrast to POVPC or PGPC, PEIPC engages a hypermetabolic state in phagocytes that favors IL-1β accumulation and that is characterized by: i) the simultaneous activation of OXPHOS and aerobic glycolysis; ii) glutamine utilization to feed the TCA cycle; iii) oxaloacetate (OAA) accumulation in the cytoplasm to potentiate HIF-1α activation.
Figure 1.
Figure 1.. oxPAPC induces a hypermetabolic state in macrophages
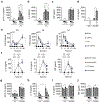
a, b) Bone marrow-derived macrophages (BMDMs) were primed or not with LPS (1 μg/ml) for 3 hours and then stimulated with oxPAPC (100 μg/ml) for 24h. OCR (a) (left panels: kinetic line graph; right panels: basal OCR, ATP-linked respiration and MRC bar graphs) and ECAR (b) (left panel: kinetic line graph; right panel: basal ECAR bar graph) were measured using a Seahorse Analyzer. c) BMDMs were treated as in (a, b) and Δψm was assessed by cytofluorimetry. Left panels: cytofluorimetry contour plot, right panel: bar graph. Δψm is calculated as the ratio between the fluorescent intensity of TMRM and the fluorescent intensity of mitochondrial mass (MitoTracker Green). Bars represent the Δψm of cells treated as indicated relative to untreated cells. Graphs and images are representative of one out of three independent experiments. Graphs show mean ± s.e.m. of twelve (a-b) or three (c) biological samples. Statistical comparisons were calculated by using two-way ANOVA (*P < 0.05, **P < 0.01, ***P < 0.001 and ****P < 0.0001).
Figure 2.
Figure 2.. oxPAPC promotes a hyperinflammatory phenotype in LPS-stimulated macrophages.
a-c) BMDMs were primed or not with LPS and then treated, or not, with oxPAPC (100, 50 and 25 μg/ml). Indicated cytokines were quantified 24h later from cell lysate (pro-IL-1β) (a) or from supernatant (IL-6, TNF) (b, c). d) BMDMs were primed or not with LPS and then treated, or not, with oxPAPC (100 μg/ml) for 24h. Cells were then administered or not with ATP (3 mM) and 6h later the amount of IL-1β released in the supernatant was measured. e) BMDMs were primed or not with LPS and then treated, or not, with oxPAPC (100 μg/ml). Indicated mRNA was measured at the indicated time points. f) Mice (n=5) were injected with LPS (1mg/Kg) or vehicle (PBS) for 5h and then challenged, or not, with oxPAPC (80mg/Kg). Blood serum was collected 2h after oxPAPC administration and IL-1β, IL-6 and TNF were quantified. g-j) BMDMs were primed with LPS and then treated, or not, with PEIPC (50 μM) and/or POVPC (100, 50 and 25 μM). Indicated cytokines were quantified 24h later from cell lysate (pro-IL-1β) (g) or from supernatant (IL-1β, IL-6, TNF) (h-j). Graphs are representative of one out of three (a-e) or two (g-j) independent experiments. Graphs show mean ± s.e.m. of six (a-c), three (d-e) or four (g-j) biological samples. Statistical comparisons were calculated by using two-way ANOVA (a-e, g-j) or two-tailed t test (f) (*P < 0.05, **P < 0.01, ***P < 0,001 and ****P < 0,0001).
Figure 3.
Figure 3.. Nitric oxide inhibition and respiration maintenance promoted by oxPAPC enables the hyperproduction of IL-1β.
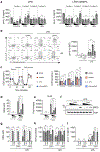
a) BMDMs were primed with LPS and then stimulated, or not, with oxPAPC (100 μg/ml) in the presence or absence of rotenone (10, 1, 0.1 μM), dimethyl malonate (DMM) (10, 5, 2.5 μM), antimycin A (AA) (5, 2.5, 1.25 μM) or sodium azide (NaN3) (200, 20, 2 μM). Pro-IL-1β was measured 24 hours later. b) BMDMs were primed or not with LPS and then stimulated with oxPAPC (100 μg/ml) in the presence or absence of AA (5 μM). Pro-IL-1β and Δψm were measured by cytofluorimetric intracellular staining. Left panels: cytofluorimetry contour plot, right panel: bar graph. Bars represent the mean fluorescence intensity (MFI) of pro-IL-1β staining. c) BMDMs were primed, or not, with LPS and then stimulated, or not, with oxPAPC (100 μg/ml) for 24h. The electron flow activity through the different complexes of ETC was analyzed in permeabilized cells using the indicated inhibitors or substrates. Left panel: line graph; right panel: bar graph. d-f) BMDMs were primed, or not, with LPS and then stimulated, or not, with oxPAPC (100, 50 and 25 μg/ml). 24h later nitrite concentration (d), Nos2 mRNA(e), and iNOS protein (f) were analyzed. g-i) BMDMs were primed, or not, with LPS and then stimulated, or not, with oxPAPC (100 μg/ml) in the presence or absence of either SNAP (500 μM) or SMIT (500 μM). Nitrate production (g) was measured 24h later. Basal OCR (h) was analyzed, and pro-IL-1β (i) was measured from cell lysate. Graphs are representative of one out of two (a), three (b-c, e-i) or ten (d) independent experiments. Graphs show mean ± s.e.m. of three (a-b, d-g, i), six (c) or seven (h) biological samples. Statistical comparisons were calculated by using two-way ANOVA (*P < 0.05, **P < 0.01, ***P < 0,001 and ****P < 0,0001).
Figure 4.
Figure 4.. Glutamine is strictly required for oxPAPC-mediated hyperinflammation
a-c) BMDMs were primed or not with LPS and then stimulated with oxPAPC (100 μg/ml) for 24h in a medium containing the indicated carbon sources. pro-IL-1β was measured by cytofluorimetric intracellular staining. Left panels: cytofluorimetry histograms, right panel: bar graph. Bars represent the mean fluorescence intensity (MFI) of pro-IL-1β. Ctl: Vehicle-treated cells; Gln: glutamine; DM-αKG: dimethyl α-ketoglutarate. d) BMDMs were primed (right panel) or not (left panel) with LPS and then stimulated with oxPAPC (100 μg/ml) for 24h. OCR was measured under glutamine deprivation (25 mM glucose as the only substrate in the medium) or after glutamine (2mM) injection using a Seahorse Analyzer. Gln: glutamine; NT: not treated. e) BMDMs were primed or not with LPS and then stimulated, or not, with oxPAPC (100 μg/ml). The transcription of the indicated glutamine transporters was measured 24h later. f, g) BMDMs were primed or not with LPS and then stimulated with oxPAPC (100 μg/ml) for 24h in a medium containing the indicated carbon sources (Glucosehigh=25mM; Glucoselow=5mM Glutamine+=2mM; Glutamine=0mM). Pro-IL-1β and Δψm were measured by cytofluorimetric intracellular staining. Cytofluorimetry contour plot (f) and bars that represent the mean fluorescence intensity (MFI) of pro-IL-1β or Δψm (g) are shown. Graphs are representative of one out of four (a-d, f-g) or three (e) independent experiments. Graphs show mean ± s.e.m. of three (a-c, f-g) four (e) or six (d) biological samples. Statistical comparisons were calculated by using two-way ANOVA (*P < 0.05, **P < 0.01, ***P < 0.001 and ****P < 0.0001).
Figure 5.
Figure 5.. oxPAPC potentiates HIF-1α through oxaloacetate accumulation
a, b) Immunoblot (a) and cytofluorimetry (b) measurement of HIF-1α and IL-1β protein levels after 24h of oxPAPC treatment (100, 50 and 25 μg/ml) in BMDMs primed, or not, with LPS. c-e) Immunoblot measurement of HIF-1α and IL-1β protein levels after 24h of oxPAPC treatment (100 μg/ml) in BMDMs primed, or not, with LPS cultured in a medium containing Antymicin A (AA) (5 μM) (c), SNAP (500 μM) (d), or the carbon sources indicated in Fig. 4f, g (e). f) BMDMs primed with LPS and treated, or not, with oxPAPC (100 μg/ml). Citrate levels were quantified from cell lysates by fluorescence and normalized for the protein content. g) BMDMs primed with LPS were treated, or not, with oxPAPC (100 μg/ml). 24 hours later, cells were incubated with [U-13C]-glutamine for 4h. The percentage of M+0 to M+6 citrate is shown. h, i) BMDMs primed with LPS were treated, or not, with oxPAPC (100 μg/ml). 24 hours later, a metabolomics analysis was performed. The sparse Partial Least Squares Discriminant Analysis (sPLS-DA) two-dimensional scores plot (h) and the volcano plot (i) are shown. Oxaloacetate (OAA) and citrate are highlighted in orange (n=6 independent experiments). j, k) Pro-IL-1β and HIF-1α protein levels were measured by cytofluorimetry in BMDMs primed, or not, with LPS and treated, or not, with oxaloacetate (OAA) (50, 25, 12.5 mM). Cytofluorimetry contour plot (j) and bars represent the mean fluorescence intensity (MFI) of pro-IL-1β (left) and HIF-1α (right) (k) are shown. Graphs and images are representative of one out of three (a-g, j-k) independent experiments. Graphs show means ± s.e.m. of three (f, g, k) biological replicates. Statistical comparisons were calculated by using two-way ANOVA (*P < 0.05, **P < 0.01, ***P < 0.001 and ****P < 0.0001).
Figure 6.
Figure 6.. The conversion of citrate into oxaloacetate in the cytoplasm governs the induction of the hyperinflammatory phenotype in macrophages treated with oxPAPC and LPS.
a) BMDMs primed with LPS were treated, or not, with oxPAPC (100 μg/ml). 24 hours later, the citrate and oxaloacetate levels were quantified from cell lysates by fluorescence and normalized for the protein content. Ratio normalized on untreated cells is shown. OAA: oxaloacetate. b) BMDMs primed with LPS were treated, or not, with oxPAPC (100 μg/ml). 24 hours later the levels of Acly mRNA were assessed. c, d) BMDMs primed, or not, with LPS were treated, or not, with oxPAPC (100 μg/ml) in the presence, or absence, of CTPi (0.5, 0.2 and 0.1 mM in c, 1 mM in d) or ACL inhibitor BMS-303141 (ACLi) (30, 15 and 7.5 μM in c, 30 μM in d). 24 hours after LPS administration, pro-IL-1β was quantified by flow cytometry (c) (left panel: histogram; right panel: bar graph) and pro-IL-1β or HIF-1α protein levels were measured by immunoblotting (d). e) BMDMs primed, or not, with LPS were treated, or not, with oxPAPC (100 μg/ml) in a medium containing or not glutamine (Gln-), and in the presence, or absence, of CB-839 (GLSi) (1 μM), CTPi (0.5 mM) and ACLi (30 μM). All treatments were performed in presence, or absence (−), of oxaloacetate (25mM). pro-IL-1β (left) and HIF-1α were measured by cytofluorimetry. Left panel: cytofluorimetry contour plot; right panels: graph bars (mean fluorescence intensity, MFI). Graphs and images are representative of one out of three (a, b) or two (c-e) independent experiments. Graphs show mean ± s.e.m. of three (a, b) or four (c, e) biological replicates. Statistical comparisons were calculated by using two-way ANOVA (*P < 0.05, **P < 0.01, ***P < 0.001 and ****P < 0.0001).
Figure 7.
Figure 7.. oxPAPC-driven immunometabolic adaptations occur in hypercholesterolemic mice.
a-g) Wild type (WT), Ldlr−/− and Apoe−/− mice (n=5) were fed a western diet (WD) for 4 weeks. As control, WT mice were also fed a conventional diet (CD). Mice (n=6) were injected with LPS (1 mg/Kg) and Ldlr−/− mice were also treated, or not, with GLSi or ACLi 1 hour before LPS injection. Serum levels of IL-1β (a, f), TNF (b) and IL-6 (c) were 5h later. Body temperature loss was measured 8h later (e) and survival was followed over time (d, g). h-m) BMDMs were treated, or not, with oxPAPC (100 μg/ml) for 24 hours and activated, or not, with LPS (1 μg/ml). In some experiments, cells were cultured in the absence of glutamine (Gln-) or in the presence of GLSi (1 μM), CTPi 0.5 mM) or ACLi (30 μM). Δψm was assessed by cytofluorimetry at the indicated time points after LPS administration (h). The indicated metabolic parameters (i) were measured 8h after LPS administration. At the indicated time points after LPS administration, the indicated cytokines were quantified either by ELISA (pro-IL-1β from cell lysate; IL-1β, TNF, IL-6 from supernatant) (j) or by qPCR (k), while nitrite concentration was measured using Greiss reagent (j) and iNOS mRNA levels were measured by qPCR (k). pro-IL-1β from cell lysate and secreted IL-1β from supernatant were measured 18h after LPS administration (l,m). Graphs and images are representative of one out of three (h-k) or two (l, m) independent experiments. Graphs show mean ± s.e.m. of three (h, j-m) or six (i) biological samples. Statistical comparisons were calculated by using one-way ANOVA (a-c, e-f), two-way ANOVA (h, j-m) and Long-rank test with Bonferroni correction (d, g). (*P < 0.05, **P < 0.01, ***P < 0.001 and ****P < 0.0001).
Figure 8.
Figure 8.. The hypermetabolism induced by oxidized phospholipids can be targeted against atherosclerosis.
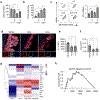
a-c) oxLDL-treated BMDMs (oxLDL) or naïve BMDMs (−) were treated or not with LPS and 24 hours later OCR (a), ECAR (b) and Δψm (c) were measured d-f) Ldlr−/− mice (n=5) were fed a WD for 4 weeks and treated, or not, with GLSi (12.5 mg/Kg) or ACLi (10 mg/Kg) three times/week. IL-1β (d, e) was quantified as mean of fluorescence intensity in CD68-positive cells from aortic plaques. Lesion areas (f) were quantified using Oil Red O (ORO) and hematoxylin staining. Scale bar: 10 μm. g, h) Heat map of standardized gene coefficients in linear regression for HDL-C, LDL-C, Triglycerides or Total Cholesterol (Cholesterol). The set of genes upregulated by oxPAPC in mouse, plus (downregulated) Nos2 (in blue), are shown (g). Gene Set Enrichment Analysis p-value and enrichment plot of the oxPAPC signature against genes ranked by association with pro-atherosclerotic lipids in the FHS cohort (h) support that oxPAPC-induced genes identified in mouse show consistent expression patterns in humans. Graphs and images are representative of one out of three (a-c) independent experiments. Graphs show mean ± s.e.m. of six (a, b) or three (c) biological samples. Statistical comparisons were calculated by using two-way ANOVA (a-c) or one-way ANOVA (e, f) (*P < 0.05, **P < 0.01, ***P < 0.001 and ****P < 0.0001).

Comment in

  • DAMP-driven metabolic adaptation.
    Minton K. Minton K. Nat Rev Immunol. 2020 Jan;20(1):1. doi: 10.1038/s41577-019-0258-9. Nat Rev Immunol. 2020. PMID: 31792373 No abstract available.

References

    1. Brubaker SW, Bonham KS, Zanoni I & Kagan JC Innate Immune Pattern Recognition: A Cell Biological Perspective. Annu Rev Immunol (2015). - PMC - PubMed
    1. Janeway CA Jr. Approaching the asymptote? Evolution and revolution in immunology. Cold Spring Harb Symp Quant Biol 54 Pt 1, 1–13 (1989). - PubMed
    1. Matzinger P Tolerance, danger, and the extended family. Annu Rev Immunol 12, 991–1045 (1994). - PubMed
    1. Nathan C Points of control in inflammation. Nature 420, 846–852 (2002). - PubMed
    1. Iwasaki A & Medzhitov R Regulation of adaptive immunity by the innate immune system. Science 327, 291–295 (2010). - PMC - PubMed

Publication types

MeSH terms

Substances