. 2019 Nov 21;8(11):e1094.
doi: 10.1002/cti2.1094. eCollection 2019.

Tissue-specific tumor microenvironments influence responses to immunotherapies

Affiliations

Tissue-specific tumor microenvironments influence responses to immunotherapies

Amanda J Oliver et al. Clin Transl Immunology. .

Abstract

Objectives: Investigation of variable response rates to cancer immunotherapies has exposed the immunosuppressive tumor microenvironment (TME) as a limiting factor of therapeutic efficacy. A determinant of TME composition is the tumor location, and clinical data have revealed associations between certain metastatic sites and reduced responses. Preclinical models to study tissue-specific TMEs have eliminated genetic heterogeneity, but have investigated models with limited clinical relevance.

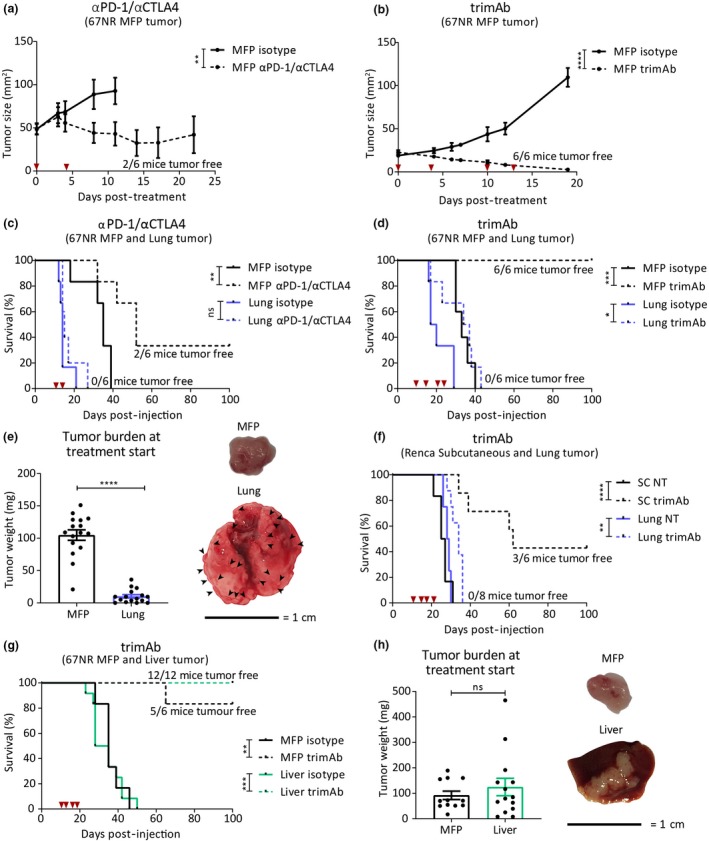
Methods: We investigated the TMEs of tumors at clinically relevant sites of metastasis (liver and lungs) and their impact on αPD-1/αCTLA4 and trimAb (αDR5, α4-1BB, αCD40) therapy responses in the 67NR mouse breast cancer and Renca mouse kidney cancer models.

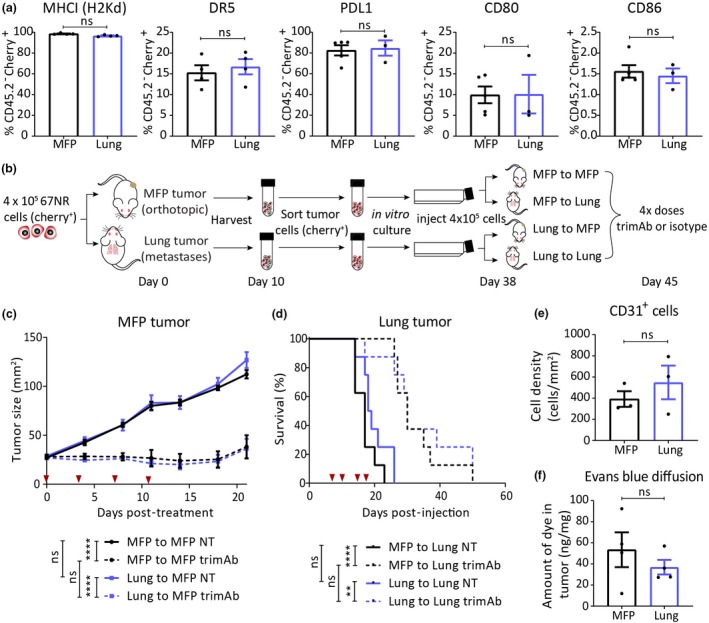
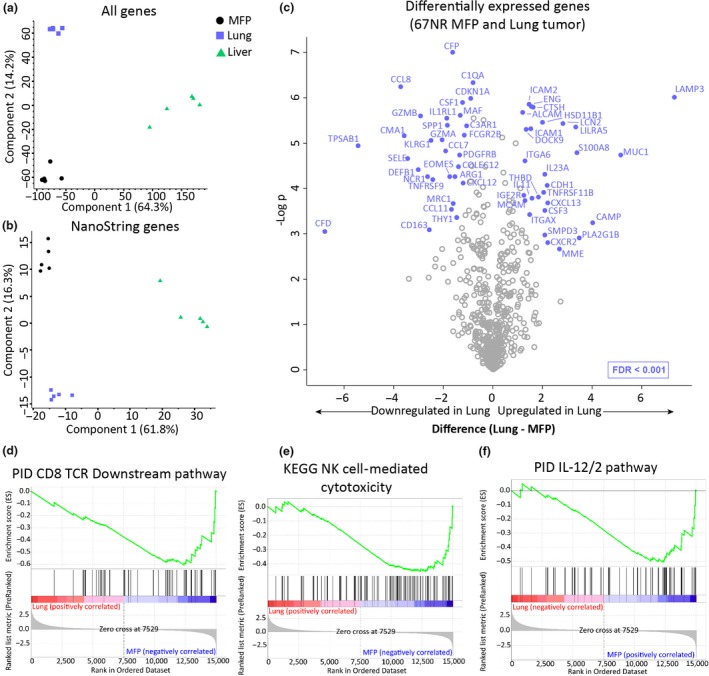
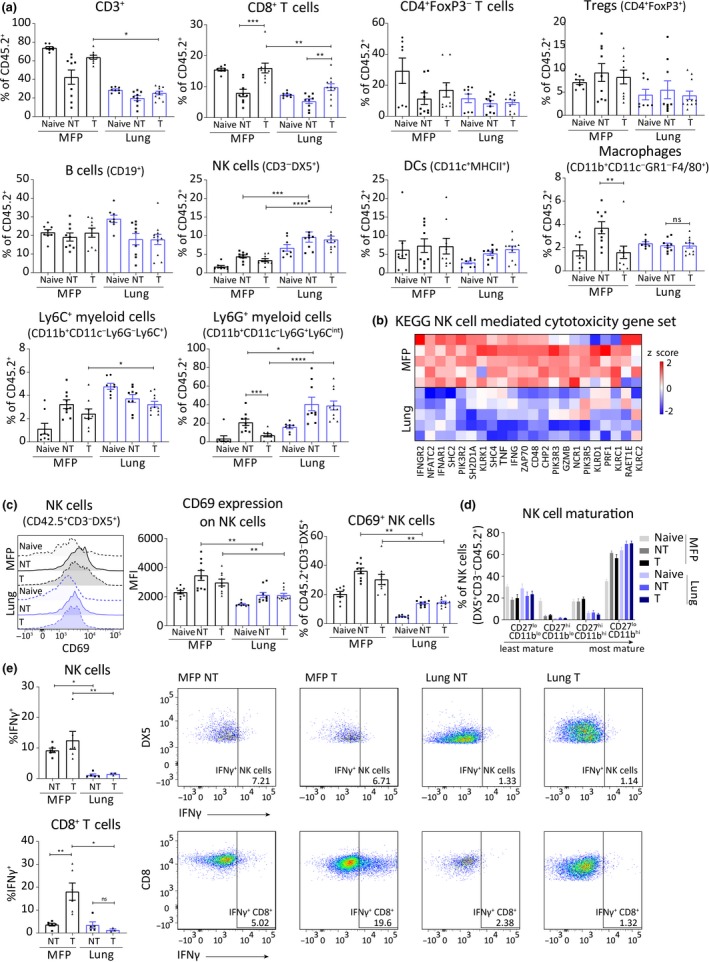
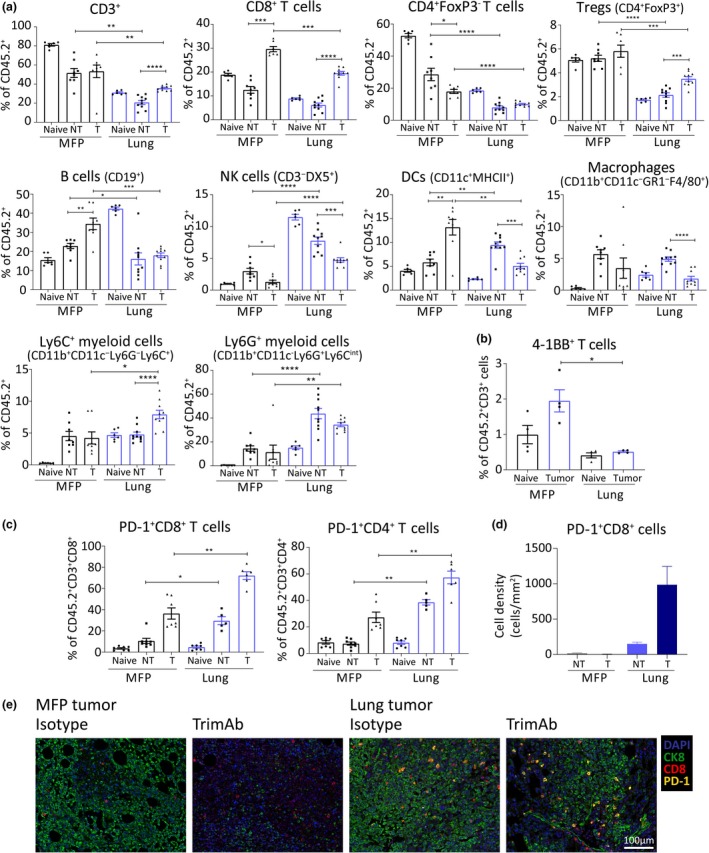
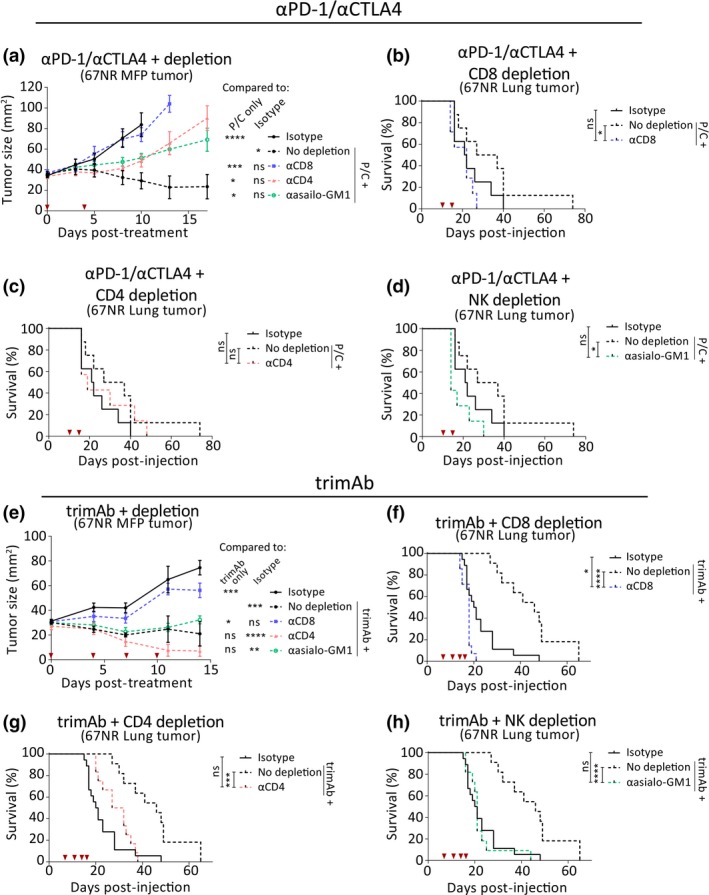
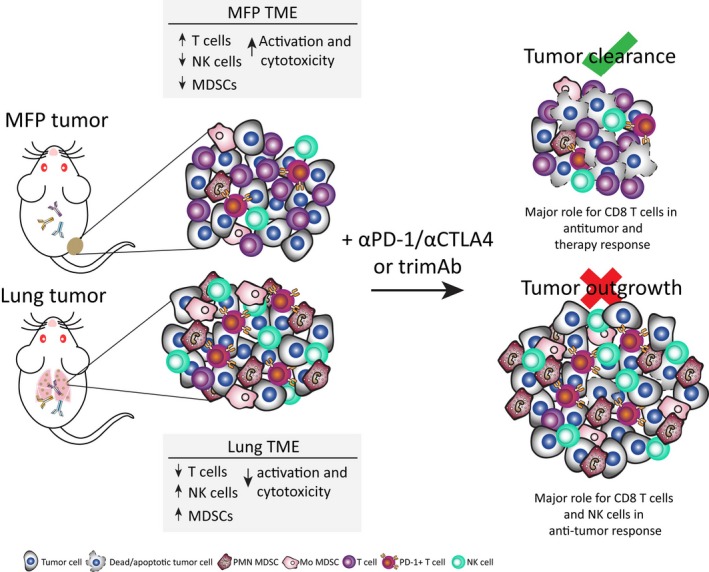
Results: Tumors grown in the lungs were resistant to both therapies whereas the same tumor lines growing in the mammary fat pad (MFP), liver or subcutaneously could be completely eradicated, despite greater tumor burden. Assessment of tumor cells and drug delivery in 67NR lung or MFP tumors revealed no differences and prompted investigation into the immune TME. Lung tumors had a more immunosuppressive TME with increased myeloid-derived suppressor cell infiltration, decreased T cell infiltration and activation, and decreased NK cell activation. Depletion of various immune cell subsets indicated an equivalent role for NK cells and CD8+ T cells in lung tumour control. Thus, targeting T cells with αPD-1/αCTLA4 or trimAb was not sufficient to elicit a robust antitumor response in lung tumors.

Conclusion: Taken together, these data demonstrate that tissue-specific TMEs influence immunotherapy responses and highlight the importance in defining tissue-specific response patterns in patients.

Keywords: anti‐CTLA‐4; anti‐PD‐1; tissue‐specific microenvironment; trimAb; tumor microenvironment.


Conflict of interest statement

The authors declare no conflict of interest.

Figures

Figure 1
Figure 1
Tumors growing in the lungs have reduced response to trimAb and αPD‐1/αCTLA4 immunotherapies. BALB/c mice were injected with 4 × 105 67NR breast tumor cells in either the mammary fat pad (MFP), intravenously (IV) to produce lung micrometastases (referred to as lung) or intra‐hepatic (referred to as liver). Ten days after tumor inoculation, mice were treated with two doses of αPD‐1/αCTLA4 (200 μg/150 μg) (a and c) or four doses of trimAb (50 μg αDR5, 25 μg αCD40 and 25 μg α41BB) (b and d), or an isotype control antibody (2A3, 200 μg). Timing of dosing is indicated with red arrows. (a, b) Growth of MFP tumors treated as indicated (n = 6 mice/group, representative data of two independent experiments). Two‐way ANOVA. (c, d) Survival of MFP and lung tumor‐bearing mice treated as indicated (n = 6 mice/group, representative data of two independent experiments). Survival was determined by tumor size reaching 150 mm2 (MFP tumor‐bearing mice) or respiratory distress (lung tumor‐bearing mice). Mantel–Cox test. (e) Weight of tumors dissected from MFP or lung on day 10 post‐injection (data pooled from 3 independent experiments n = 16 mice/group) and representative images of tumors. Black arrows indicate lung tumor micrometastases. Data points from lung tumor weight represent the total tumor burden in the lung. Unpaired t‐test. (f) Survival curves for BALB/c mice injected with 5 × 105 Renca kidney tumor cells either SC or IV to produce lung tumors. When subcutaneous tumors reached ~30 mm2 in size, mice were treated with trimAb therapy as indicated (n = 6–8 mice/group). Mantel–Cox test. (g) Survival of mice with MFP and liver tumors. Survival was determined by tumor size approaching 150 mm2 (MFP mice) or bloating and signs of distress (liver mice). Mantel–Cox test. (h) Weight of tumors dissected from MFP or liver on day 10 post‐injection and representative images (data pooled from 2 independent experiments, n = 12–14). Unpaired t‐test. All data represent mean ± SEM. ns P ≥ 0.05; *P < 0.05; **P ≤ 0.01; ***P ≤ 0.001; ****P ≤ 0.0001.
Figure 2
Figure 2
Tumor cells, vasculature or drug diffusion into mammary fat pad (MFP) or lung tumors are not influenced by anatomical site. (a) 67NR tumor cells (CD45.2Cherry+) extracted ex vivo from either MFP or lung tumors were analysed by flow cytometry for proteins indicated 10 days after tumor inoculation (n = 3–5). Mann–Whitney U‐test. (b) Experimental design for (c, d) 67NR tumor cells from MFP or lung tumors were isolated, cultured, reinjected back into the same (MFP to MFP, lung to lung) or opposite (MFP to lung, lung to MFP) anatomical sites, and established tumors were treated with four doses of trimAb 10 days after reinjection. Doses indicated by red arrows. (c) MFP tumor growth (n = 8 mice/group). Two‐way ANOVA. (d) Survival of mice bearing lung tumors (n = 8 mice/group). Mantel–Cox test. (e) Quantification from immunohistochemistry staining of CD31 or isotype control on FFPE sections from 67NR MFP and lung tumors harvested 10 days after tumor inoculation (n = whole section from 3 tumors/group, representative of the whole tumor). Mann–Whitney U‐test. (f) Evans blue diffusion into mice bearing 67NR MFP or lung tumors that were injected with Evans blue dye 30 min prior to tumor harvest and dye extraction from whole tumor (n = 4 tumors/group). Mann–Whitney U‐test. (e, f) Experiments were performed once. All data represent mean ± SEM. ns P ≥ 0.05; **P ˂ 0.01; ****P ≤ 0.0001.
Figure 3
Figure 3
RNA profile of mammary fat pad (MFP) and lung tumors reveals distinct immune‐related differences. RNA was extracted from tumors harvested from BALB/c mice injected with 4 × 105 67NR cells in the MFP, IV (lung mice) or liver, 14 days after injection. (a, b) PCA plot showing separation of samples based on all genes (a) or immune‐related genes (NanoString immune panel gene list) (b) from bulk 3’ RNA sequencing of MFP, lung and liver tumors. (c) Volcano plot displaying significantly differentially expressed immune‐related genes between MFP and lung tumors. (d–f) GSEA plot for all differentially expressed genes in MFP and lung tumors showing enrichment for genes involved in PID CD8 TCR downstream pathway (d), KEGG NK cell‐mediated cytotoxicity (e) and PID IL‐12/2 pathway (f). n = 5 tumors/group.
Figure 4
Figure 4
Mammary fat pad (MFP) and lung tumors have distinct TMEs that are altered differentially by αPD‐1/αCTLA4 treatment. BALB/c mice bearing MFP or lung tumors (4 × 105 67NR cells in MFP or IV) were treated with αPD‐1/αCTLA4 and harvested 7 days post‐treatment initiation. (a) Flow cytometry of immune cell populations indicated as a percentage of live CD45.2+ cells within MFP or lung tumors treated with isotype antibody (NT) or αPD‐1/αCTLA4 (T), or organs without tumor (naïve). Pooled data from 2 independent experiments, n = 8–11/group. Mann–Whitney U‐test. (b) Heatmap of gene expression in MFP and lung tumors of genes in KEGG NK cell‐mediated cytotoxicity pathway. RNA was extracted from tumors harvested from BALB/c mice injected with 4 × 105 67NR cells in the MFP or IV (lung mice), 14 days after injection. n = 5 tumors/group. (c) Expression of CD69 on live CD45.2+CD3DX5+ cells by flow cytometry. Mann–Whitney U‐test. (d) Maturation of NK cells (live CD45.2+CD3DX5+) assessed by expression of CD11b and CD27 by flow cytometry. (e) Expression of IFNγ by NK cells and CD8+ T cells stimulated ex vivo by flow cytometry. ns P ≥ 0.05 *P < p0.05; **P ≤ 0.01; ***P ≤ 0.001; ****P ≤ 0.0001.
Figure 5
Figure 5
Mammary fat pad (MFP) and lung tumors have distinct TMEs that are altered differentially by trimAb treatment. BALB/c mice bearing MFP or lung tumors (4 × 105 67NR cells in MFP or IV) were treated with trimAb and harvested 7 days post‐treatment initiation. (a) Flow cytometry of immune cell populations indicated as a percentage of live CD45.2+ cells within MFP or lung tumors treated with 2A3 isotype antibody (NT) or trimAb (T), or organs without tumor (naïve). Data are representative from 1 of 3 independent experiments, n = 5‐10/group. Mann–Whitney U‐test. (b) Expression of 4‐1BB on live CD45.2+CD3+ cells by flow cytometry. Mann–Whitney U‐test. (c) Expression of PD‐1 on live CD45.2+CD3+, CD8+ or CD4+ cells by flow cytometry. Mann–Whitney U‐test. (d, e) Representative images and quantitation of multiplexing IHC showing PD‐1‐positive CD8+ cells in MFP and lung tumors, n = 2 or 3 whole tumor section/group. CK8, cytokeratin 8. *P < p0.05; **P ≤ 0.01; ***P ≤ 0.001; ****P ≤ 0.0001.
Figure 6
Figure 6
Mammary fat pad (MFP) and lung tumors depend on different immune subsets for therapy response and tumor control. BALB/c mice bearing MFP or lung tumors (4 × 105 67NR cells in MFP or IV) were treated with αPD‐1/αCTLA4 or trimAb alone or with depleting antibodies against CD8, CD4 or asialo‐GM1 (NK cell depletion). (a) Growth of MFP tumors either non‐treated (isotype), treated with αPD‐1/αCTLA4 only (no depletion) or αPD‐1/αCTLA4 and depletion antibodies. Two‐way ANOVA. Data points represent mean ± SEM. n = 6–8 mice/group. (b–d) Survival of all lung tumor‐bearing mice either non‐treated (isotype), treated with αPD‐1/αCTLA4 only (no depletion) or αPD‐1/αCTLA4 and depletion antibodies against CD8 (b), CD4 (c) or asialo‐GM1 (d). n = 6–8 mice/group. Mantel–Cox test. (e) Growth of MFP tumors either non‐treated (isotype), treated with trimAb only (no depletion) or trimAb and depletion antibodies. Two‐way ANOVA. Data points represent mean ± SEM. n = 5 or 6 mice/group, representative of 2 independent experiments. (f–h) Survival of all lung tumor‐bearing mice either non‐treated (isotype), treated with trimAb only (no depletion) or trimAb and depletion antibodies against CD8 (f), CD4 (g) or asialo‐GM1 (h) n = 8–11 mice/group, pooled data from 2 independent experiments. Mantel–Cox test. ns P ≥ 0.05; **P ≤ 0.01; ***P ≤ 0.001; ****P ≤ 0.0001.
Figure 7
Figure 7
Mammary fat pad (MFP) and lung tumors have distinct TMEs and differential responses to trimAb and αPD‐1/αCTLA4 immunotherapies. Summary schematic of results from the current study of BALB/c mice with established 67NR tumors growing in either the MFP or the lungs. Tumors had distinct TMEs with increased T cells, decreased NK cells and MDSCs and increased activation of T cells and NK cells in MFP tumors compared with lung tumors. Furthermore, depletion of various immune cell subsets revealed a greater role for NK cells in the antitumor immune response in tumors growing in the lungs compared with the MFP. Therefore, upon treatment with trimAb or αPD‐1/αCTLA4 immunotherapies, which primarily target T‐cell antitumor immune responses, MFP tumors were responsive and could be eradicated whereas lung tumors were resistant to therapy and outgrew.

References

    1. Sharma P, Hu‐Lieskovan S, Wargo JA, Ribas A. Primary, adaptive, and acquired resistance to cancer immunotherapy. Cell 2017; 168: 707–723. - PMC - PubMed
    1. Pitt JM, Vetizou M, Daillere R et al Resistance mechanisms to immune‐checkpoint blockade in cancer: tumor‐intrinsic and ‐extrinsic factors. Immunity 2016; 44: 1255–1269. - PubMed
    1. Hanahan D, Coussens LM. Accessories to the crime: functions of cells recruited to the tumor microenvironment. Cancer Cell 2012; 21: 309–322. - PubMed
    1. Binnewies M, Roberts EW, Kersten K et al Understanding the tumor immune microenvironment (TIME) for effective therapy. Nat Med 2018; 24: 541–550. - PMC - PubMed
    1. Shou J, Zhang Z, Lai Y, Chen Z, Huang J. Worse outcome in breast cancer with higher tumor‐infiltrating FOXP3+ Tregs : a systematic review and meta‐analysis. BMC Cancer 2016; 16: 687. - PMC - PubMed

LinkOut - more resources