. 2019 Sep 23;4(5):567-574.
doi: 10.1016/j.jacbts.2019.05.012. eCollection 2019 Sep.

Comparative Transcriptomics of Ex Vivo, Patient-Derived Endothelial Cells Reveals Novel Pathways Associated With Type 2 Diabetes Mellitus

Affiliations

Comparative Transcriptomics of Ex Vivo, Patient-Derived Endothelial Cells Reveals Novel Pathways Associated With Type 2 Diabetes Mellitus

Joshua A Beckman et al. JACC Basic Transl Sci. .

Abstract

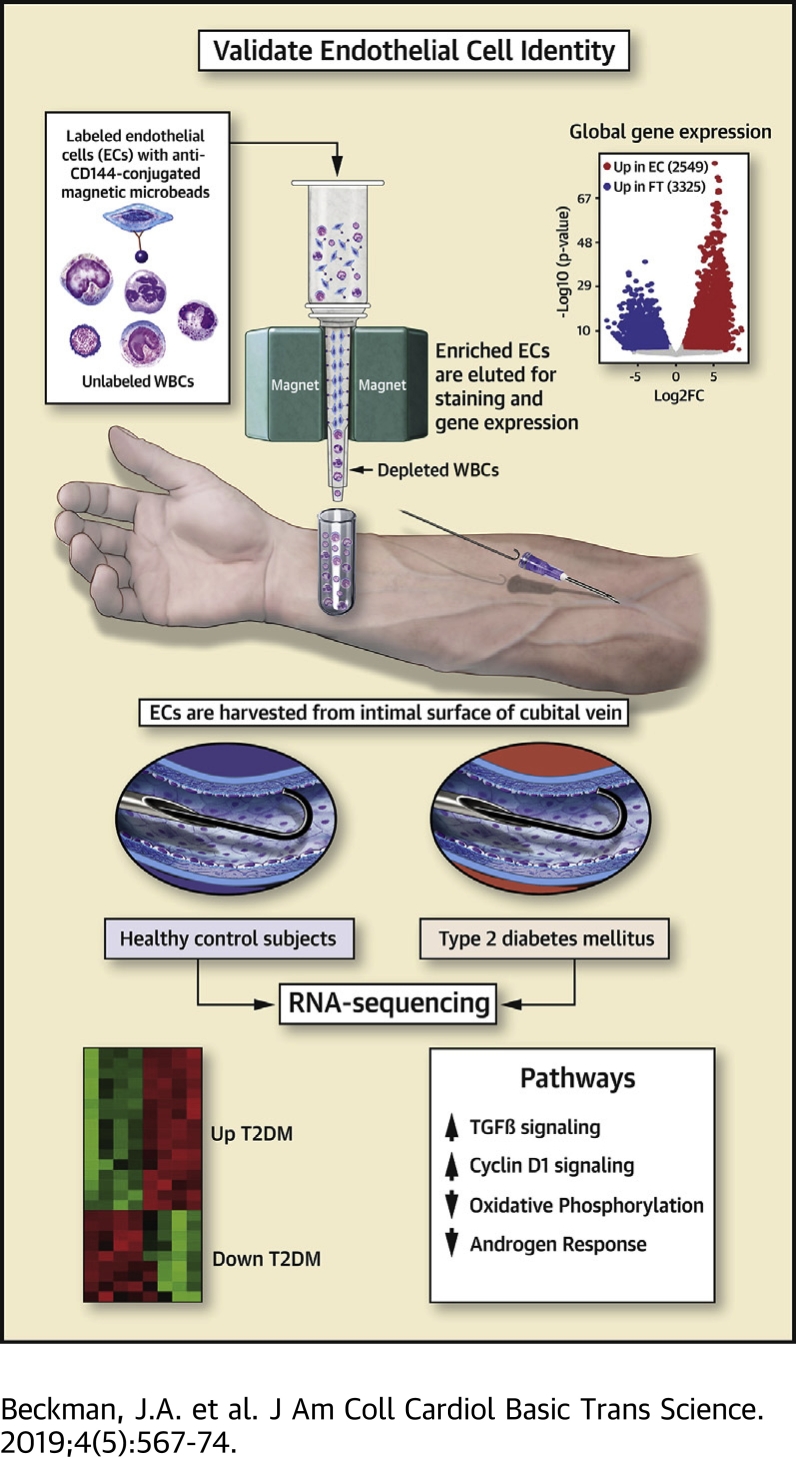
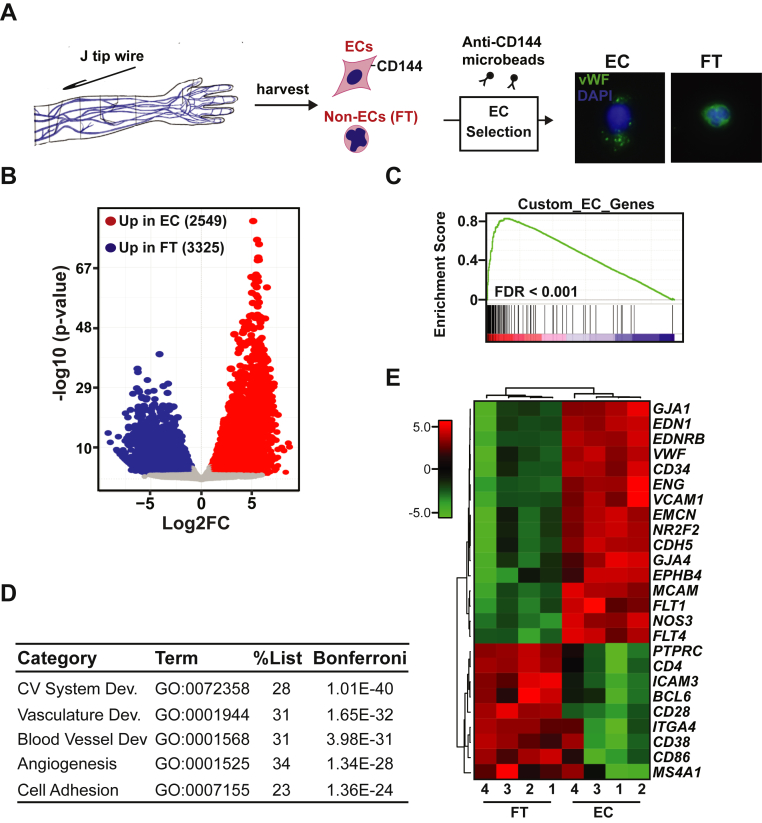
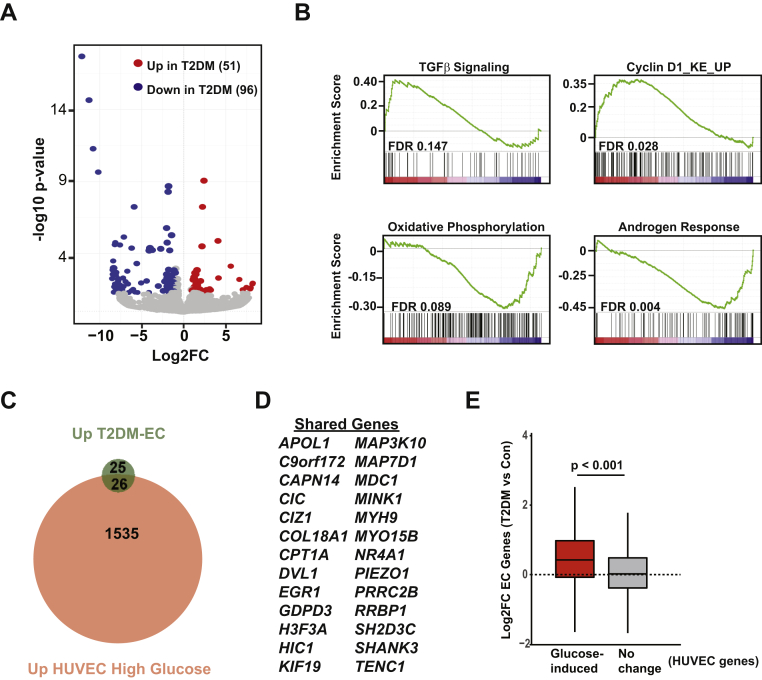
In this study low-input RNA-sequencing was used to annotate the molecular identity of endothelial cells isolated and immunopurified with CD144 microbeads. Using this technique, comparative gene expression profiling from healthy subjects and patients with type 2 diabetes mellitus identified both known and novel pathways linked with EC dysfunction. Modeling of diabetes by treating cultured ECs with high glucose identified shared changes in gene expression in diabetic cells. Overall, the data demonstrate how purified ECs from patients can be used to generate new hypotheses about mechanisms of human vascular disease.

Keywords: BSA, bovine serum albumin; EC, endothelial cell; EDTA, ethylenediamine tetra-acetic acid; FACS, fluorescence activated cell sorting; FDR, false discovery rate; GSEA, gene set enrichment analysis; HUVEC, human umbilical vein endothelial cell; IV, intravenous; PBS, phosphate buffered saline; Seq, sequencing; T2DM, type 2 diabetes mellitus; TGFβ, transforming growth factor beta; VEGF, vascular endothelial growth factor; VUMC, Vanderbilt University Medical Center; WBC, white blood cell; ddCt, delta-delta cycle threshold; diabetes mellitus; endothelial cell dysfunction; endothelial cells; gene expression; qPCR, quantitative polymerase chain reaction.


Figures

None
Graphical abstract
Figure 1
Figure 1
Ex Vivo CD144-Selection Enriches Vascular ECs in Patient-Derived Samples (A) Schematic of endothelial cell (EC) isolation procedure, selection of ECs using anti-CD144 magnetic microbeads and photomicrographs of immunofluorescence for von Willebrand factor (VWF) (green) in CD144 selected ECs and flow through cells (FT = nonselected). Nuclei were counterstained with DAPI (blue). Results shown at 40x magnification. (B) Volcano plot showing Log2 fold change (Log2FC) expression vs. log10 (p value) of differentially expressed genes in CD144-selected cells vs. FT. For significance cutoff, false discovery rate (FDR) adjusted p value <0.05 and 2-fold change was used. (C) Gene set enrichment plot showing positive enrichment of genes expressed in CD144-selected cells in a curated EC gene set. (D) Table showing results of gene ontology analysis (ToppGene suite) of differentially expressed genes from CD144-selected cells vs. FT cells. Bonferroni adjusted p value is shown. All statistically significantly upregulated genes in CD144 selected cells vs. FT cells from Figure 1B were included in the analysis using a cutoff of 2-fold; FDR <0.05. GO: Biological Processes are listed. (E) Heat map showing expression data of specific EC-restricted and leukocyte-restricted marker genes in EC and FT samples. Samples were clustered using Pearson correlation. For each EC and FT patient-derived sample, pairwise analysis was performed. Numbers below the heat map indicate paired samples.
Figure 2
Figure 2
Comparative Transcriptomics Identifies Changes in Pathways of Proliferation, Metabolism, and Androgen Signaling in ECs From Patients With T2DM (A) Volcano plot showing Log2 fold change (Log2FC) in expression of protein coding genes vs. log10 (p value) in T2DM (endothelial cells) ECs compared with EC-Con (Same RNA-seq data from Figure 1). False discovery rate (FDR adjusted p value cutoff <0.05. (B) Gene set enrichment plots in T2DM ECs vs. EC-Con. Genes were ranked using the “stat” parameter generated in the DESeq2 pipeline. For each plot, FDR is included. (C) Venn diagram showing overlap in genes induced in T2DM-ECs (green) and HUVEC treated with 25 mM glucose for 24 h (red). (D) List of shared genes from panel C. (E) Boxplot showing median Log2FC (T2DM ECs vs. EC-Con) of all HUVEC genes induced by high glucose (2-fold, FDR <0.05) or HUVEC genes that did not change with glucose stimulation. For E, p value was determined by Wilcoxon rank sum test.

References

    1. Gimbrone M.A., Jr., Garcia-Cardena G. Endothelial cell dysfunction and the pathobiology of atherosclerosis. Circ Res. 2016;118:620–636. - PMC - PubMed
    1. Nagel T., Resnick N., Dewey C.F., Jr., Gimbrone M.A., Jr. Vascular endothelial cells respond to spatial gradients in fluid shear stress by enhanced activation of transcription factors. Arterioscler Thromb Vasc Biol. 1999;19:1825–1834. - PubMed
    1. Colombo P.C., Ashton A.W., Celaj S. Biopsy coupled to quantitative immunofluorescence: a new method to study the human vascular endothelium. J Appl Physiol. 2002;92:1331–1338. - PubMed
    1. Donato A.J., Eskurza I., Silver A.E. Direct evidence of endothelial oxidative stress with aging in humans: relation to impaired endothelium-dependent dilation and upregulation of nuclear factor-kappaB. Circ Res. 2007;100:1659–1666. - PubMed
    1. Tabit C.E., Shenouda S.M., Holbrook M. Protein kinase C-beta contributes to impaired endothelial insulin signaling in humans with diabetes mellitus. Circulation. 2013;127:86–95. - PMC - PubMed