

Histone H2A phosphorylation recruits topoisomerase IIα to centromeres to safeguard genomic stability
- PMID: 31769059
- PMCID: PMC6996575
- DOI: 10.15252/embj.2019101863
Histone H2A phosphorylation recruits topoisomerase IIα to centromeres to safeguard genomic stability
Abstract
Chromosome segregation in mitosis requires the removal of catenation between sister chromatids. Timely decatenation of sister DNAs at mitotic centromeres by topoisomerase IIα (TOP2A) is crucial to maintain genomic stability. The chromatin factors that recruit TOP2A to centromeres during mitosis remain unknown. Here, we show that histone H2A Thr-120 phosphorylation (H2ApT120), a modification generated by the mitotic kinase Bub1, is necessary and sufficient for the centromeric localization of TOP2A. Phosphorylation at residue-120 enhances histone H2A binding to TOP2A in vitro. The C-gate and the extreme C-terminal region are important for H2ApT120-dependent localization of TOP2A at centromeres. Preventing H2ApT120-mediated accumulation of TOP2A at mitotic centromeres interferes with sister chromatid disjunction, as evidenced by increased frequency of anaphase ultra-fine bridges (UFBs) that contain catenated DNA. Tethering TOP2A to centromeres bypasses the requirement for H2ApT120 in suppressing anaphase UFBs. These results demonstrate that H2ApT120 acts as a landmark that recruits TOP2A to mitotic centromeres to decatenate sister DNAs. Our study reveals a fundamental role for histone phosphorylation in resolving centromere DNA entanglements and safeguarding genomic stability during mitosis.
Keywords: Bub1; DNA decatenation; Sgo1; TOP2A; histone H2A phosphorylation.
© 2019 The Authors.
Conflict of interest statement
The authors declare that they have no conflict of interest.
Figures

- A–E
U2OS cells were transfected with siRNA, and subjected to immunofluorescence staining with DAPI, anti‐human centromere autoantibody (ACA), and antibodies for Bub1 and TOP2A. Example images are shown (A). The immunofluorescence intensity ratios of centromeric TOP2A/ACA (B), centromeric TOP2A/arm TOP2A (C), and arm TOP2A/DNA (D) were determined on around 600 (B and C) or 400 (D) chromosomes in 20 cells. Lysates of nocodazole‐arrested mitotic cells were immunoblotted with the indicated antibodies (E). ns, no statistical significance.
- F, G
U2OS cells were transfected with siRNA, and subjected to immunofluorescence staining. Example images are shown (F). The immunofluorescence intensity ratio of centromeric TOP2A/arm TOP2A was determined on around 500 chromosomes in 15 cells (G).
- H–K
U2OS cells treated with STLC and MG132 for 0.5 h were subjected to further treatment with reversine, AZ3146, or dimethyl sulfoxide (DMSO, vehicle control) for 1 h in the continued presence of STLC and MG132. Example images of the immunofluorescence staining are shown (H). The immunofluorescence intensity ratios of centromeric Bub1/ACA (I), centromeric TOP2A/ACA (J), and centromeric TOP2A/arm TOP2A (K) were determined on around 300 chromosomes in 15 cells.
- L
U2OS cells stably expressing CB‐GFP or CB‐Bub1‐K‐GFP were treated as in (H). Example images of the immunofluorescence staining are shown.

- A–C
U2OS cells were transfected with siRNA and subjected to immunofluorescence staining with DAPI, ACA, and antibodies for Bub1 and TOP2A. Example images are shown (A). The immunofluorescence intensity ratio of centromeric TOP2A/arm TOP2A was determined on around 500 chromosomes in 15 cells (B). Lysates of nocodazole‐arrested mitotic cells were immunoblotted with the indicated antibodies (C).
- D, E
U2OS cells were transfected and immunostained as in (A). Example images are shown (D). The immunofluorescence intensity ratio of centromeric TOP2A/arm TOP2A was determined on around 300 chromosomes in 10 cells (E).
- F
Schematic description of the domain and motif organization of human Bub1.
- G, H
U2OS cells were transfected with siRNA and subjected to immunofluorescence staining with DAPI, ACA, and antibodies for Bub1 and H2ApT120 (G) or TOP2A (H). Example images of prophase cells are shown.

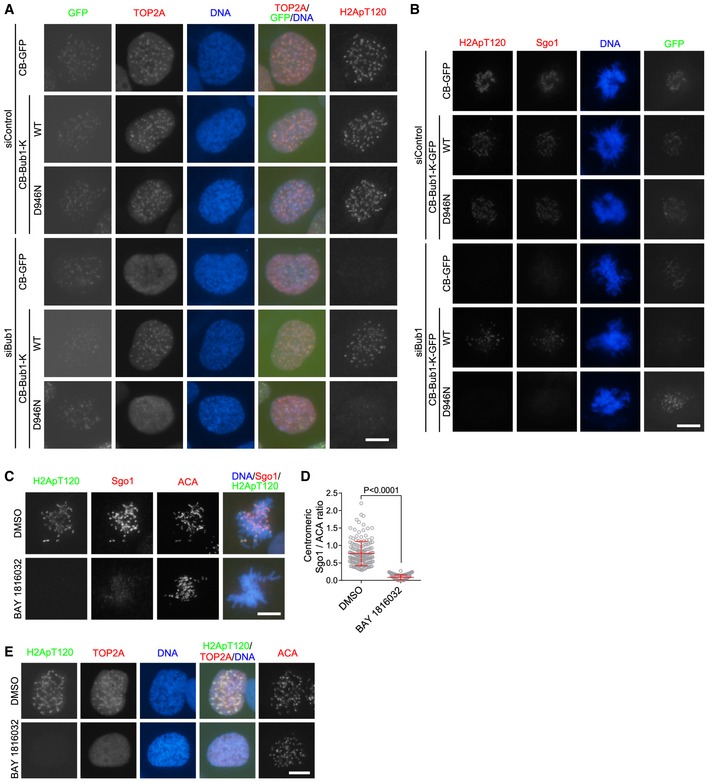
- A, B
U2OS cells stably expressing CB‐GFP, CB‐Bub1‐K‐GFP, or CB‐Bub1‐K‐D946N‐GFP were transfected with siRNA, and subjected to immunofluorescence staining with DAPI and the antibodies for H2ApT120 and TOP2A (A). Lysates of nocodazole‐arrested mitotic cells were immunoblotted (B). * represents non‐specific bands.
- C–F
U2OS cells were treated with DMSO or BAY 1816032 at the indicated concentrations for 1 h, and subjected to immunofluorescence staining. Example images are shown (C). The immunofluorescence intensity ratios of centromeric H2ApT120/ACA (D), centromeric TOP2A/ACA (E), and centromeric TOP2A/arm TOP2A (F) were determined on around 450 chromosomes in 15 cells. Means and error bars representing SD are shown (D–F; unpaired t‐test).
- A
U2OS cells stably expressing CB‐GFP, CB‐Bub1‐K‐GFP, or CB‐Bub1‐K‐D946N‐GFP were transfected with siRNA, and subjected to immunofluorescence staining with DAPI and the antibodies for H2ApT120 and TOP2A. Example images of prophase cells are shown.
- B
U2OS cells stably expressing CB‐GFP, CB‐Bub1‐K‐GFP, or CB‐Bub1‐K‐D946N‐GFP were transfected with siRNA, and subjected to immunofluorescence staining with DAPI and the antibodies for H2ApT120 and Sgo1.
- C, D
U2OS cells were treated with DMSO or 4 μM BAY 1816032 for 1 h, and subjected to immunofluorescence staining. Example images are shown (C). The immunofluorescence intensity ratio of centromeric Sgo1/ACA was determined on around 150 chromosomes in 15 cells (D). Means and error bars representing SD are shown (unpaired t‐test).
- E
U2OS cells were treated with DMSO or 4 μM BAY 1816032 for 1 h, and subjected to immunofluorescence staining. Example images of prophase cells are shown.

- A–D
U2OS cells were transfected with siRNA, and subjected to immunofluorescence staining with DAPI, ACA, and antibodies to TOP2A (A) or Cdc20 (B). Example images of prometaphase cells are shown. Lysates of nocodazole‐arrested mitotic cells were immunoblotted with antibodies for GAPDH and Cdc20 (C) or TRF1 (D).
- E
U2OS cells stably expressing CB‐GFP, CB‐Bub1‐K‐GFP, or CB‐Bub1‐K‐D946N‐GFP were subjected to immunofluorescence staining. Example images of anaphase cells are shown.
- F, G
U2OS cells stably expressing CB‐GFP, CB‐Bub1‐K‐GFP, or CB‐Bub1‐K‐D946N‐GFP were subjected to immunofluorescence staining with DAPI, and antibodies for TOP2A and H2ApT120 (F) or INCENP (G). Example images of late‐telophase/early‐G1 cells, as indicated by INCENP staining at the mid‐body, are shown.
- H
A 200‐copy transgene array was integrated into a euchromatic region of chromosome 1p36 in human U2OS cells. The plasmid is composed of 256 copies of the Lac Operator, 96 tetracycline response elements (TRE), a minimal CMV promoter, and the cyan fluorescent protein gene. Expression of EGFP‐LacI fusion proteins allows the DNA to be visualized.
- I
U2OS‐LacO cells transiently expressing EGFP‐LacI or EGFP‐LacI‐Bub1‐K (WT or D946N) were subjected to immunofluorescence staining with DAPI and antibodies for H2ApT120 and Sgo1. Arrows point to the transgene loci.

- A
U2OS cells were subjected to immunofluorescence staining. Example images of mitotic cells at various stages are shown.
- B
U2OS cells stably expressing CB‐GFP, CB‐Bub1‐K‐GFP, or CB‐Bub1‐K‐D946N‐GFP were subjected to immunofluorescence staining. Example images of anaphase cells are shown.
- C
U2OS cells stably expressing CB‐GFP, CB‐Bub1‐K‐GFP, or CB‐Bub1‐K‐D946N‐GFP were subjected to immunofluorescence staining with DAPI, and antibodies for TOP2A and H2ApT120 or H3pS10. Example images of interphase cells are shown. The cells in the top line, which is H3pS10‐positive, are in early prophase/late G2.
- D
U2OS‐LacO cells transiently expressing EGFP‐LacI and EGFP‐LacI‐Bub1‐K (WT or D946N) were subjected to immunofluorescence staining. Arrows point to the transgene loci.
- E, F
MBP‐TOP2A (429–1,531)‐10xHis was subjected to pulldown assay by GST, GST‐H2A, or GST‐H2ApS120, followed by immunoblotting with antibodies for MBP, GST, or H2ApT120 (E). The relative pulldown efficiency was determined (F). Means and error bars representing SD from three independent experiments are shown (unpaired t‐test).

- A, B
HeLa cells and the Sgo1‐K492A mutant cells were immunostained with the indicated antibodies. Example images are shown (A). The immunofluorescence intensity ratio of centromeric INCENP/ACA was determined on around 250 chromosomes in 10 cells (B).
- C, D
HeLa and the Sgo1‐K492A cells were exposed to nocodazole for 4 h. Mitotic cells were cytospun onto coverslips and fixed for immunostaining. Example images are shown (C). The immunofluorescence intensity ratio of centromeric TOP2A/arm TOP2A was determined on around 150 chromosomes in 10 cells (D).
- E, F
HeLa and the Sgo1‐K492A cells were transfected with siRNA, and immunostained with the indicated antibodies. Example images are shown (E). The immunofluorescence intensity ratio of centromeric Aurora B/ACA was determined on around 250 chromosomes in 10 cells (F).
- G, H
HeLa and the Sgo1‐K492A cells were transfected with siRNA, and treated with nocodazole for 5 h. Mitotic cells were cytospun onto coverslips and fixed for immunostaining. Example images are shown (G). The immunofluorescence intensity ratio of centromeric TOP2A/arm TOP2A was determined on around 280 chromosomes in 10 cells (H).

- A
Schematic description of the domain organization of human TOP2A.
- B
HeLa cells were transfected with siRNA and the plasmids encoding the indicated proteins, and then exposed to nocodazole for 5 h. Mitotic cells were cytospun onto coverslips and subjected to immunofluorescence staining with DAPI, ACA, and anti‐GFP antibodies. Example images are shown.
- C–F
HeLa cells were transfected and treated as in (B). Example images are shown (C). The immunofluorescence intensity ratios of centromeric EGFP‐TOP2A/ACA (D), centromeric EGFP‐TOP2A/arm EGFP‐TOP2A (E), and arm EGFP‐TOP2A/DNA (F) were determined on around 160 chromosomes in 8 cells.
- G, H
HeLa cells transiently expressing EGFP‐TOP2A (970–1,531) or EGFP‐TOP2A (970–1,531)‐Δ(1,015–1,032) were treated and immunostained as in (B). Example images are shown (G). The immunofluorescence intensity ratio of centromeric EGFP‐TOP2A/arm EGFP‐TOP2A was determined on around 250 chromosomes in 10 cells (H).
- I–K
U2OS‐LacO cells transiently expressing Myc‐LacI‐Bub1 and EGFP‐TOP2A (970–1,531) were subjected to immunofluorescence staining with DAPI and antibodies for the Myc‐tag and GFP. Example images are shown (I). The relative enrichment of EGFP‐TOP2A at the LacO repeats was quantified in 130 cells (J). Cell lysates were immunoblotted (K).

- A, B
HeLa cells transiently expressing EGFP‐TOP2A were exposed to nocodazole for 5 h. Mitotic cells were cytospun onto coverslips and subjected to immunofluorescence staining with DAPI, ACA, and anti‐GFP antibodies. Example images are shown (A). Lysates of asynchronous cells were immunoblotted (B).
- C
HeLa cells were transfected with siRNA and the plasmids encoding EGFP‐TOP2A (WT or CTD), and then treated and immunostained as in (A). Example images are shown.
- D–F
HeLa cells were transfected with siRNA and the plasmids encoding EGFP‐TOP2A (WT or Δ1212‐1446), and then treated and immunostained as in (A). Example images are shown (D). The immunofluorescence intensity ratios of centromeric EGFP‐TOP2A/ACA (E) and centromeric EGFP‐TOP2A/arm EGFP‐TOP2A (F) were determined on around 160 chromosomes in 8 cells.
- G–I
HeLa cells were transfected with siRNA and plasmids encoding EGFP‐TOP2A (WT or Δ1,015–1,032). Cells were either arrested in mitosis and immunostained as in (A), or were left untreated and fixed for immunostaining. Example images of mitotic (G) and interphase cells (H) are shown. Lysates of asynchronous cells were immunoblotted (I).
- J, K
HeLa cells were transfected with siRNA and plasmids encoding the indicated EGFP‐TOP2A proteins, and then treated and immunostained as in (A). Example images are shown (J). Lysates of asynchronous cells were immunoblotted (K).

- A
HeLa cells were transfected with siRNA and plasmids encoding the indicated proteins, and then exposed to nocodazole for 3 h. Mitotic cells were cytospun onto coverslips and subjected to immunofluorescence staining with DAPI, ACA, and anti‐GFP antibodies. Example images are shown.
- B–D
U2OS‐LacO cells transiently expressing Myc‐LacI‐Bub1 and the indicated EGFP‐TOP2A proteins were subjected to immunofluorescence staining with DAPI and antibodies for the Myc‐tag and H2ApT120. Example images are shown (B). The relative enrichment of EGFP signal at the LacO repeats was quantified in 30 cells (C). Cell lysates were immunoblotted (D). Arrows point to the transgene loci.
- E, F
HeLa cells transfected with siRNA and plasmids encoding the indicated proteins were treated and immunostained as in (A). Example images are shown (E). The immunofluorescence intensity ratio of centromeric EGFP‐TOP2A/arm EGFP‐TOP2A was determined on around 300 chromosomes in 15 cells (F).
- G, H
HeLa cells transfected with siRNA and plasmids encoding the indicated proteins were treated and immunostained as in (A). Example images are shown (G). The immunofluorescence intensity ratio of centromeric TOP2A‐Myc‐6xHis/arm TOP2A‐Myc‐6xHis was determined on around 200 chromosomes in 10 cells (H).
- I–K
U2OS cells stably expressing the indicated CENP‐B fusion proteins were transfected with the plasmid encoding TOP2A‐Myc‐6xHis or TOP2A‐ΔChT‐Myc‐6xHis, and then subjected to immunofluorescence staining with DAPI and antibodies for the Myc‐tag and H2ApT120. Example images are shown (I). The relative enrichment of anti‐Myc staining signal at the centromere region versus that in the nearby nuclear region was quantified on around 200 chromosomes in 10 cells (J). Cell lysates were immunoblotted (K).
- L
MBP‐TOP2A (429–1,531)‐10xHis and MBP‐TOP2A (429–1,531)‐ΔChT‐10xHis were subjected to pulldown assay by GST, GST‐H2A, or GST‐H2ApS120, followed by immunoblotting with antibodies for MBP or GST.
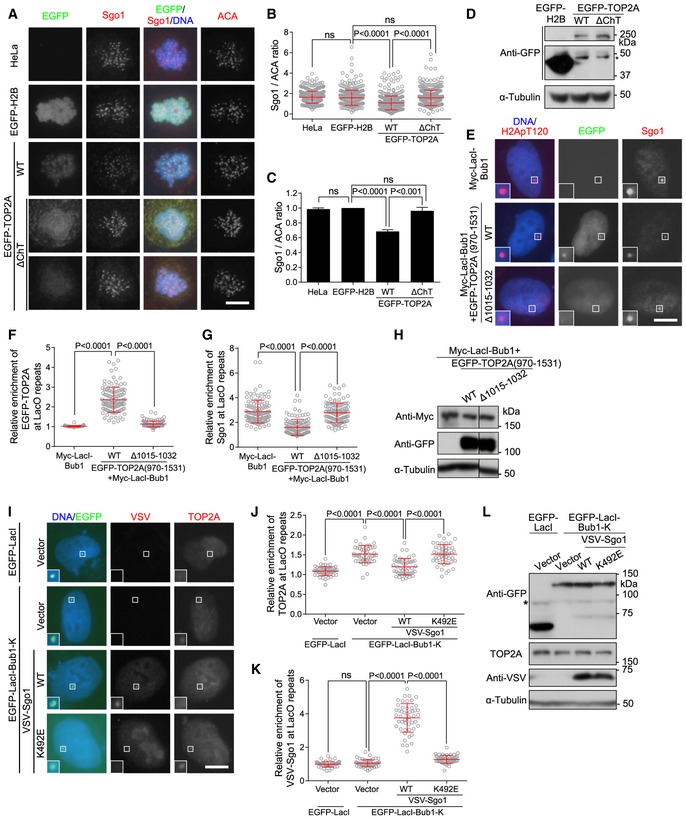
- A–D
HeLa cells with or without transient expression of H2B‐GFP or EGFP‐TOP2A were exposed to nocodazole for 3 h. Mitotic cells were cytospun onto coverslips and subjected to immunofluorescence staining with DAPI and antibodies for GFP, Sgo1, and ACA. Example images are shown (A). The immunofluorescence intensity ratio of centromeric Sgo1/ACA was determined on 400 chromosomes in 20 cells (B). The means and SDs from three independent experiments with the Sgo1/ACA ratio determined on around total 1,200 chromosomes in 60 cells are shown (C). Lysates of asynchronous cells were immunoblotted (D). * represents non‐specific bands.
- E–H
U2OS‐LacO cells transiently expressing Myc‐LacI‐Bub1, with or without EGFP‐TOP2A (970–1,531), were subjected to immunofluorescence staining with DAPI and antibodies for H2ApT120 and Sgo1. Example images are shown (E). The relative enrichment of EGFP‐TOP2A (F) and Sgo1 (G) at the LacO repeats was quantified in 120 cells. Cell lysates were immunoblotted (H).
- I–L
U2OS‐LacO cells transiently expressing EGFP‐LacI‐Bub1‐K together with VSV‐Sgo1 or a control vector were subjected to immunofluorescence staining with DAPI and antibodies for TOP2A and VSV‐tag. Example images are shown (I). The relative enrichment of TOP2A (J) and VSV‐Sgo1 (K) at the LacO repeats was quantified in 50 cells. Cell lysates were immunoblotted (L). * represents non‐specific bands.

- A–D
HeLa cells transiently expressing CB‐GFP or EGFP‐TOP2A (970–1,531) were exposed to nocodazole for 3 h. Mitotic cells were cytospun onto coverslips and subjected to immunofluorescence staining with DAPI and antibodies for GFP, Sgo1, and CENP‐C. Example images are shown (A). The immunofluorescence intensity ratio of centromeric Sgo1/CENP‐C was determined on around 250 chromosomes in 10 cells (B). The means and SDs on around total 800 chromosomes in 30 cells from three independent experiments with the Sgo1/CENP‐C ratio determined are shown (C). Lysates of asynchronous cells were immunoblotted (D). * represents non‐specific bands.
- E–H
U2OS‐LacO cells transiently expressing EGFP‐LacI or EGFP‐LacI‐Bub1‐K together with VSV‐Sgo1 or a control vector were subjected to immunofluorescence staining with DAPI and antibodies for TOP2A and the VSV‐tag. Example images are shown (E). The relative enrichment of TOP2A (F) and VSV‐Sgo1 (G) at the LacO repeats was quantified in 50 cells. Cell lysates were immunoblotted (H). * represents non‐specific bands.

- A–C
HeLa cells were transfected with siRNA and subjected to immunofluorescence staining with DAPI, ACA, and the anti‐PICH antibody. Example images of anaphase cells are shown (A). The percentage of PICH‐positive cells was determined in at least 339 anaphase cells in each condition. Means and SDs from three independent experiments are shown (B). Lysates of asynchronously growing cells were immunoblotted (C). Arrows point to the UFBs.
- D, E
HeLa cells were released from single thymidine block, and after 7 h, BAY 1816032 or DMSO was added for 5 h. Cells were then fixed and subjected to immunofluorescence staining as in (A). Example images of anaphase cells are shown (D). The percentage of anaphases with PICH was determined (E). Arrows point to the UFBs.
- F, G
HeLa cells were arrested in a prometaphase‐like state with nocodazole treatment for 5 h, and then BAY 1816032 or DMSO was added for 1 h in the continued presence of nocodazole. Then, nocodazole was removed by washing into fresh medium containing BAY 1816032 or DMSO. After 1 h, cells were fixed and subjected to immunofluorescence staining. Example images are shown (F). The percentage of anaphases with PICH was determined (G). Arrows point to the UFBs.
- H–K
HeLa and the Sgo1‐K492A cells transfected with the indicated siRNA were synchronized and treated with BAY 1816032 or DMSO as in (D), and then immunostained with the indicated antibodies. Example images of anaphase cells are shown (H). The percentage of anaphases with PICH was determined in at least 256 cells in each condition. Means and SDs from three independent experiments are shown (I). Example images of prometaphase cells immunostained with the indicated antibodies are shown (J). Lysates of nocodazole‐arrested mitotic cells were immunoblotted (K). Arrows point to the UFBs.

- A
HeLa cells were transfected with plasmids encoding CB‐GFP or CB‐TOP2A‐GFP. Lysates of asynchronously growing cells were immunoblotted with the indicated antibodies.
- B–D
HeLa cells transfected with siRNA and plasmids encoding the indicated proteins were released from single thymidine block. At 12 h post‐release, cells were fixed and subjected to immunofluorescence staining with DAPI and the antibodies for PICH, GFP and CENP‐C. Example images of anaphase cells are shown (B). The percentage of anaphases with PICH was determined in at least 152 cells in each condition. Means and SDs from three independent experiments are shown (C). Lysates of nocodazole‐arrested mitotic cells were immunoblotted (D). * represents non‐specific bands. Arrows point to the UFBs.
- E, F
HeLa cells transiently expressing CB‐GFP or CB‐TOP2A‐GFP were released from single thymidine block, and after 7 h, BAY 1816032 or DMSO was added for 5 h. Cells were then fixed and subjected to immunofluorescence staining as in (B). Example images of anaphase cells are shown (E). The percentage of anaphases with PICH was determined in at least 142 cells in each condition. Means and SDs from three independent experiments are shown (F). Arrows point to the UFBs.
- G–I
HeLa cells transfected with siRNA and plasmids encoding EGFP‐TOP2A (WT or ΔChT) were synchronized as in (B), and then subjected to immunofluorescence staining with DAPI, ACA and the antibodies for PICH and GFP. Example images of anaphase cells are shown (G). The percentage of anaphases with PICH was determined in at least 174 cells in each condition. Means and SDs from three independent experiments are shown (H). Lysates of asynchronous cells were immunoblotted (I). Arrows point to the UFBs.
Similar articles
-
TIP60 acetylation of Bub1 regulates centromeric H2AT120 phosphorylation for faithful chromosome segregation.Sci China Life Sci. 2024 Sep;67(9):1957-1969. doi: 10.1007/s11427-023-2604-8. Epub 2024 May 17. Sci China Life Sci. 2024. PMID: 38763998
-
A positive feedback mechanism ensures proper assembly of the functional inner centromere during mitosis in human cells.J Biol Chem. 2019 Feb 1;294(5):1437-1450. doi: 10.1074/jbc.RA118.006046. Epub 2018 Nov 29. J Biol Chem. 2019. PMID: 30498087 Free PMC article.
-
Phospho-H2A and cohesin specify distinct tension-regulated Sgo1 pools at kinetochores and inner centromeres.Curr Biol. 2013 Oct 7;23(19):1927-33. doi: 10.1016/j.cub.2013.07.078. Epub 2013 Sep 19. Curr Biol. 2013. PMID: 24055156
-
Sister chromatid decatenation: bridging the gaps in our knowledge.Cell Cycle. 2015;14(19):3040-4. doi: 10.1080/15384101.2015.1078039. Cell Cycle. 2015. PMID: 26266709 Free PMC article. Review.
-
Topoisomerase II: untangling its contribution at the centromere.Chromosome Res. 2004;12(6):569-83. doi: 10.1023/B:CHRO.0000036608.91085.d1. Chromosome Res. 2004. PMID: 15289664 Review.
Cited by
-
You shall not pass! A Chromatin barrier story in plants.Front Plant Sci. 2022 Sep 20;13:888102. doi: 10.3389/fpls.2022.888102. eCollection 2022. Front Plant Sci. 2022. PMID: 36212303 Free PMC article. Review.
-
miR-30c-2-3p suppresses the proliferation of human renal cell carcinoma cells by targeting TOP2A.Asian Biomed (Res Rev News). 2023 Oct 9;17(3):124-135. doi: 10.2478/abm-2023-0052. eCollection 2023 Jun. Asian Biomed (Res Rev News). 2023. PMID: 37818158 Free PMC article.
-
VprBP/DCAF1 Triggers Melanomagenic Gene Silencing through Histone H2A Phosphorylation.Biomedicines. 2023 Sep 17;11(9):2552. doi: 10.3390/biomedicines11092552. Biomedicines. 2023. PMID: 37760992 Free PMC article.
-
BUB1 an Overexpressed Kinase in Sarcoma: Finding New Target Therapy for Osteosarcoma, Liposarcoma, Synovial Sarcoma, and Leiomyosarcoma.Biomolecules. 2025 Jul 18;15(7):1046. doi: 10.3390/biom15071046. Biomolecules. 2025. PMID: 40723917 Free PMC article.
-
Human Topoisomerase IIα Promotes Chromatin Condensation Via a Phase Transition.bioRxiv [Preprint]. 2024 Oct 18:2024.10.15.618281. doi: 10.1101/2024.10.15.618281. bioRxiv. 2024. PMID: 39464128 Free PMC article. Preprint.
References
-
- Aihara H, Nakagawa T, Mizusaki H, Yoneda M, Kato M, Doiguchi M, Imamura Y, Higashi M, Ikura T, Hayashi T et al (2016) Histone H2A T120 phosphorylation promotes oncogenic transformation via upregulation of cyclin D1. Mol Cell 64: 176–188 - PubMed
-
- Baumann C, Korner R, Hofmann K, Nigg EA (2007) PICH, a centromere‐associated SNF2 family ATPase, is regulated by Plk1 and required for the spindle checkpoint. Cell 128: 101–114 - PubMed
Publication types
MeSH terms
Substances
Grants and funding
- 2017YFA0503600/National Key Research and Development Program of China/International
- NA140075/Royal Society Newton Advanced Fellowship/International
- 2014XZZX003-35/Fundamental Research Funds for the Central Universities in China/International
- 2018QN81011/Fundamental Research Funds for the Central Universities in China/International
- 31571393/National Natural Science Foundation of China (NSFC)/International
- 31771499/National Natural Science Foundation of China (NSFC)/International
- 31322032/National Natural Science Foundation of China (NSFC)/International
- 31371359/National Natural Science Foundation of China (NSFC)/International
- 31561130155/National Natural Science Foundation of China (NSFC)/International
- 81702552/National Natural Science Foundation of China (NSFC)/International
- LZ19C070001/Natural Science Foundation of Zhejiang Province/International
- LR13C070001/Natural Science Foundation of Zhejiang Province/International
LinkOut - more resources
Full Text Sources
Miscellaneous
