. 2020 Jan;9(2):711-723.
doi: 10.1002/cam4.2611. Epub 2019 Nov 25.

p65/miR-23a/CCL22 axis regulated regulatory T cells recruitment in hepatitis B virus positive hepatocellular carcinoma

Affiliations

p65/miR-23a/CCL22 axis regulated regulatory T cells recruitment in hepatitis B virus positive hepatocellular carcinoma

Zhi-Qin Li et al. Cancer Med. 2020 Jan.

Abstract

Background: CCL22 played critical roles in Tregs recruitment. The upstream regulators modulating CCL22 in hepatocellular carcinoma (HCC) were not clearly understood.

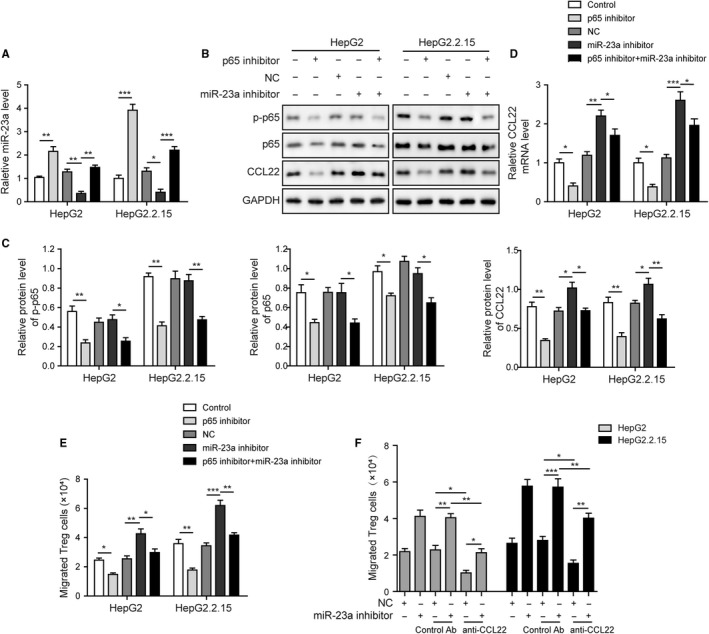
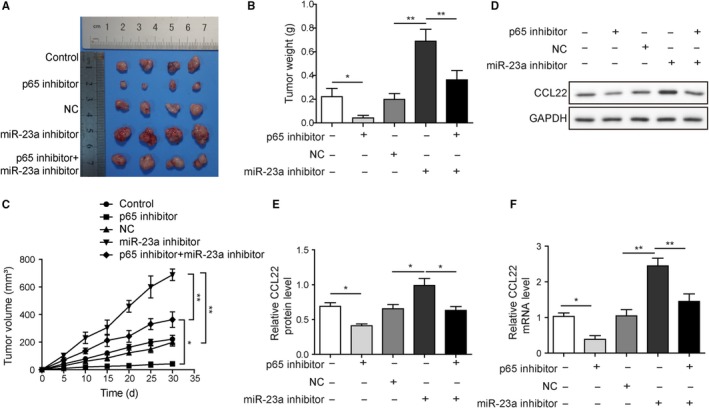
Methods: MiR-23a, p-p65, p65, CCL22, and Foxp3 levels were monitored by RT-qPCR and western blotting. Immunofluorescence assay was used to perform the costaining of Foxp3 and CD4 on liver tissues. Transwell assay was applied to evaluate the migration ability of Tregs. Dual-luciferase assay was performed to determine relationship of miR-23a/CCL22 and p65/miR-23a. Chromatin immunoprecipitation (ChIP) was applied to detect the direct binding of p65 to miR-23a promoter. Xenograft tumor models were developed to investigate the functions of p65 and miR-23a in vivo.

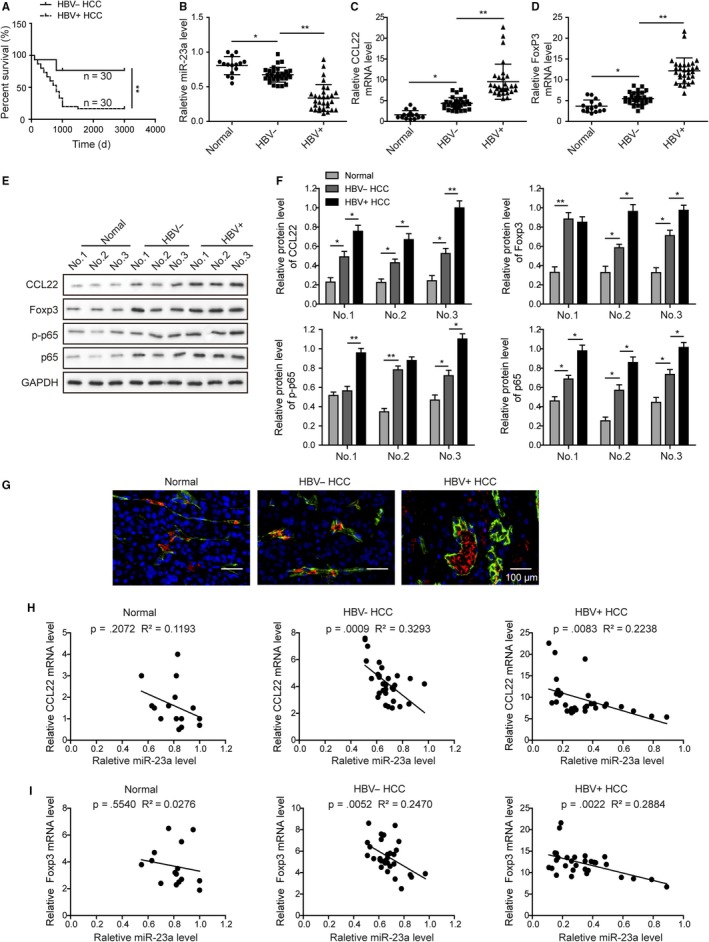
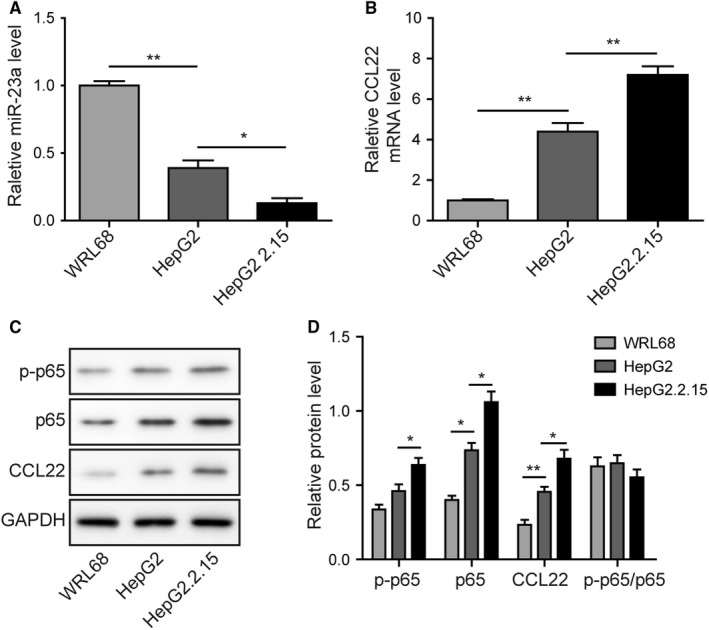
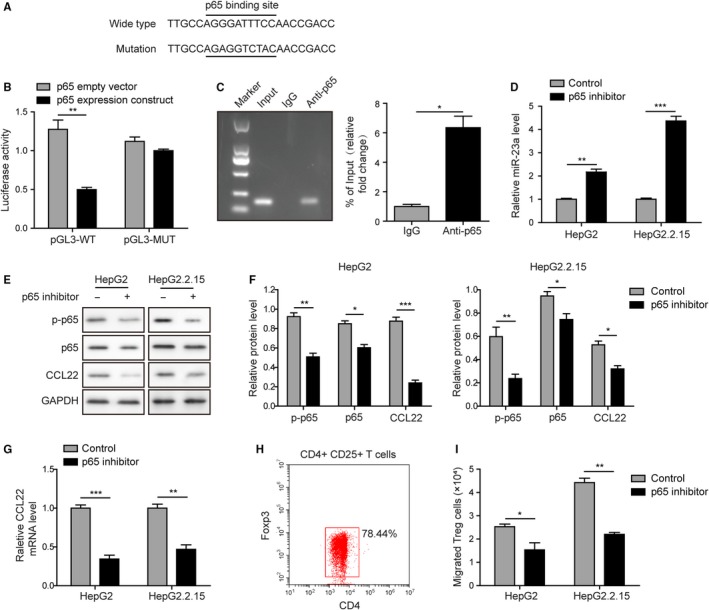
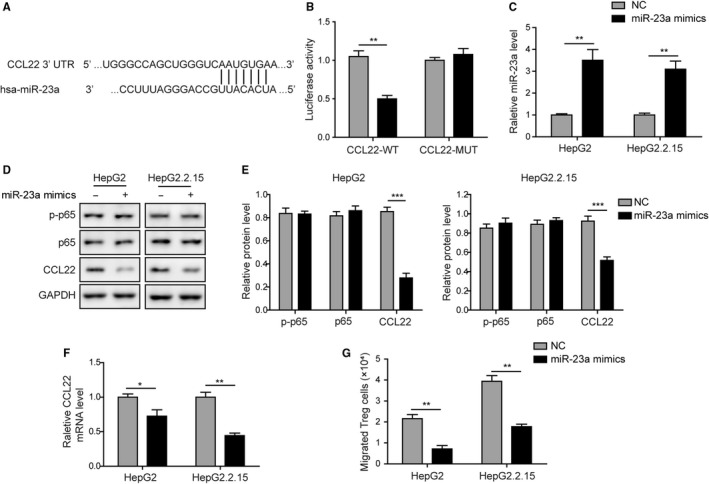
Results: HBV infection was associated with reduced survival and increased Tregs recruitment in HCC patients. MiR-23a was decreased, whereas p65, CCL22, and Foxp3 were increased in HBV+ tumors. MiR-23a was inversely correlated with CCL22 and Foxp3 expression in HCC. MiR-23a directly targeted CCL22 3'UTR, leading to CCL22 reduction and attenuated Tregs recruitment. Meanwhile, p65 functioned as a transcription repressor of miR-23a by directly binding to its promoter. Inhibition of p65 induced miR-23 expression, leading to less CCL22 expression and Tregs recruitment in vitro. CCL22 was the indispensable effector underlying p65/miR-23a axis and Tregs recruitment. MiR-23a inhibitor promoted xenografted tumor growth accompanying with upregulation of CCL22, whereas p65 inhibition exerted opposite effects.

Conclusion: Blockage of p65 disinhibited miR-23a expression, leading to CCL22 reduction and repress Tregs recruitment. Targeting p65/miR-23a/CCL22 axis was a novel approach for HBV+ HCC treatment.

Keywords: CCL22; HBV; MiR-23a; Tregs recruitment; hepatocellular carcinoma; p65.


Conflict of interest statement

The authors declare that they have no conflicts of interest.

Figures

Figure 1
Figure 1
Lower miR‐23a expression was correlated with higher level of CCL22 expression and intratumoral Treg recruitment in HBV‐positive HCC. A, HBV infection was associated with patient survival rate of HCC. Patients carrying HBV (n = 30) had significantly poorer prognosis than HBV patients (n = 30). B, HBV tissues (n = 30) and HBV+ tissues (n = 30) expressed significantly lower level of miR‐23a. C, HBV tissues and HBV+ tissues expressed significantly higher mRNA level of CCL22. D, HBV tissues and HBV+ tissues expressed significantly higher mRNA level of Foxp3. E, The protein levels of CCL22, Foxp3, p‐p65, and p65 in normal control, HBV and HBV+ tumor tissues were evaluated by western blotting. F, The gray scale analysis of CCL22, Foxp3, p‐p65, and p65 in normal control, HBV− and HBV+ tumor tissues. In ascending order: normal < HBV < HBV+. G, Foxp3 signals (red) were colocalized with CD4 (green) signals in tissues. The ratios of Foxp3+CD4+ cells were gradually increased from normal, HBV HCC to HBV+ HCC tissues. H. MiR‐23a level was inversely correlated with CCL22 expression in HCC tissues, but not in normal control. I. MiR‐23a level was inversely correlated with Foxp3 expression in HCC tissues, but not in normal control. Error bars represented mean ± SD. **P < .01 and *P < .05. HBV+, HCC tissues with HBV infection. HBV, HCC tissues without HBV infection. Normal, normal liver samples
Figure 2
Figure 2
MiR‐23a, p‐p65, p65, and CCL22 levels were dysregulated in HCC cell lines. A, RT‐qPCR revealed that miR‐23a expression was lowest in the HBV‐positive HepG2.2.15 cell line. B, Highest mRNA level of CCL22 was observed in HepG2.2.15. C, Protein levels of p‐p65, p65, and CCL22 in three cell lines were determined by Western blotting. D, The gray scale analysis of p‐p65, p65, CCL22 and ratio of p‐p65/p65 in three cell lines. Expression of CCL22, p‐p65, and p65 were higher in HBV+ HepG2.2.15 cells than their parental HBV HepG2 cells and normal WRL68 cells. Error bars represented mean ± SD. **P < .01 and *P < .05
Figure 3
Figure 3
p65 promoted Tregs recruitment via directly modulating miR‐23a. A, A p65‐binding site could be found in miR‐23a promoter region. B, Overexpression of p65 significantly reduced the luciferase activity driven by miR‐23a promoter. Mutagenesis in the p65‐binding site released such repression. C, ChIP assay confirmed that p65 could bind to the promoter region of miR‐23a. D, p65 inhibition upregulated miR‐23a level. E, p65 inhibitor significantly reduced the p‐p65, p65, and CCL22 protein levels in HepG2 and HepG2.2.15 cells. F, The gray scale analysis of p‐p65, p65, CCL22 after p65 inhibitor treatment. G, p65 inhibition dampened CCL22 mRNA level. H, CD4+CD25+ Foxp3+ human Tregs were identified. I, HBV+ HepG2.2.15 cells caused more Tregs to migrate through transwell membrane than HBV HpeG2 cells. Pretreatment with p65 inhibitor attenuated Tregs transmigration in both cell lines. Error bars represented mean ± SD. *P < .05, **P < .01, and ***P < .001
Figure 4
Figure 4
MiR‐23a inhibited Tregs migration by directly targeting CCL22. A, CCL22 3′UTR contains a putative miR‐23a‐binding site. B, MiR‐23a mimics significantly reduced the luciferase activity tagged with wide type of CCL22 3′UTR. Mutagenesis in the miR‐23a‐binding site abolished the inhibitory actions. C, Transfection of miR‐23a mimics efficiently increased miR‐23a level in both cell lines. D, The effects of miR‐23a overexpression on p‐p65, p65, and CCL22 protein levels in HepG2 and HepG2.2.15 cells were assessed by western blotting. E, The gray scale analysis of p‐p65, p65, CCL22 after miR‐23a overexpression. MiR‐23a mimics transfection did not alter the expression of p65 and its phosphorylation but CCL22 was significantly reduced by miR‐23a mimics. F, MiR‐23a mimics significantly reduced CCL22 mRNA level. G, Overexpression of miR‐23a was sufficient to attenuate Tregs transmigration in both cell lines. Error bars represented mean ± SD. *P < .05, **P < .01, and ***P < .001
Figure 5
Figure 5
MiR‐23a inhibitor reversed p65 inhibition effects on CCL22 and Tregs recruitment. A, MiR‐23a inhibitor reversed p65 inhibition effects on miR‐23a level. B, The effects of miR‐23a inhibition and p65 inhibitor treatment on p‐p65, p65, and CCL22 protein levels in HepG2 and HepG2.2.15 cells were assessed by western blotting. C, The gray scale analysis of p‐p65, p65, CCL22. MiR‐23a inhibitor reversed p65 inhibition effects on CCL22 protein level but had no effects on p‐p65 and p65. D, MiR‐23a inhibitor reversed p65 inhibition effects on CCL22 mRNA level. E, MiR‐23a inhibitor reversed p65 inhibition effects on Tregs recruitment. F, CCL22 neutralizing antibody reversed miR‐23a inhibitor‐mediated Tregs migration. Error bars represented mean ± SD. *P < .05, **P < .01, and ***P < .001
Figure 6
Figure 6
MiR‐23a inhibitor reversed p65 inhibition effects on HBV‐positive xenograft tumor growth. A, Xenografted tumors were harvested after different treatments. B and C, p65 inhibitor treatment significantly retarded tumor growth and miR‐23a inhibitor promoted tumor growth as indicated by the tumor weight and size. The therapeutic effects of p65 inhibitor were abolished by cotreatment with miR‐23a inhibitor. D, CCL22 protein levels from each group were detected by western blotting. E, Statistical results in D. p65 inhibitor led to reduction of CCL22 protein level but miR‐23a inhibitor increased CCL22 level in tumor tissues. F, p65 inhibitor led to reduction of CCL22 mRNA level but miR‐23a inhibitor increased CCL22 mRNA level in tumor tissues. MiR‐23a inhibitor reversed p65 inhibition effects on CCL22 level in tumor tissues. Error bars represented mean ± SD. *P < .05 and **P < .01

References

    1. Chen W, Zheng R, Baade PD, et al. Cancer statistics in China, 2015. CA Cancer J Clin. 2016;66:115‐132. - PubMed
    1. Yu MC, Yuan JM, Govindarajan S, Ross RK. Epidemiology of hepatocellular carcinoma. Can J Gastroenterol. 2000;14:703‐709. - PubMed
    1. Spranger S, Gajewski TF. Impact of oncogenic pathways on evasion of antitumour immune responses. Nat Rev Cancer. 2018;18:139‐147. - PMC - PubMed
    1. Zou W. Immunosuppressive networks in the tumour environment and their therapeutic relevance. Nat Rev Cancer. 2005;5:263‐274. - PubMed
    1. Zou W. Regulatory T cells, tumour immunity and immunotherapy. Nat Rev Immunol. 2006;6:295‐307. - PubMed

Publication types

MeSH terms