

Life Expectancy and Mortality Rates in the United States, 1959-2017
- PMID: 31769830
- PMCID: PMC7146991
- DOI: 10.1001/jama.2019.16932
Life Expectancy and Mortality Rates in the United States, 1959-2017
Abstract
Importance: US life expectancy has not kept pace with that of other wealthy countries and is now decreasing.
Objective: To examine vital statistics and review the history of changes in US life expectancy and increasing mortality rates; and to identify potential contributing factors, drawing insights from current literature and an analysis of state-level trends.
Evidence: Life expectancy data for 1959-2016 and cause-specific mortality rates for 1999-2017 were obtained from the US Mortality Database and CDC WONDER, respectively. The analysis focused on midlife deaths (ages 25-64 years), stratified by sex, race/ethnicity, socioeconomic status, and geography (including the 50 states). Published research from January 1990 through August 2019 that examined relevant mortality trends and potential contributory factors was examined.
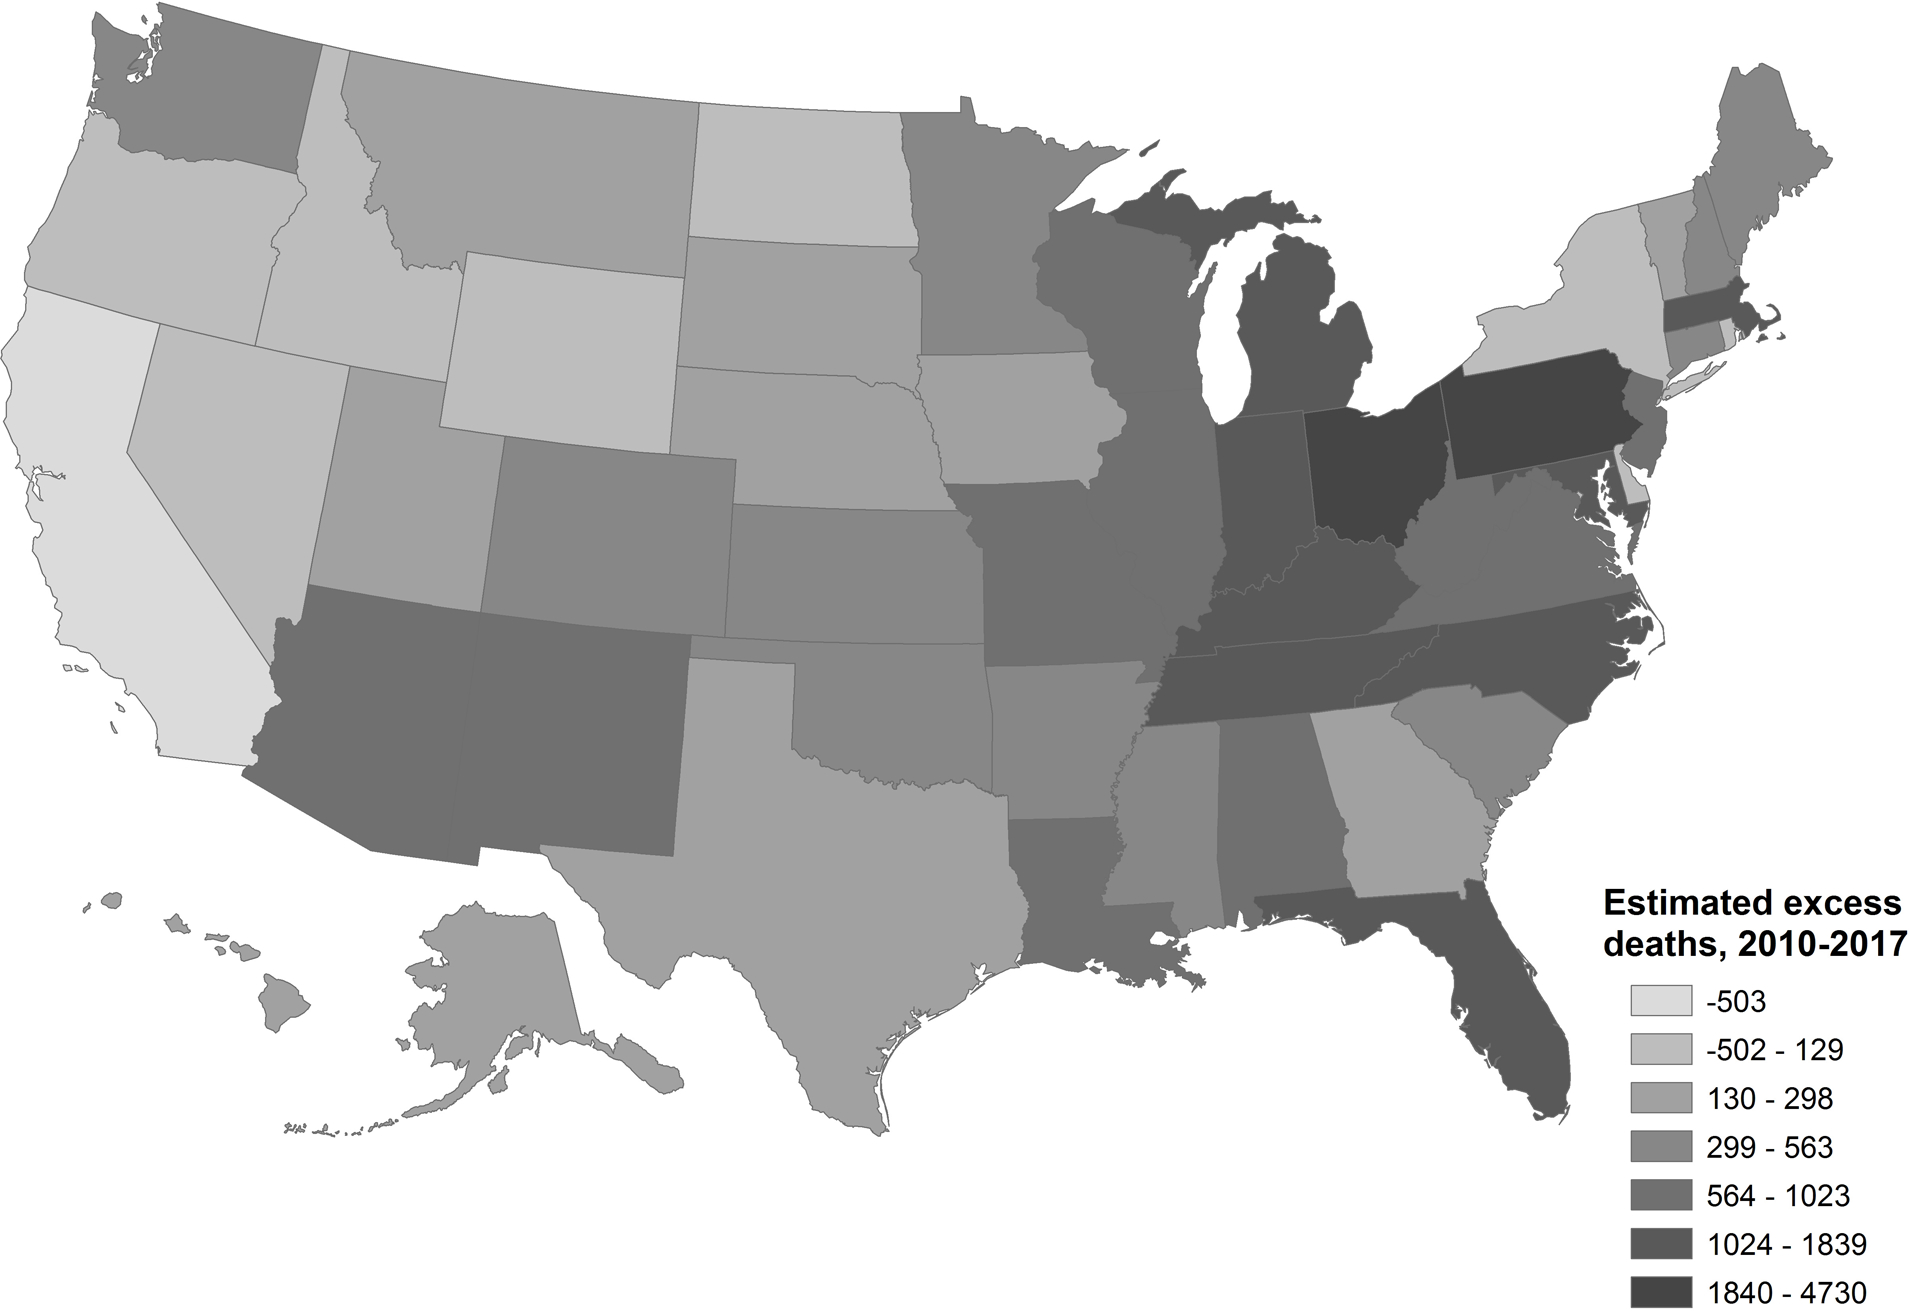
Findings: Between 1959 and 2016, US life expectancy increased from 69.9 years to 78.9 years but declined for 3 consecutive years after 2014. The recent decrease in US life expectancy culminated a period of increasing cause-specific mortality among adults aged 25 to 64 years that began in the 1990s, ultimately producing an increase in all-cause mortality that began in 2010. During 2010-2017, midlife all-cause mortality rates increased from 328.5 deaths/100 000 to 348.2 deaths/100 000. By 2014, midlife mortality was increasing across all racial groups, caused by drug overdoses, alcohol abuse, suicides, and a diverse list of organ system diseases. The largest relative increases in midlife mortality rates occurred in New England (New Hampshire, 23.3%; Maine, 20.7%; Vermont, 19.9%) and the Ohio Valley (West Virginia, 23.0%; Ohio, 21.6%; Indiana, 14.8%; Kentucky, 14.7%). The increase in midlife mortality during 2010-2017 was associated with an estimated 33 307 excess US deaths, 32.8% of which occurred in 4 Ohio Valley states.
Conclusions and relevance: US life expectancy increased for most of the past 60 years, but the rate of increase slowed over time and life expectancy decreased after 2014. A major contributor has been an increase in mortality from specific causes (eg, drug overdoses, suicides, organ system diseases) among young and middle-aged adults of all racial groups, with an onset as early as the 1990s and with the largest relative increases occurring in the Ohio Valley and New England. The implications for public health and the economy are substantial, making it vital to understand the underlying causes.
Figures
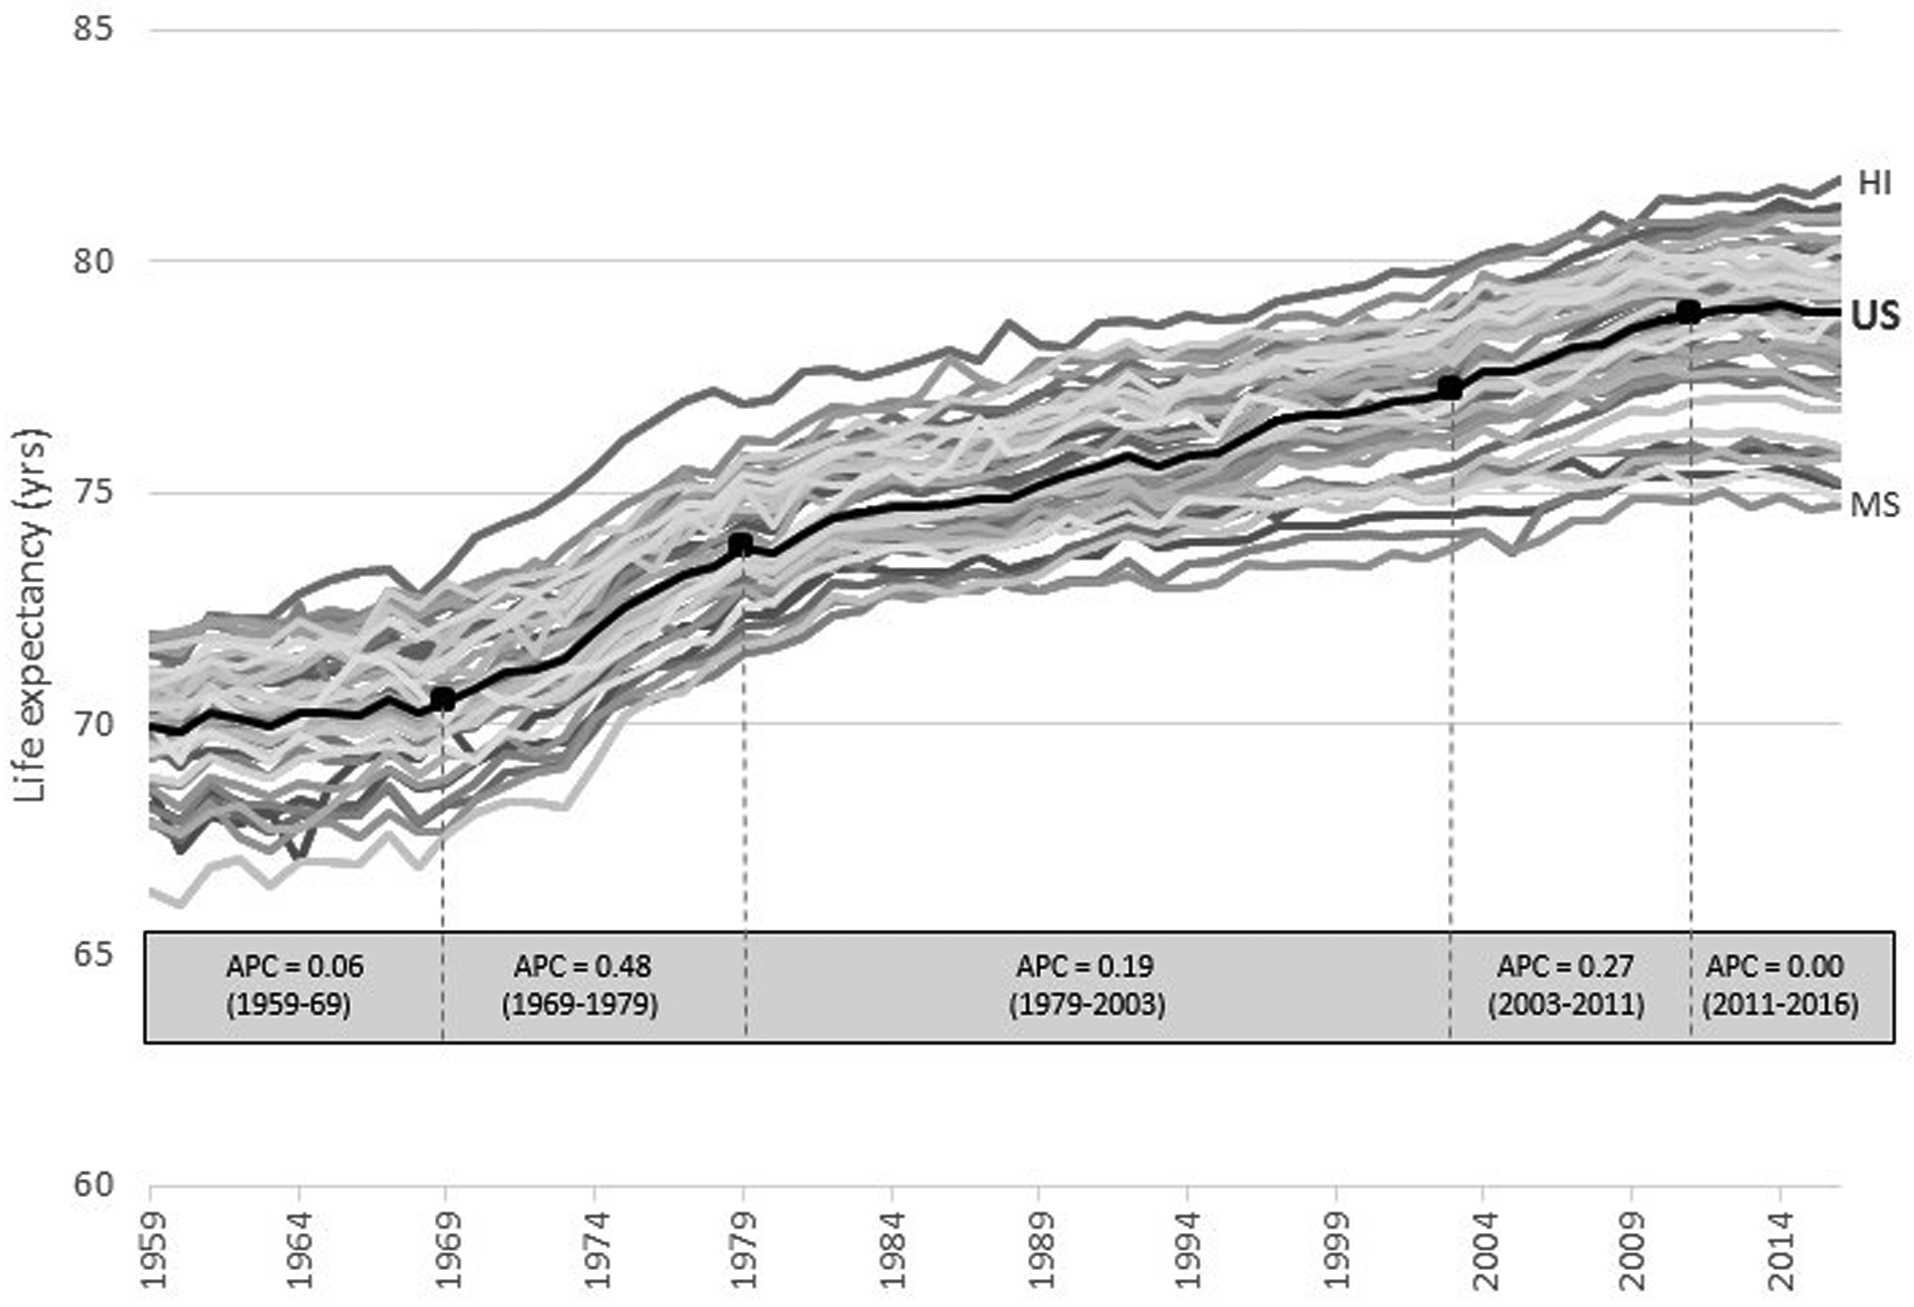
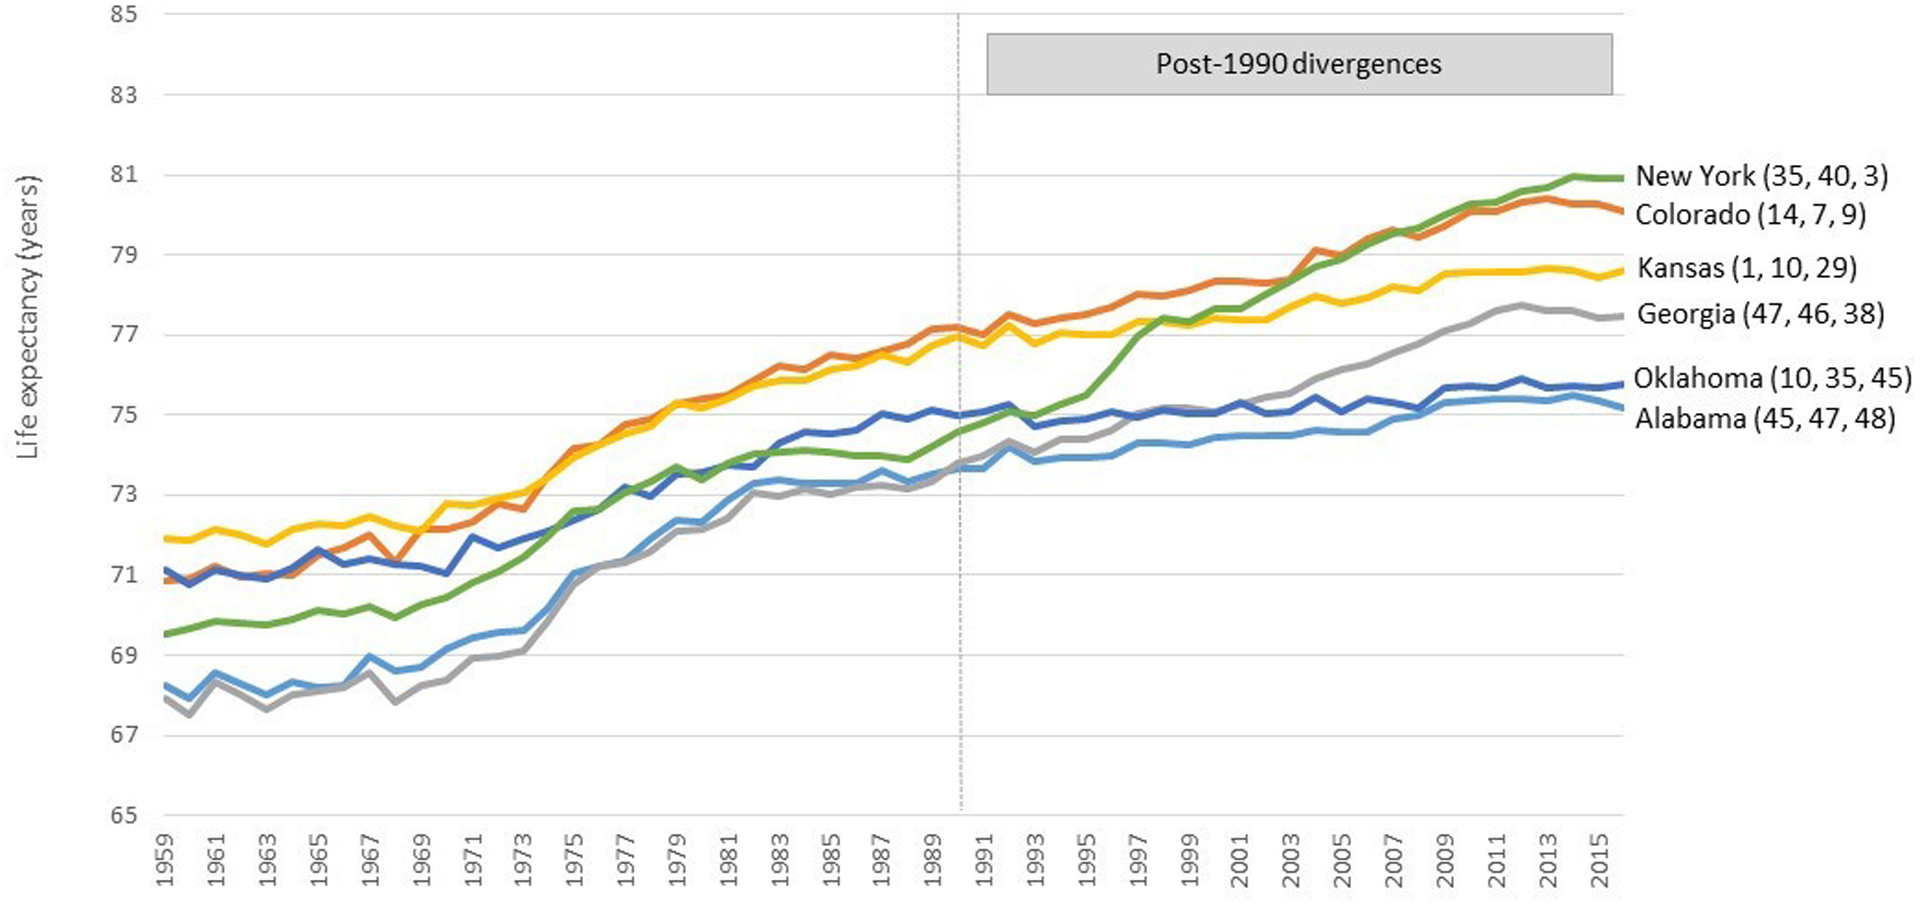
 ) denote joinpoint
years, when the linear trend (slope) changed significantly based on joinpoint
analysis. APC = average annual percent change for the five time periods
identified on joinpoint analysis (1959–1969, 1969–1979,
1979–2003, 2003–2011, and 2011–2016). Grey lines depict
life expectancy for the 50 states. Life expectancy data obtained from the US
Mortality Database.
) denote joinpoint
years, when the linear trend (slope) changed significantly based on joinpoint
analysis. APC = average annual percent change for the five time periods
identified on joinpoint analysis (1959–1969, 1969–1979,
1979–2003, 2003–2011, and 2011–2016). Grey lines depict
life expectancy for the 50 states. Life expectancy data obtained from the US
Mortality Database.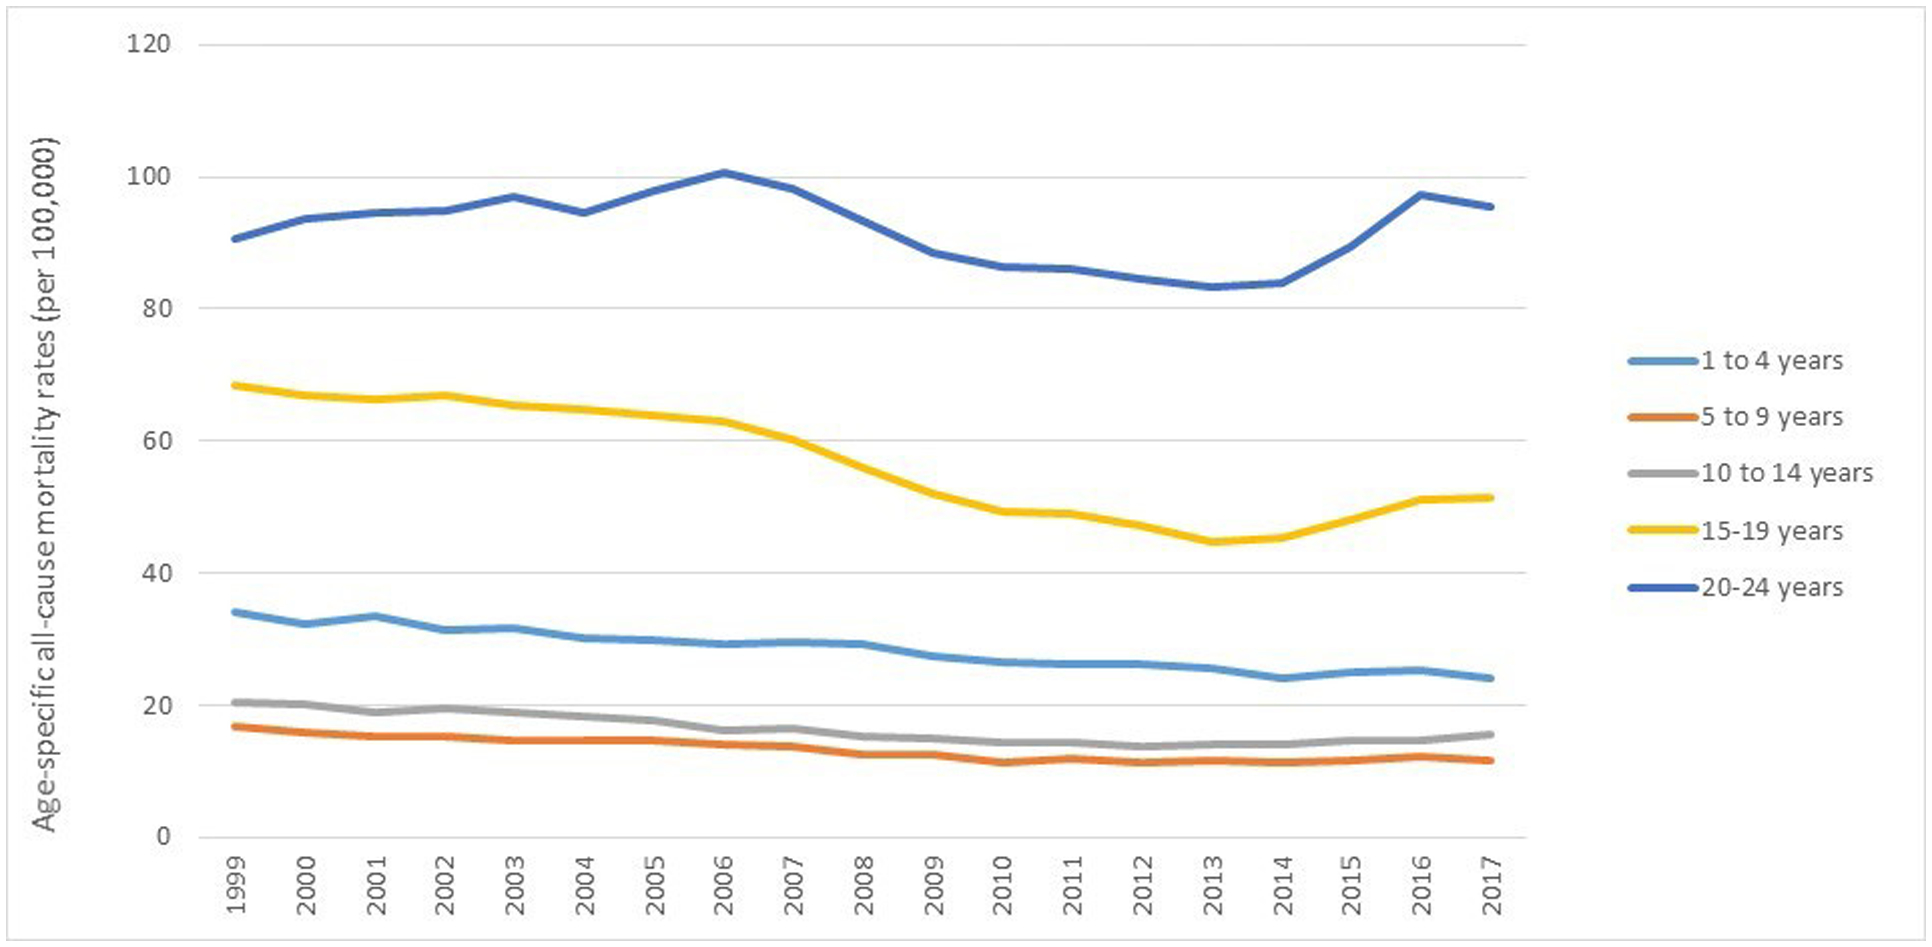
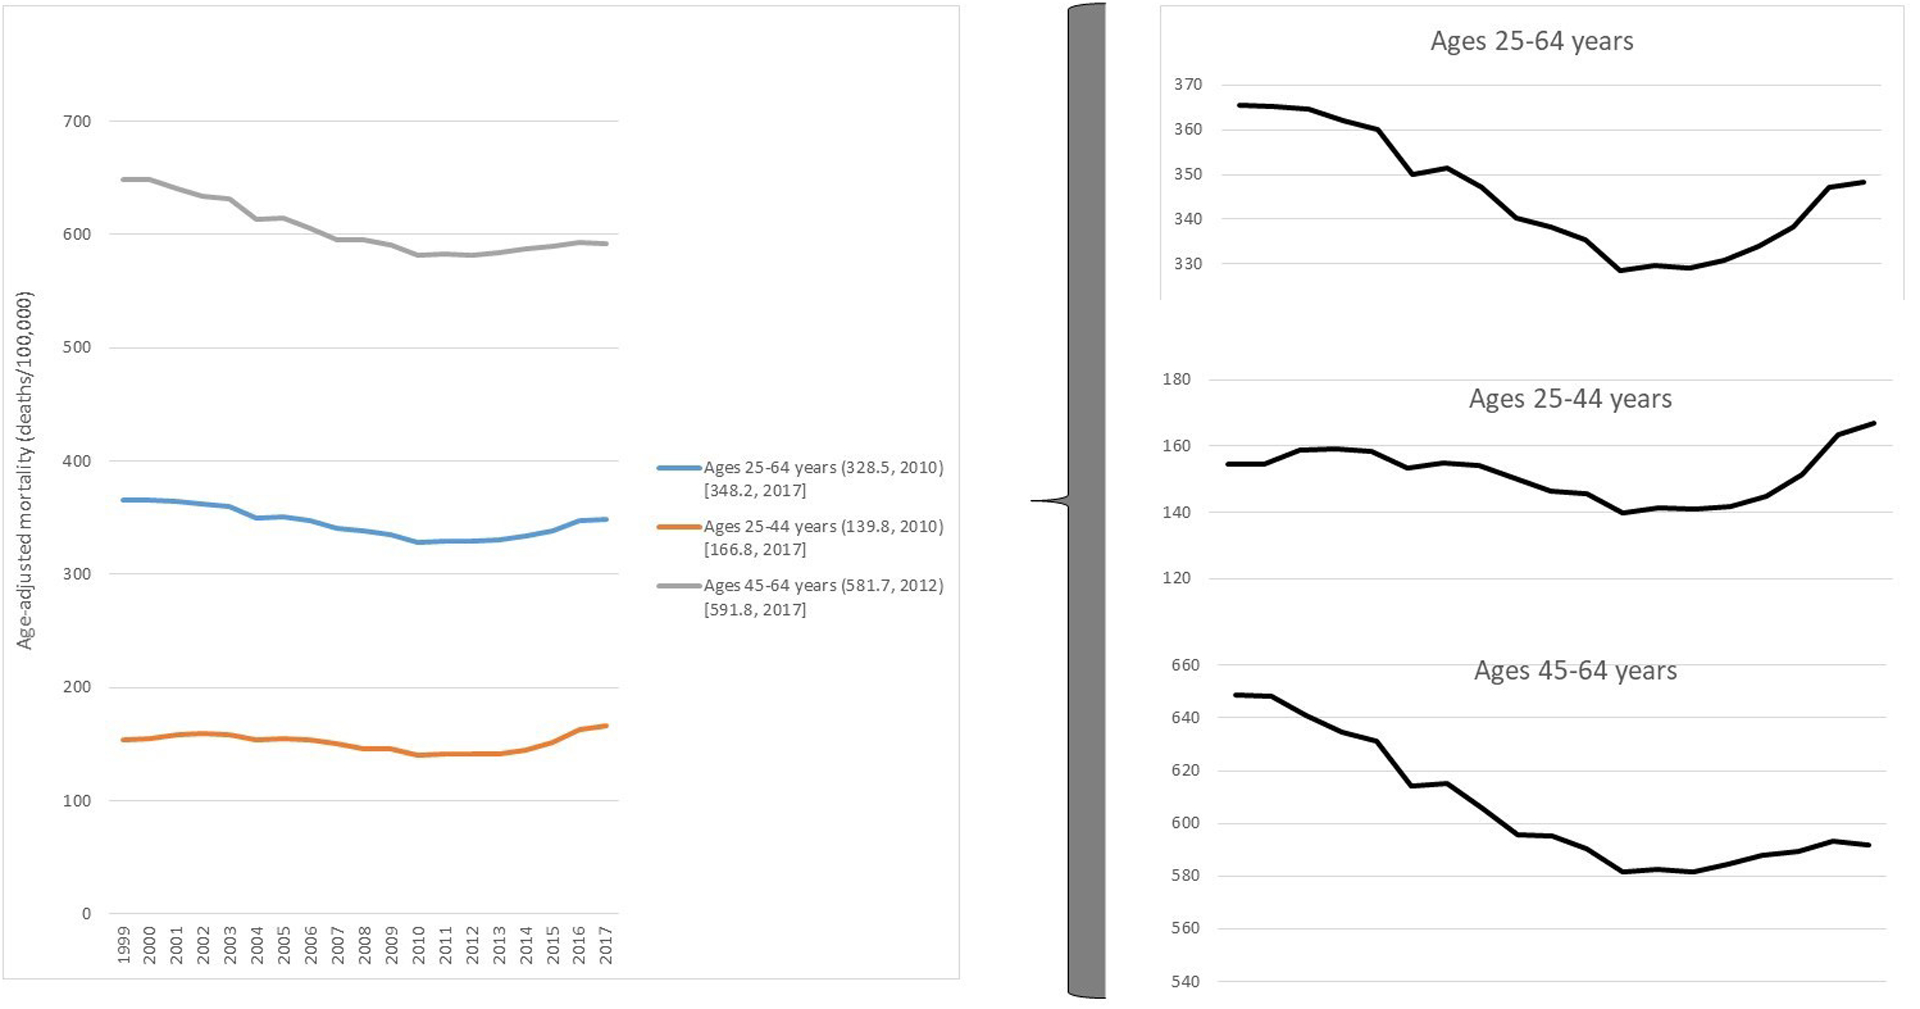
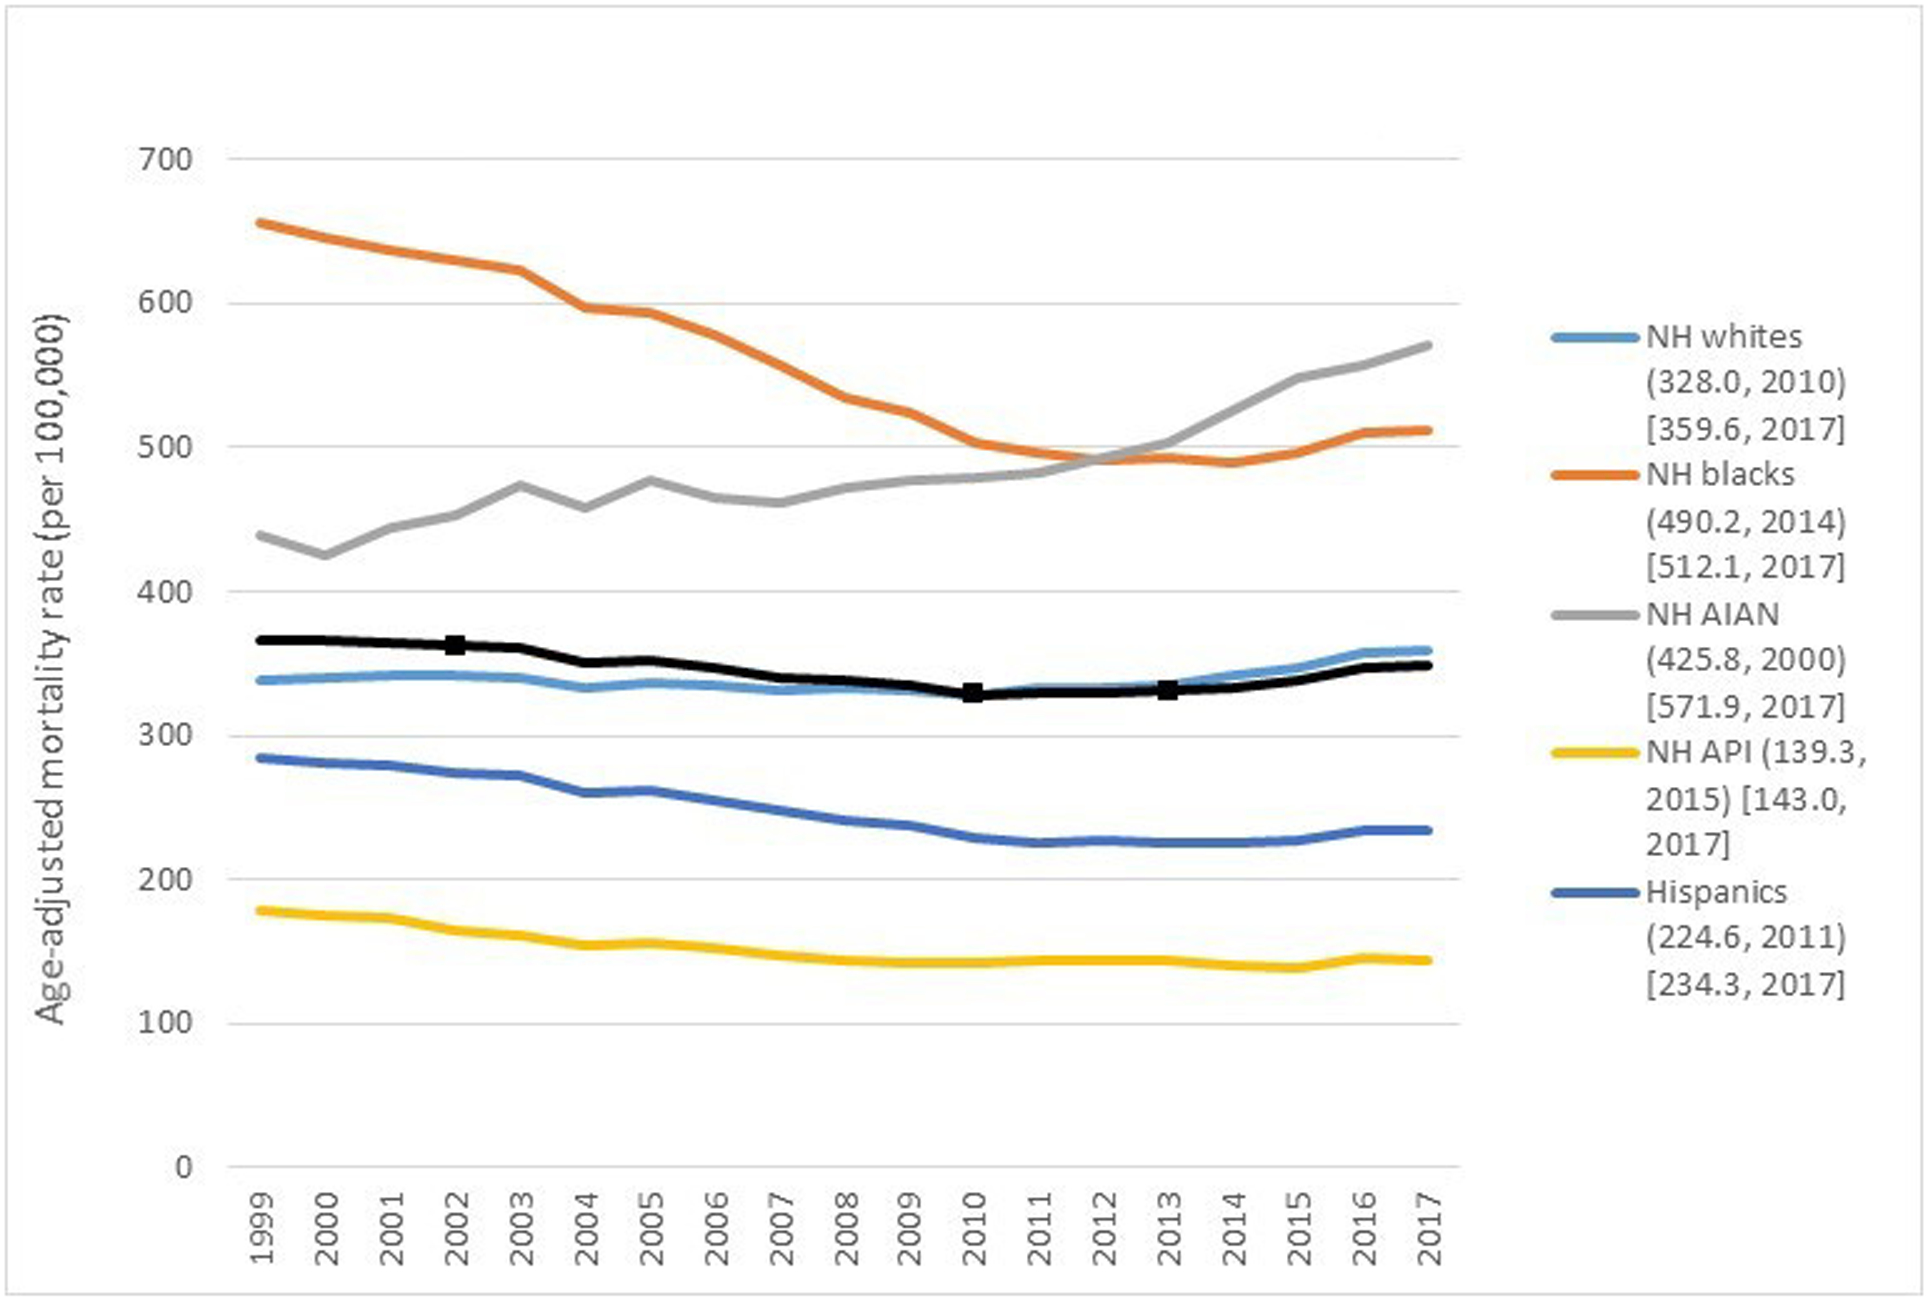
 ) denote joinpoint years, when the linear trend (slope) changed significantly
based on joinpoint analysis. AIAN = American Indians and Alaskan Natives, API =
Asians and Pacific Islanders (API), NH = non-Hispanic. The lowest mortality
rates per 100,000 (and corresponding years) are listed in parentheses; 2017
mortality rates are listed in brackets. Source: CDC WONDER.
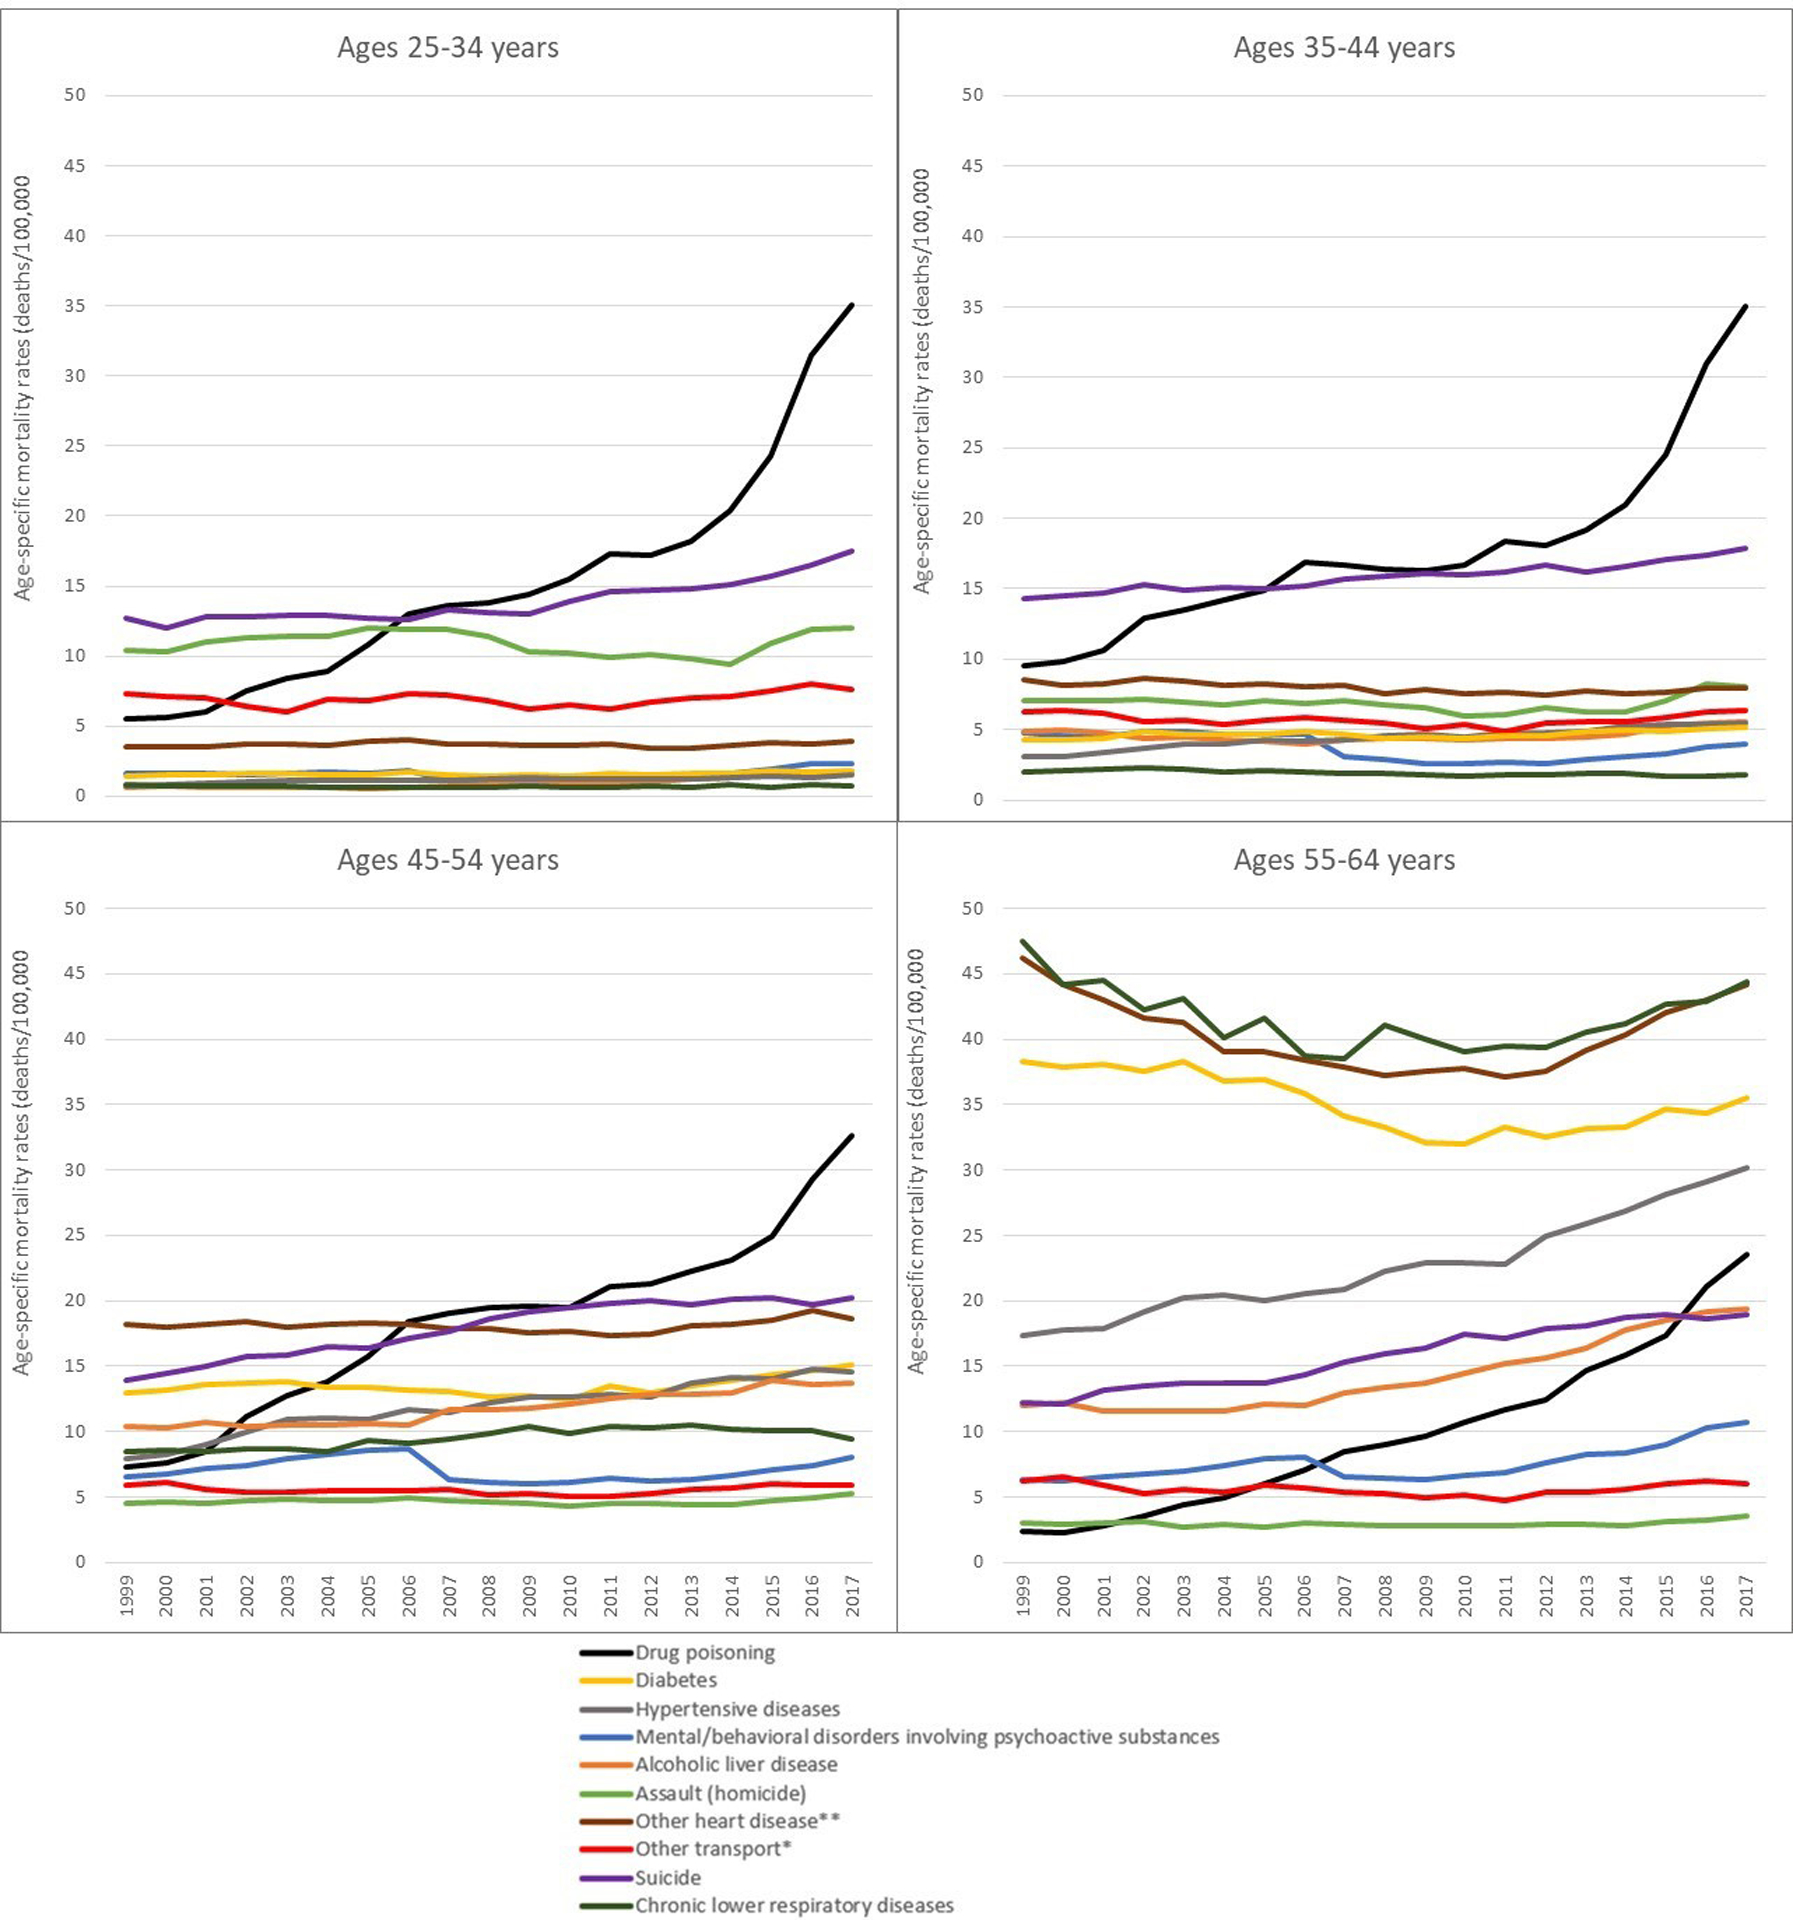
) denote joinpoint years, when the linear trend (slope) changed significantly
based on joinpoint analysis. AIAN = American Indians and Alaskan Natives, API =
Asians and Pacific Islanders (API), NH = non-Hispanic. The lowest mortality
rates per 100,000 (and corresponding years) are listed in parentheses; 2017
mortality rates are listed in brackets. Source: CDC WONDER.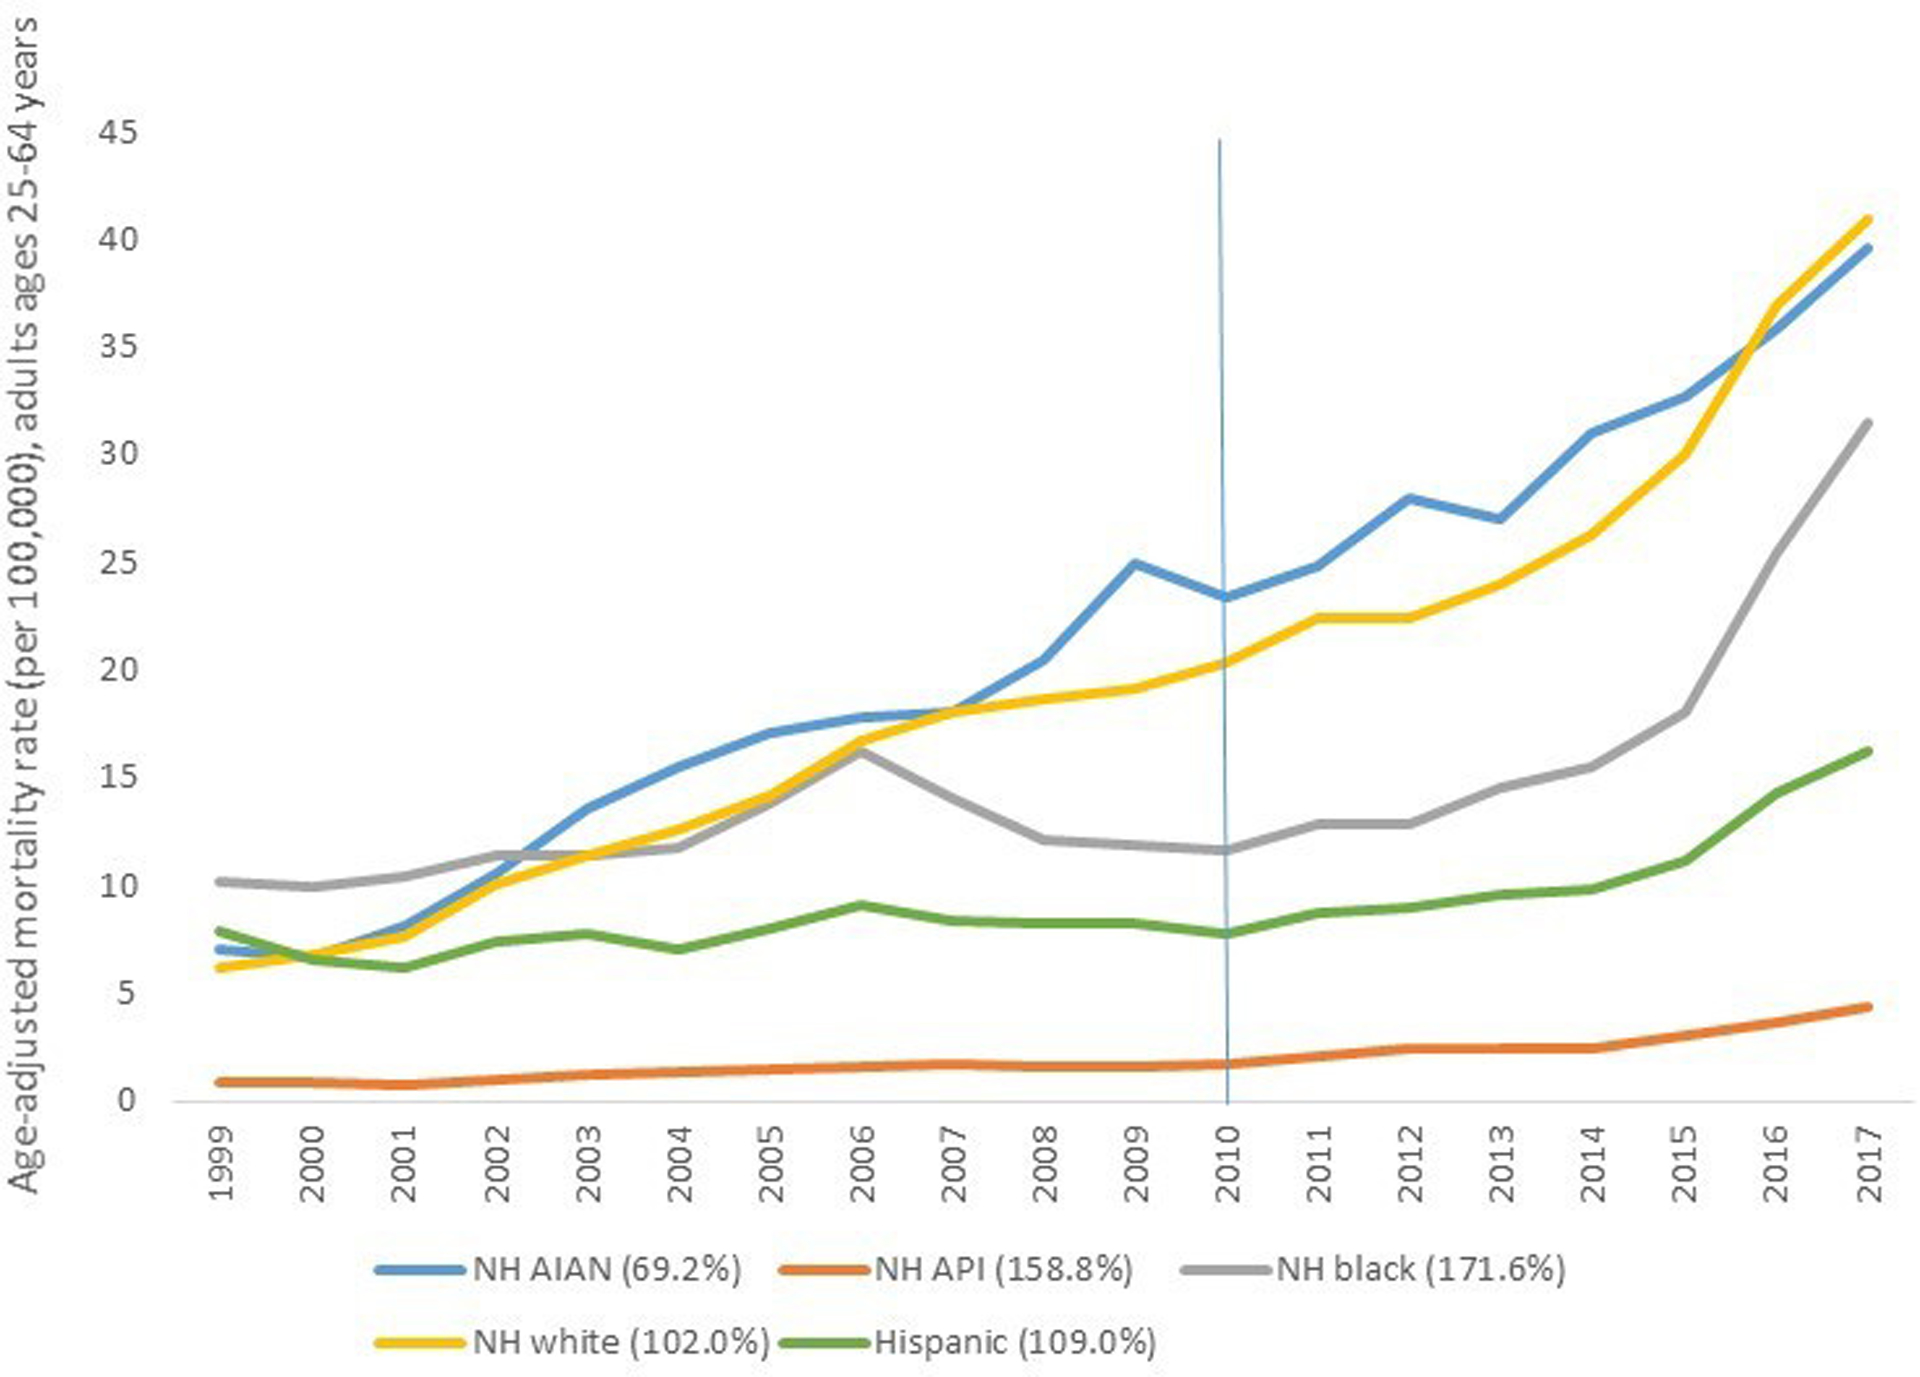
Comment in
-
Confronting the Rise and Fall of US Life Expectancy.JAMA. 2019 Nov 26;322(20):1963-1965. doi: 10.1001/jama.2019.17303. JAMA. 2019. PMID: 31769810 No abstract available.
References
-
- Riley JC. Rising Life Expectancy: A Global History. Cambridge University Press; 2001. June 4.
-
- Murphy SL, Xu JQ, Kochanek KD, Arias E. Mortality in the United States, 2017 NCHS Data Brief, no 328 Hyattsville, MD: National Center for Health Statistics; 2018. - PubMed
-
- Bernstein L. U.S. life expectancy declines again, a dismal trend not seen since World War I. Washington Post, November 21, 2018.
-
- Woolf SH, Aron LY. The US health disadvantage relative to other high-income countries: findings from a National Research Council/Institute of Medicine report. JAMA. 2013;309:771–2. - PubMed
Publication types
MeSH terms
Grants and funding
LinkOut - more resources
Full Text Sources
Miscellaneous
