

Image-Based Morphological Profiling Identifies a Lysosomotropic, Iron-Sequestering Autophagy Inhibitor
- PMID: 31769920
- PMCID: PMC7154763
- DOI: 10.1002/anie.201913712
Image-Based Morphological Profiling Identifies a Lysosomotropic, Iron-Sequestering Autophagy Inhibitor
Abstract
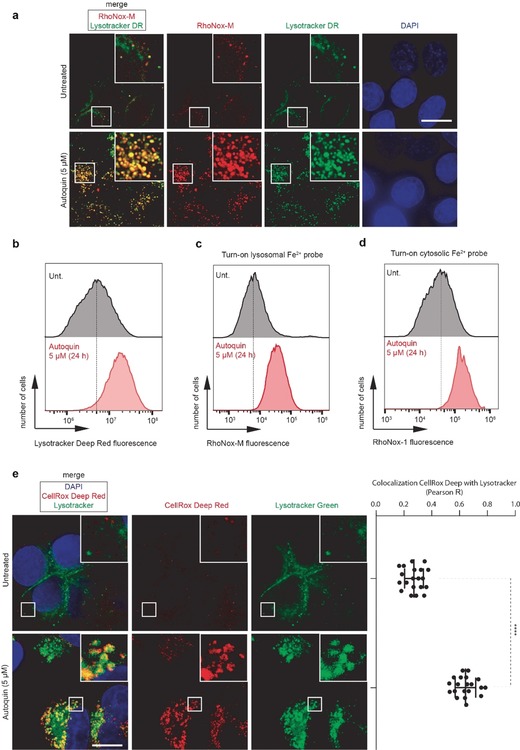
Chemical proteomics is widely applied in small-molecule target identification. However, in general it does not identify non-protein small-molecule targets, and thus, alternative methods for target identification are in high demand. We report the discovery of the autophagy inhibitor autoquin and the identification of its molecular mode of action using image-based morphological profiling in the cell painting assay. A compound-induced fingerprint representing changes in 579 cellular parameters revealed that autoquin accumulates in lysosomes and inhibits their fusion with autophagosomes. In addition, autoquin sequesters Fe2+ in lysosomes, resulting in an increase of lysosomal reactive oxygen species and ultimately cell death. Such a mechanism of action would have been challenging to unravel by current methods. This work demonstrates the potential of the cell painting assay to deconvolute modes of action of small molecules, warranting wider application in chemical biology.
Keywords: autophagy; cell painting; lysosome; proteomics; target identification.
© 2019 The Authors. Published by Wiley-VCH Verlag GmbH & Co. KGaA.
Conflict of interest statement
The authors declare no conflict of interest.
Figures
Similar articles
-
Identification of compound CA-5f as a novel late-stage autophagy inhibitor with potent anti-tumor effect against non-small cell lung cancer.Autophagy. 2019 Mar;15(3):391-406. doi: 10.1080/15548627.2018.1511503. Epub 2018 Sep 6. Autophagy. 2019. PMID: 30145925 Free PMC article.
-
SIGMAR1/Sigma-1 receptor ablation impairs autophagosome clearance.Autophagy. 2019 Sep;15(9):1539-1557. doi: 10.1080/15548627.2019.1586248. Epub 2019 Mar 14. Autophagy. 2019. PMID: 30871407 Free PMC article.
-
Non-thermal plasma induces a stress response in mesothelioma cells resulting in increased endocytosis, lysosome biogenesis and autophagy.Free Radic Biol Med. 2017 Jul;108:904-917. doi: 10.1016/j.freeradbiomed.2017.04.368. Epub 2017 May 2. Free Radic Biol Med. 2017. PMID: 28465262
-
The SAR and action mechanisms of autophagy inhibitors that eliminate drug resistance.Eur J Med Chem. 2022 Dec 15;244:114846. doi: 10.1016/j.ejmech.2022.114846. Epub 2022 Oct 13. Eur J Med Chem. 2022. PMID: 36283182 Review.
-
Lysosomes as Oxidative Targets for Cancer Therapy.Oxid Med Cell Longev. 2017;2017:3749157. doi: 10.1155/2017/3749157. Epub 2017 Jul 5. Oxid Med Cell Longev. 2017. PMID: 28757908 Free PMC article. Review.
Cited by
-
Recent advances in phenotypic drug discovery.F1000Res. 2020 Aug 7;9:F1000 Faculty Rev-944. doi: 10.12688/f1000research.25813.1. eCollection 2020. F1000Res. 2020. PMID: 32850117 Free PMC article. Review.
-
Morphological profiling data resource enables prediction of chemical compound properties.iScience. 2025 Apr 16;28(5):112445. doi: 10.1016/j.isci.2025.112445. eCollection 2025 May 16. iScience. 2025. PMID: 40384930 Free PMC article.
-
Phenazine derivatives attenuate the stemness of breast cancer cells through triggering ferroptosis.Cell Mol Life Sci. 2022 Jun 11;79(7):360. doi: 10.1007/s00018-022-04384-1. Cell Mol Life Sci. 2022. PMID: 35690642 Free PMC article.
-
From Phenotypic Hit to Chemical Probe: Chemical Biology Approaches to Elucidate Small Molecule Action in Complex Biological Systems.Molecules. 2020 Dec 3;25(23):5702. doi: 10.3390/molecules25235702. Molecules. 2020. PMID: 33287212 Free PMC article. Review.
-
Image-based profiling for drug discovery: due for a machine-learning upgrade?Nat Rev Drug Discov. 2021 Feb;20(2):145-159. doi: 10.1038/s41573-020-00117-w. Epub 2020 Dec 22. Nat Rev Drug Discov. 2021. PMID: 33353986 Free PMC article. Review.
References
-
- Moffat J. G., Vincent F., Lee J. A., Eder J., Prunotto M., Nat. Rev. Drug Discovery 2017, 16, 531. - PubMed
-
- Ziegler S., Pries V., Hedberg C., Waldmann H., Angew. Chem. Int. Ed. 2013, 52, 2744–2792; - PubMed
- Angew. Chem. 2013, 125, 2808–2859.
-
- Laraia L., Robke L., Waldmann H., Chem 2018, 4, 705–730.
-
- None
-
- Savitski M. M., Reinhard F. B. M., Franken H., Werner T., Savitski M. F., Eberhard D., Molina D. M., Jafari R., Dovega R. B., Klaeger S., Kuster B., Nordlund P., Bantscheff M., Drewes G., Science 2014, 346, 1255784; - PubMed
Publication types
MeSH terms
Substances
LinkOut - more resources
Full Text Sources
Other Literature Sources
Medical
