. 2019 Dec 24;58(51):5173-5187.
doi: 10.1021/acs.biochem.9b00960. Epub 2019 Dec 11.

Electron Paramagnetic Resonance Spectroscopic Identification of the Fe-S Clusters in the SPASM Domain-Containing Radical SAM Enzyme PqqE

Affiliations

Electron Paramagnetic Resonance Spectroscopic Identification of the Fe-S Clusters in the SPASM Domain-Containing Radical SAM Enzyme PqqE

Lizhi Tao et al. Biochemistry. .

Abstract

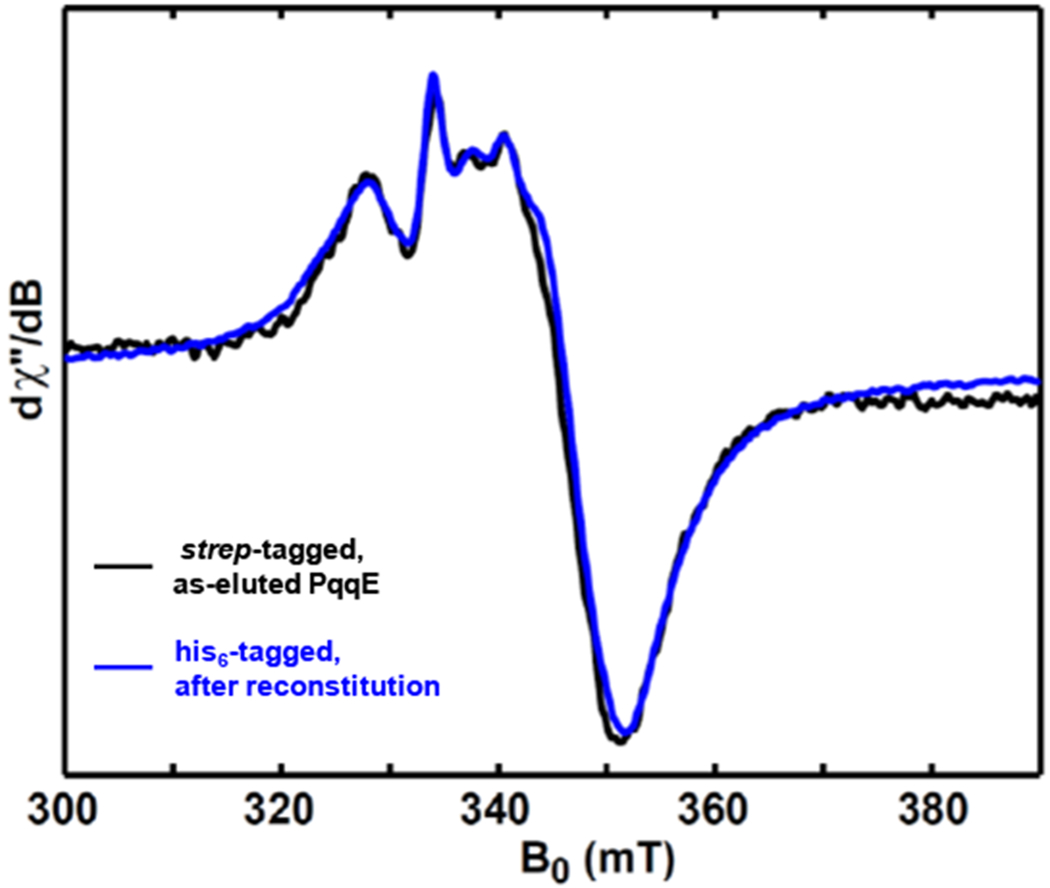
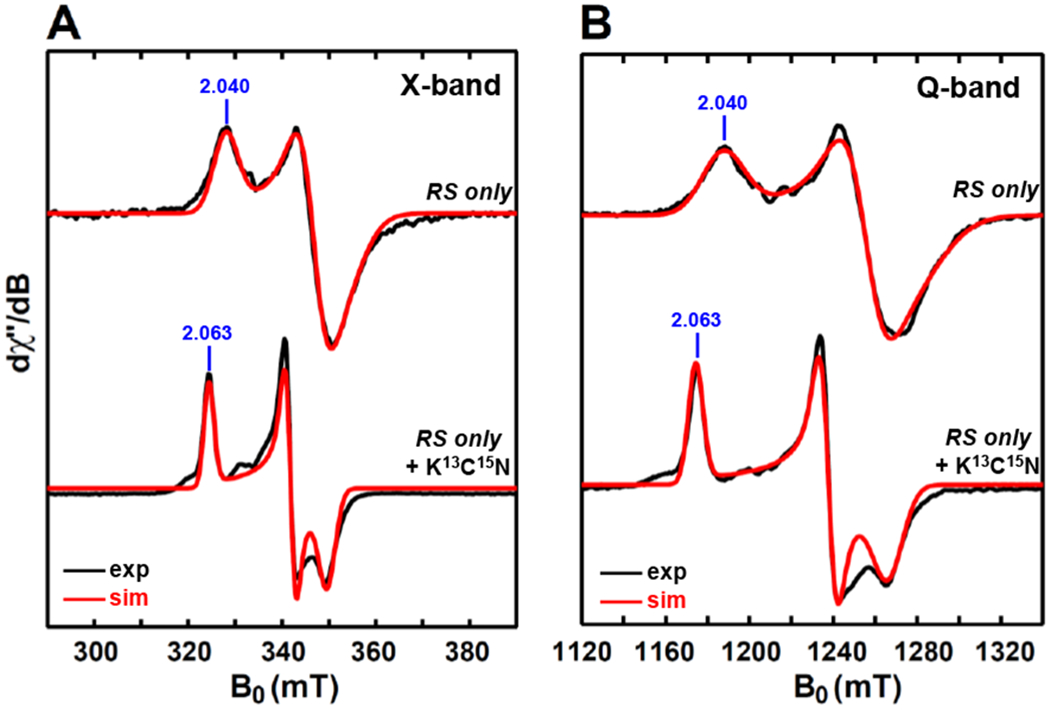
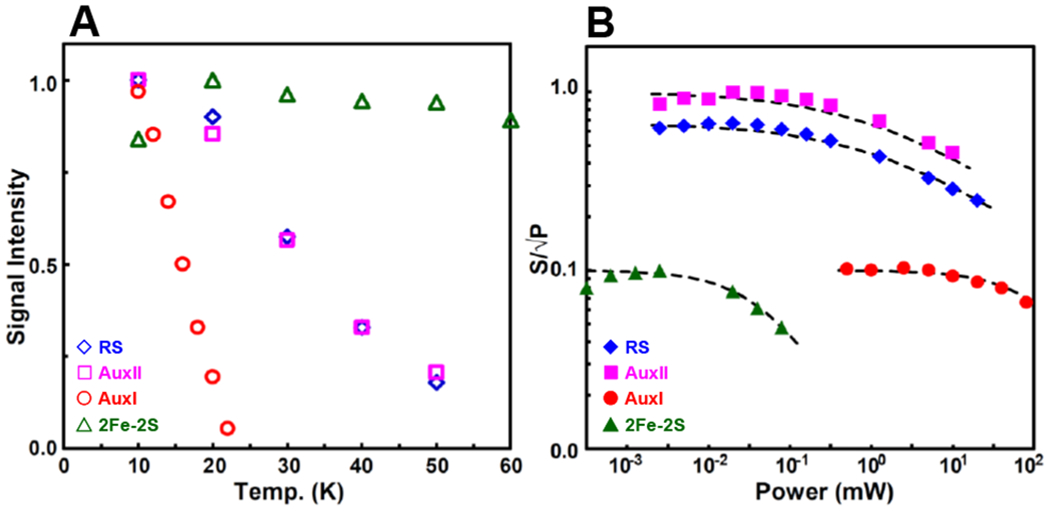
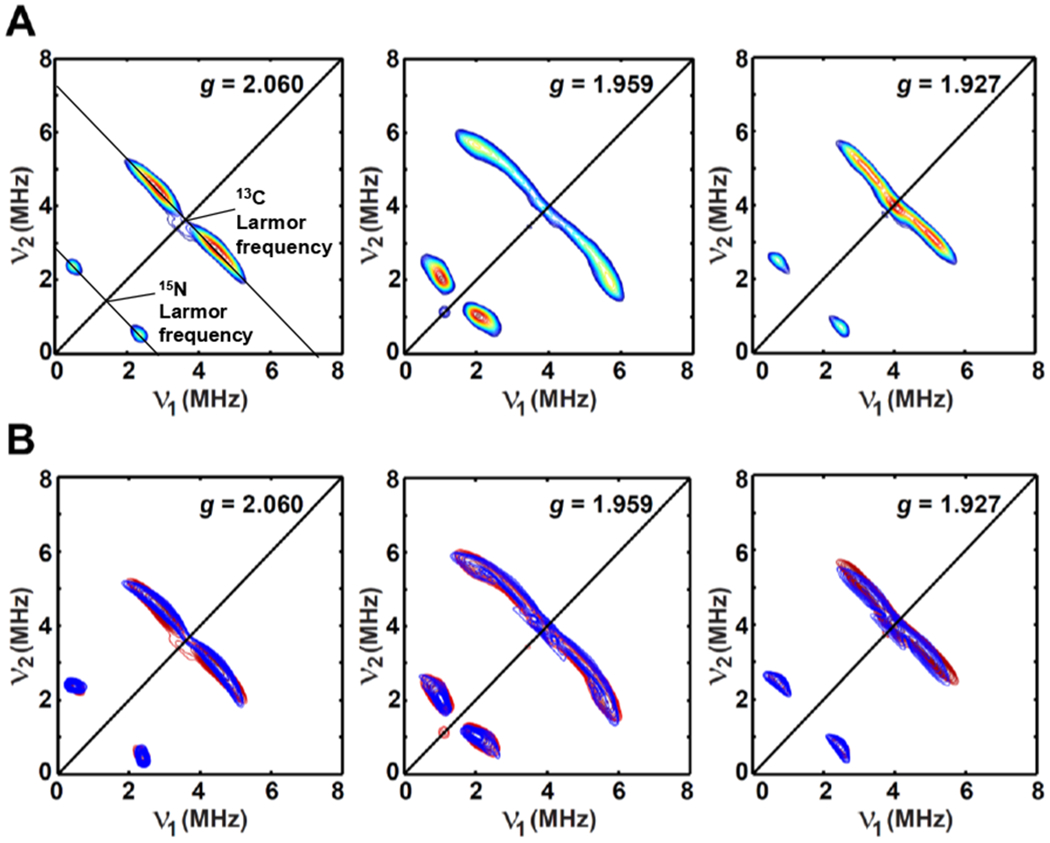
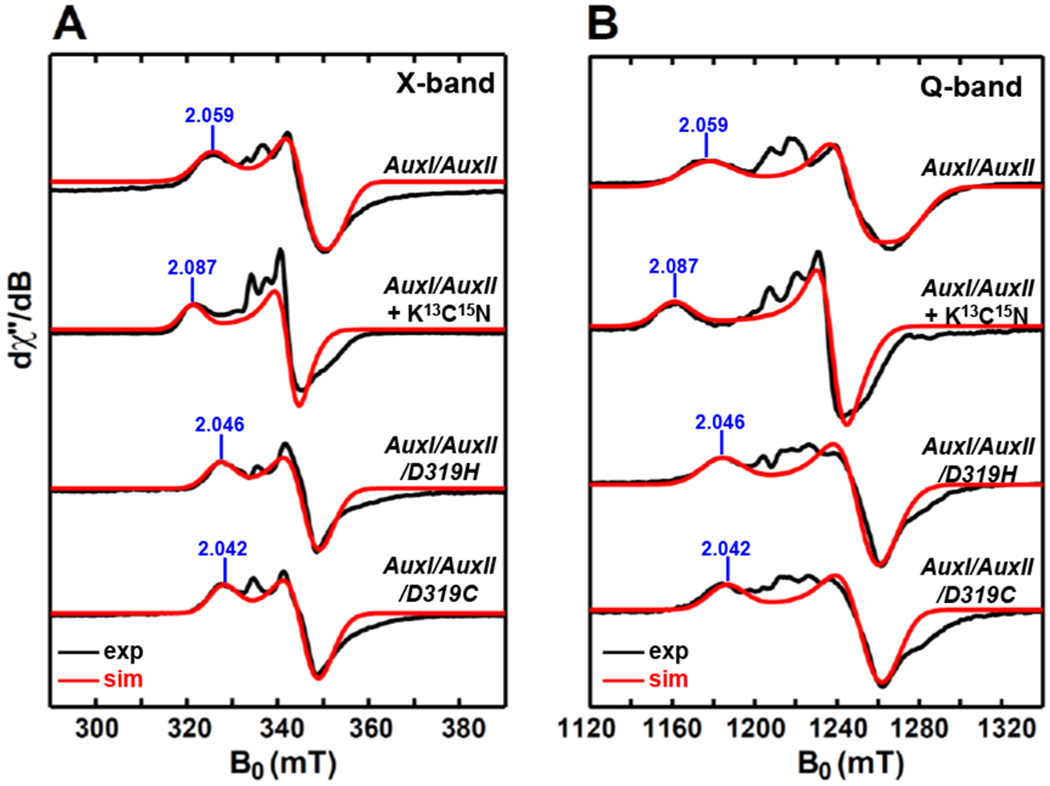
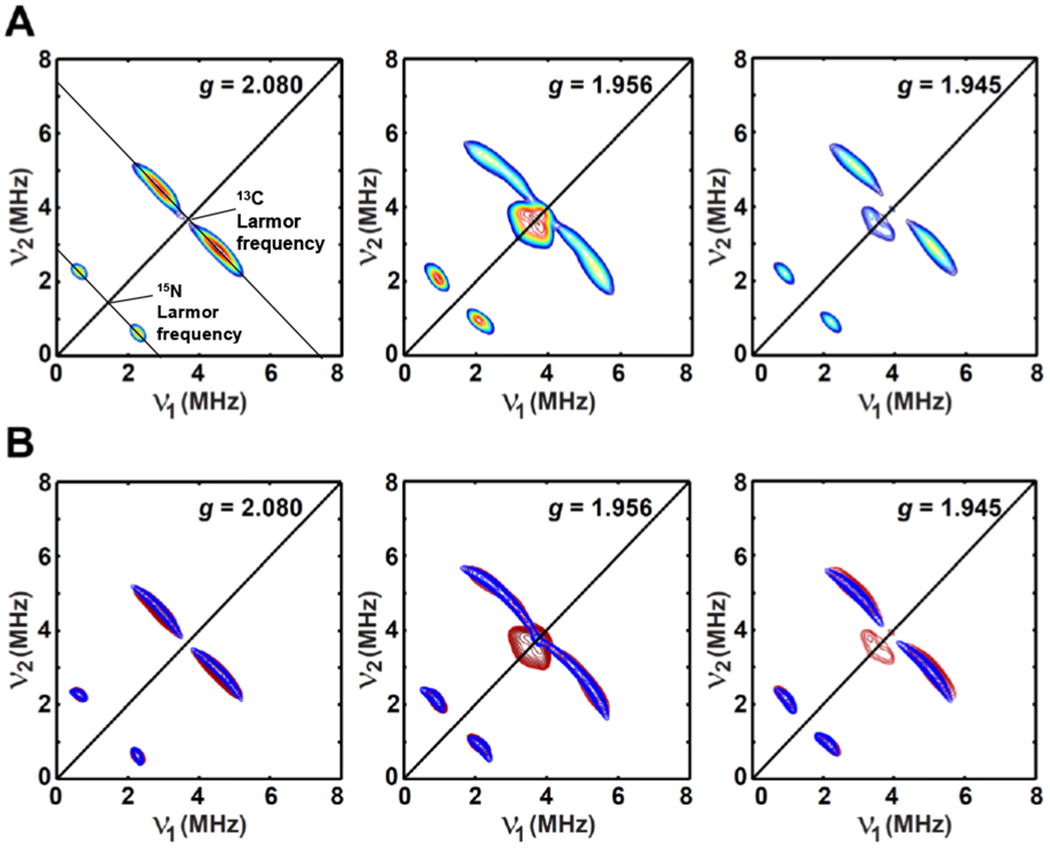
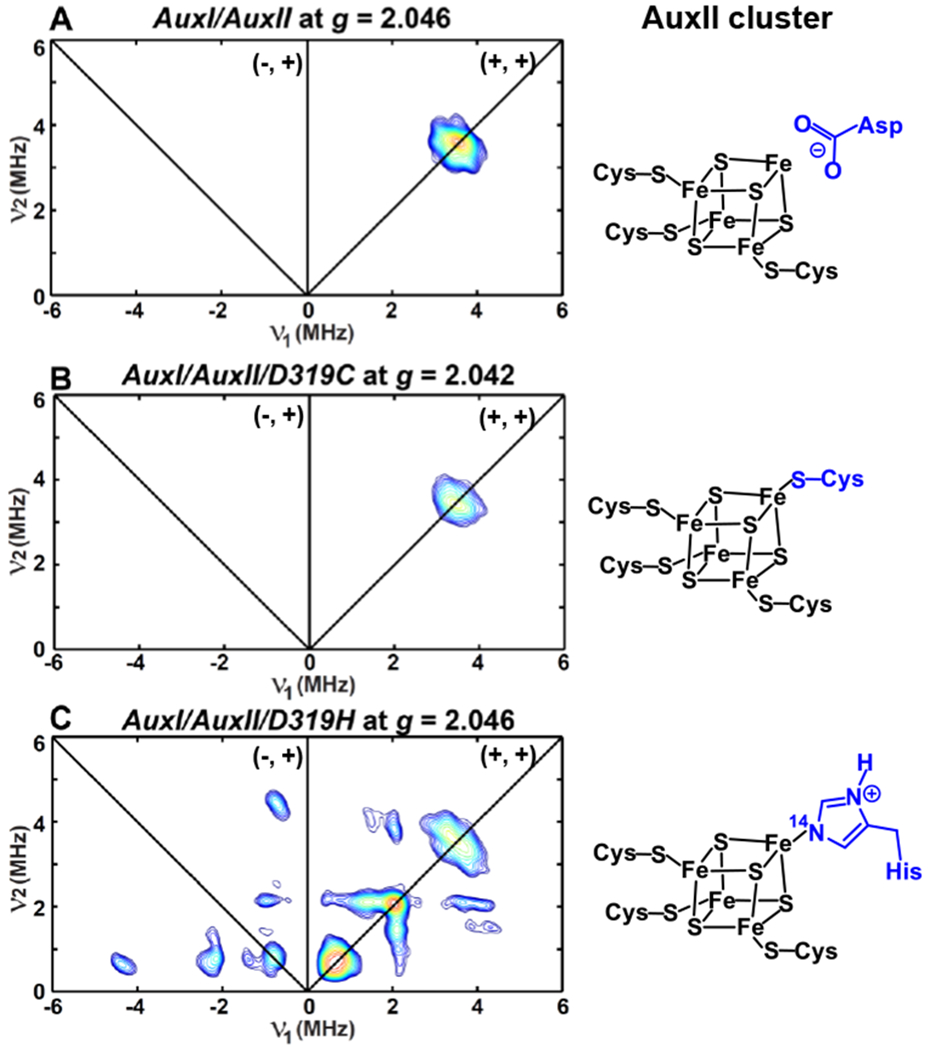
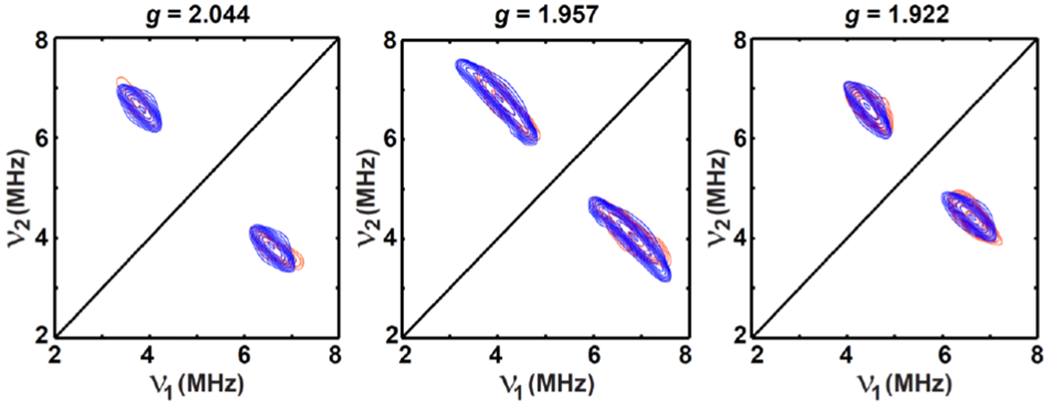
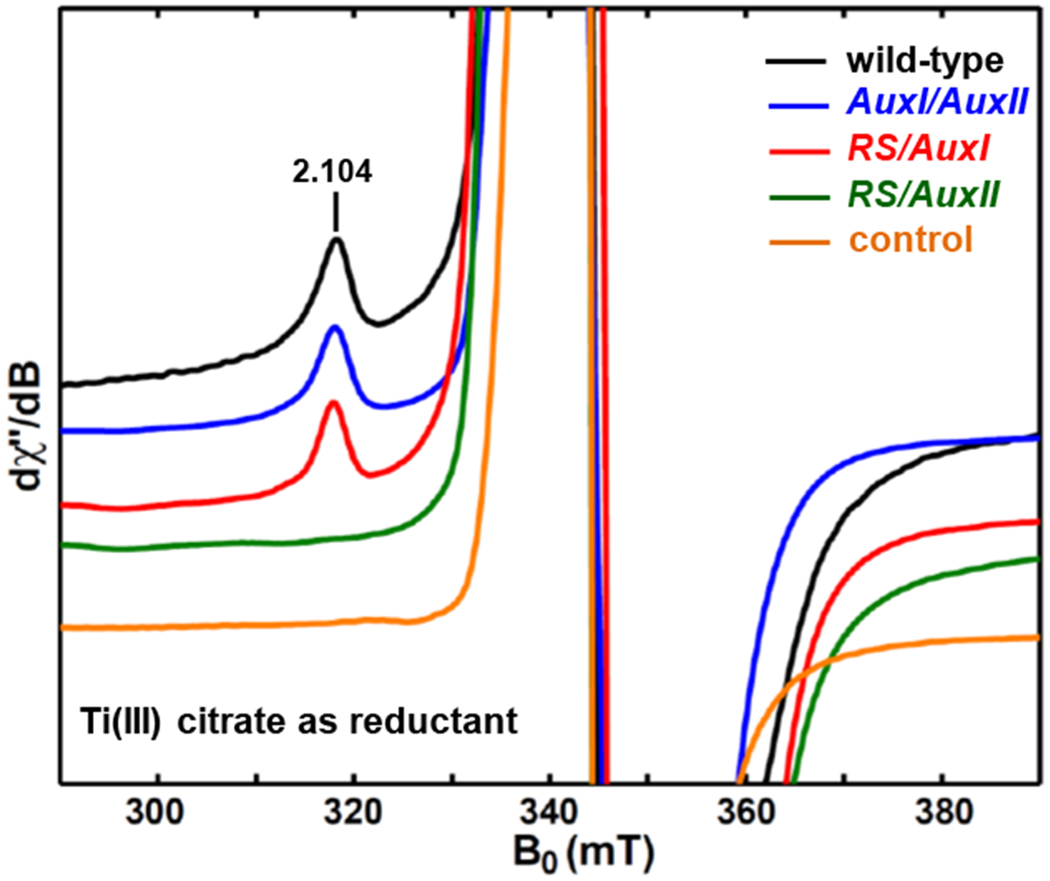
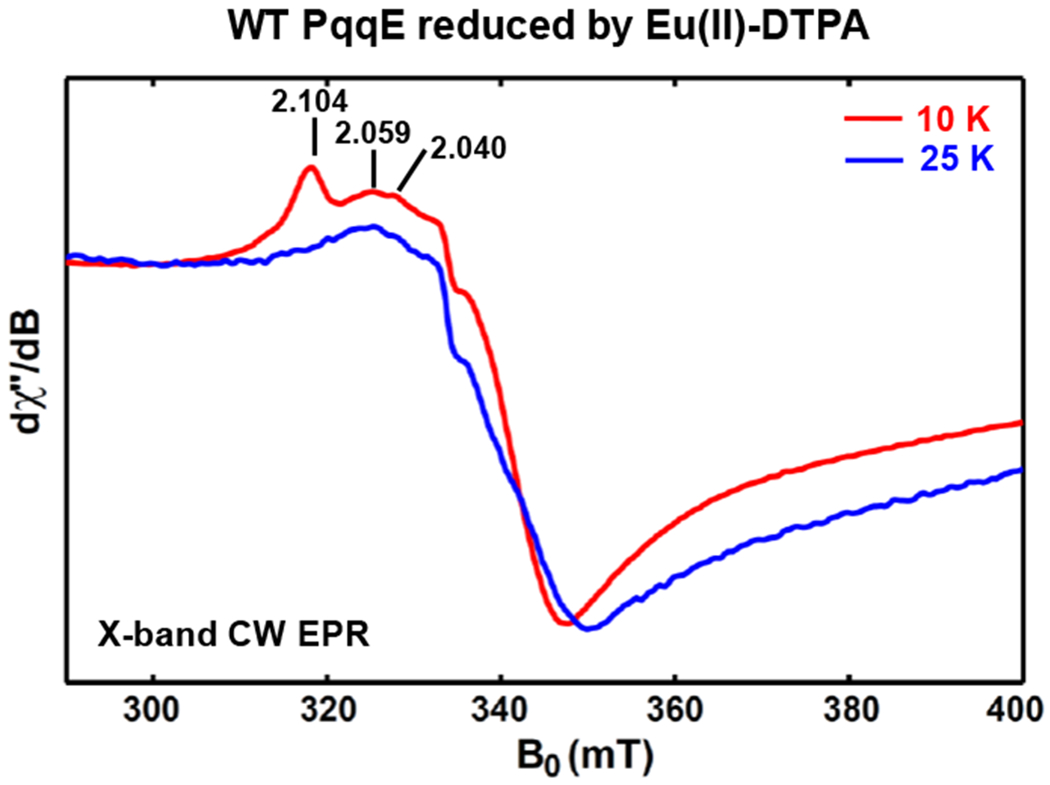
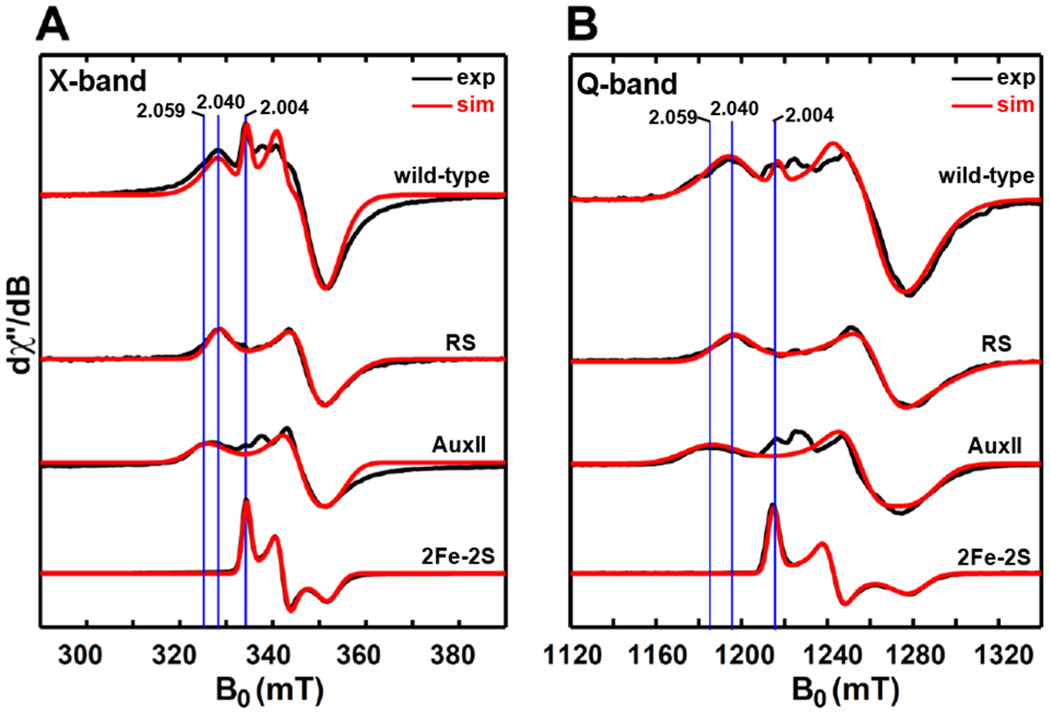
Pyrroloquinoline quinone (PQQ) is an important redox active quinocofactor produced by a wide variety of bacteria. A key step in PQQ biosynthesis is a carbon-carbon cross-link reaction between glutamate and tyrosine side chains within the ribosomally synthesized peptide substrate PqqA. This reaction is catalyzed by the radical SAM enzyme PqqE. Previous X-ray crystallographic and spectroscopic studies suggested that PqqE, like the other members of the SPASM domain family, contains two auxiliary Fe-S clusters (AuxI and AuxII) in addition to the radical SAM [4Fe-4S] cluster. However, a clear assignment of the electron paramagnetic resonance (EPR) signal of each Fe-S cluster was hindered by the isolation of a His6-tagged PqqE variant with an altered AuxI cluster. In this work, we are able to isolate soluble PqqE variants by using a less disruptive strep-tactin chromatographic approach. We have unambiguously identified the EPR signatures for four forms of Fe-S clusters present in PqqE through the use of multifrequency EPR spectroscopy: the RS [4Fe-4S] cluster, the AuxII [4Fe-4S] cluster, and two different clusters ([4Fe-4S] and [2Fe-2S]) bound in the AuxI site. The RS [4Fe-4S] cluster, the AuxII [4Fe-4S] cluster, and the [2Fe-2S] cluster form in the AuxI site can all be reduced by sodium dithionite, with g tensors of their reduced form determined as [2.040, 1.927, 1.897], [2.059, 1.940, 1.903], and [2.004, 1.958, 1.904], respectively. The AuxI [4Fe-4S] cluster that is determined on the basis of its relaxation profile can be reduced only by using low-potential reductants such as Ti(III) citrate or Eu(II)-DTPA to give rise to a g1 = 2.104 signal. Identification of the EPR signature for each cluster paves the way for further investigations of SPASM domain radical SAM enzymes.


Figures

Figure 1.
Figure 1.
Proposed PQQ biosynthesis pathway, with the carbon–carbon bond formation between glutamate and tyrosine side chains within the peptide PqqA shown in the scheme.
Figure 2.
Figure 2.
Comparison of X-band (9.37 GHz) CW EPR spectra of dithionite-reduced as-eluted strep-tagged wild-type PqqE (black trace) and the reconstituted His6-tagged wild-type PqqE (blue trace). The CW EPR spectra were recorded at 10 K, with 0.02 mW microwave power (shown to be non-saturating).
Figure 3.
Figure 3.
X-band (9.37 GHz) CW EPR (A) and Q-band (34.0 GHz) pseudo-modulated electron spin-echo detected field-swept EPR spectra (B) of the dithionite-reduced double-knockout PqqE variant of RS only as well the results from treatment with ≈100 equivalents of K13C15N. The black traces are experimental spectra, while the red traces are the simulated spectra by employing the g-values = [2.040, 1.927, 1.897] for dithionite-reduced RS-only variant and the g-values = [2.063, 1.957, 1.913] for the sample with the addition of K13C15N. The CW EPR spectra were recorded at 10 K, with 0.02 mW microwave power (shown to be non-saturating).The Q-band EPR spectra were recorded at 10 K by using a two-pulse sequence of π/2-τ-π-τ-echo, with π/2 = 12 ns and τ = 300 ns. The modulation amplitude of 3.0 mT was used to convert the absorption spectra to the pseudo-modulated spectra in (B).
Figure 4.
Figure 4.
Temperature dependence (A) and power dependence (B) of the EPR signals corresponding to the four Fe–S clusters that are investigated in this work. For the temperature dependence (A), the RS cluster (blue diamonds) signal intensities are taken from the varying peak amplitudes at the g1 2.040 position in the spectra of dithionite-reduced RS-only variant, shown in Figure S1. The AuxII cluster (magenta squares) signal intensities are taken from the peak amplitudes at the g1 2.059 position in the spectra of dithionite-reduced AuxI/AuxII, shown in Figure S2. The AuxI [4Fe–4S]+ cluster (red circles) signal intensities are taken from the peak amplitudes at the g1 2.104 position in the spectra of Ti(III) citrate-reduced WT sample, shown in Figure S10. The [2Fe–2S]+ cluster (green triangles) signal intensities are taken from the peak amplitudes at the g1 2.004 position in the spectra of dithionite-reduced RS/AuxI, shown in Figure S13. The power dependence experiment was conducted at 10 K (B). The signal intensity at varying microwave power divided by the square root of the microwave power is plotted vs power. Data points are fit to power saturation curves (dash lines) based on the equation of S/P(1+P/P1/2)0.5b by using P1/2 = 1.0 mW and b =1.22 for the RS cluster, P1/2 = 1.1 mW and b = 1.22 for the AuxII cluster, P1/2 = 100 mW and b = 1.22 for the AuxI [4Fe–4S]+ cluster and P1/2 = 0.04 mW and b = 1.34 for [2Fe–2S]+ cluster, where P1/2 is the half-saturation power and b is the “inhomogeneity parameter” varying from 1.0 for the inhomogeneous system to 2.0 for the homogeneous system.
Figure 5.
Figure 5.
Orientation-selected X-band HYSCORE spectra (A) of dithionite-reduced RS-only variant with the addition of ≈100 equivalents of K13C15N. The corresponding X-band and Q-band EPR spectra of this sample are given in Figure 3. (B) The simulated HYSCORE spectra are shown in blue (contour plot) by using the parameters of g = [2.063, 1.957, 1.913]; A(13C) = [−4.00, −4.70, 1.80] MHz, Euler angle = [0, 35, 0]°; A(15N) = [2.00, 0.45, 2.60] MHz, Euler angle = [0, 30, 0]°, while the experimental spectra are shown in red. Experimental parameters: temperature = 10 K; tπ/2 = 12 ns; tπ = 24 ns; microwave frequency = 9.188 GHz, magnetic field = 318.7 mT, τ = 148 ns for g = 2.060; microwave frequency = 9.455 GHz, magnetic field = 344.7 mT, τ = 136 ns for g = 1.959; microwave frequency = 9.455 GHz, magnetic field = 350.5 mT, τ = 136 ns for g = 1.927. The time increment in both dimensions was 24 ns with 180 steps.
Figure 6.
Figure 6.
X-band (9.37 GHz) CW EPR (A) and Q-band (34.0 GHz) pseudo-modulated electron spin-echo detected field-swept EPR spectra (B) of dithionite-reduced AuxI/AuxII, the sample with the addition of ≈100 equivalents of K13C15N, as well as dithionite-reduced AuxI/AuxII/D319H and AuxI/AuxII/D319C. The black traces are experimental spectra, while the red traces are the simulated spectra employing the g-values = [2.059, 1.940, 1.903] for dithionite-reduced AuxI/AuxII, the g-values = [2.087, 1.955, 1.941] for the AuxI/AuxII sample with the addition of K13C15N, the g-values = [2.046, 1.935, 1.922] for dithionite-reduced AuxI/AuxII/D319H and the g-values = [2.042, 1.938, 1.917] for dithionite-reduced AuxI/AuxII/D319C, respectively. The spectra for the AuxI/AuxII sample with the addition of K13C15N, as well as AuxI/AuxII/D319H and AuxI/AuxII/D319C are the residual spectra after subtracting the [2Fe–2S] cluster signals from the original spectra that are given in Figures S3&S4. The CW EPR spectra were recorded at 10 K, with 0.02 mW microwave power (no saturation). The Q-band EPR spectra were recorded at 10 K by using a two-pulse sequence of π/2-τ-π-τ-echo. with π/2 = 12 ns and τ = 300 ns. The modulation amplitude of 3.0 mT was used to convert the absorption spectra to the pseudo-modulated spectra in (B).
Figure 7.
Figure 7.
Orientation-selected X-band HYSCORE spectra (A) of dithionite-reduced AuxI/AuxII with the addition of ≈100 equivalents of K13C15N. The corresponding X-band and Q-band EPR spectra are given in Figure 6. (B) The simulated HYSCORE spectra are shown in blue (contour plot) by using the parameters of g = [2.087, 1.955, 1.941]; A(13C) = [−4.40, −4.40, 1.00] MHz, Euler angle = [0, 43, 0]°; A(15N) = [2.10, 2.10, 0.45] MHz, Euler angle = [0, 20, 0]°, while the experimental spectra are shown in red. Experimental parameters: temperature = 10 K; tπ/2 = 12 ns; tπ = 24 ns; microwave frequency = 9.482 GHz, magnetic field = 325.7 mT, τ = 144 ns for g = 2.080; microwave frequency = 9.308 GHz, magnetic field = 339.9 mT, τ = 136 ns for g = 1.956; microwave frequency = 9.484 GHz, magnetic field = 348.4 mT, τ = 136 ns for g = 1.945. The time increment in both dimensions was 24 ns with 180 steps.
Figure 8.
Figure 8.
X-band HYSCORE spectra of dithionite-reduced AuxI/AuxII (A), AuxI/AuxII/D319C (B) and AuxI/AuxII/D319H (C) acquired at the magnetic field position corresponding to the g-value of 2.046, 2.042 and 2.046, respectively. The X-band and Q-band EPR spectra of these three samples are given in Figure 6. The corresponding AuxII cluster present in each sample is also depicted in the figure. Experimental parameters: temperature = 10 K; tπ/2 = 12 ns; tπ = 24 ns; microwave frequency = 9.486 GHz, magnetic field = 331.2 mT, τ = 140 ns (A); microwave frequency = 9.187 GHz, magnetic field = 321.4 mT, τ = 144 ns (B); microwave frequency = 9.403 GHz, magnetic field = 328.4 mT, τ = 144 ns (C). The time increment in both dimensions is 24 ns with 180 steps.
Figure 9.
Figure 9.
Orientation-selected Q-band HYSCORE spectra of dithionite-reduced globally-15N-labled D319H. The experimental spectra (contour plot) are in red, while the simulated spectra are in blue by using the parameters of g = [2.046, 1.935, 1.922]; A(15N) = [−1.02, −4.55, −1.42] MHz, Euler angle = [55, 100, 25]°. Experimental parameters: temperature = 10 K; tπ/2 = 12 ns; tπ = 24 ns; microwave frequency = 34.161 GHz, magnetic field = 1194.4 mT, τ = 388 ns for g = 2.044; microwave frequency = 34.161 GHz, magnetic field = 1247.1 mT, τ = 372 ns for g = 1.957; microwave frequency = 34.161 GHz, magnetic field = 1269.8 mT, τ = 364 ns for g = 1.922. The time increment in both dimensions is 24 ns with 180 steps.
Figure 10.
Figure 10.
X-band (9.37 GHz) CW EPR spectra of Ti(III) citrate-reduced PqqE samples of wild-type (black trace), AuxI/AuxII (blue trace), RS/AuxI (red trace) and RS/AuxII (green trace). The control sample (orange trace) is Ti(III) citrate in HEPES-buffered solution. The CW EPR spectra were recorded at 10 K using 2.518 mW microwave power (no saturation). The full-scale spectra showing the Ti(III)-EPR signals dominant in the g ~ 2.0 region are given in Figure S6. The corresponding spectra of the dithionite-reduced samples of wild-type, AuxI/AuxII, RS/AuxI and RS/AuxII are presented in Figure 12, Figure 6 and Figure S9, respectively.
Figure 11.
Figure 11.
X-band (9.37 GHz) CW EPR spectra of Eu(II)-DTPA reduced wild-type PqqE after desalting. The red trace and blue trace is the spectrum recorded at 10 K and 25 K, respectively. The g1 value of 2.104, 2.059 and 2.040 is corresponding to the AuxI [4Fe–4S]+ cluster, the AuxII [4Fe–4S]+ cluster and the RS [4Fe–4S]+ cluster, respectively. The full spectra are shown in Figure S11.
Figure 12.
Figure 12.
X-band (9.38 GHz) CW EPR (A) and Q-band (34.0 GHz) pseudo-modulated electron spin-echo detected field-swept EPR spectra (B) of dithionite-reduced wild-type PqqE. The top black trace is experimental spectrum, while the top red trace is the simulated spectrum involving the contributions from three reduced clusters, i.e., the RS cluster with g = [2.040, 1.927, 1.897], the AuxII cluster with g = [2.059, 1.940, 1.903] and the [2Fe–2S]+ cluster with g = [2.004, 1.958, 1.904]. The ratio of these three clusters employed for the simulation is 1 : 1 : 1. The CW EPR spectra were recorded at 10 K, with 0.02 mW microwave power (no saturation). The Q-band EPR spectra were recorded at 10 K by using a two-pulse sequence of π/2-τ-π-τ-echo, with π/2 = 12 ns and τ = 300 ns. The modulation amplitude of 3.0 mT was used to convert the absorption spectra to the pseudo-modulated spectra in (B). The bottom three sets of spectra show the corresponding EPR signal for each cluster, with the RS cluster, the AuxII cluster and the [2Fe–2S]+ cluster signals obtained from dithionite-reduced samples of RS-only variant (Figure 3), AuxI/AuxII (Figure 6) and RS/AuxI (Figure S13).

References

    1. Duine JA (1999) The PQQ story, J. Biosci. Bioeng 88, 231–236. - PubMed
    1. Anthony C (2001) Pyrroloquinoline quinone (PQQ) and quinoprotein enzymes, Antioxid. Redox Signal 3, 757–774. - PubMed
    1. Goodwin PM, and Anthony C (1998) The biochemistry, physiology and genetics of PQQ and PQQ-containing enzymes, In Advances in Microbial Physiology (Poole RK, Ed.), pp 1–80, Academic Press. - PubMed
    1. Klinman JP, and Bonnot F (2014) Intrigues and intricacies of the biosynthetic pathways for the enzymatic quinocofactors: PQQ, TTQ, CTQ, TPQ, and LTQ, Chem. Rev 114, 4343–4365. - PMC - PubMed
    1. Sode K, Ito K, Witarto AB, Watanabe K, Yoshida H, and Postma P (1996) Increased production of recombinant pyrroloquinoline quinone (PQQ) glucose dehydrogenase by metabolically engineered Escherichia coli strain capable of PQQ biosynthesis, J. Biotechnol 49, 239–243. - PubMed

Publication types