. 2019 Nov 26;14(11):e0225582.
doi: 10.1371/journal.pone.0225582. eCollection 2019.

Clade F AAVHSCs cross the blood brain barrier and transduce the central nervous system in addition to peripheral tissues following intravenous administration in nonhuman primates

Affiliations

Clade F AAVHSCs cross the blood brain barrier and transduce the central nervous system in addition to peripheral tissues following intravenous administration in nonhuman primates

Jeff L Ellsworth et al. PLoS One. .

Abstract

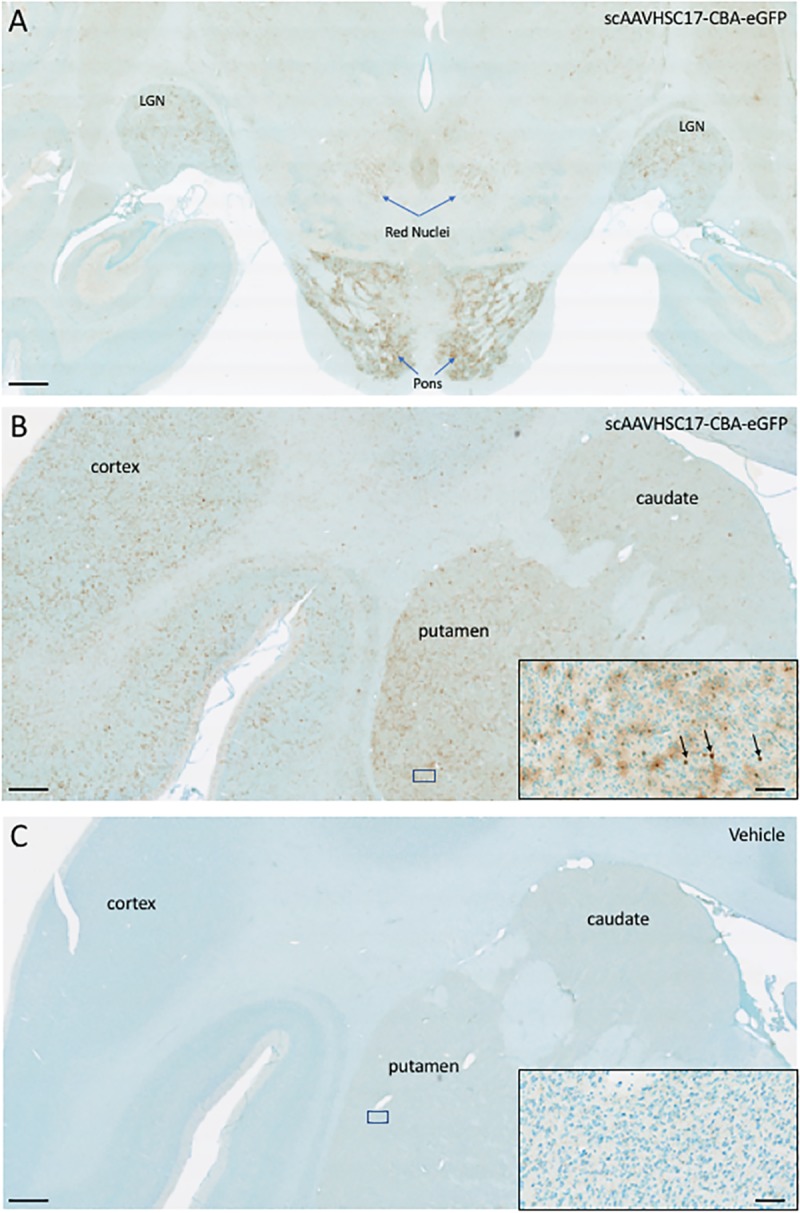
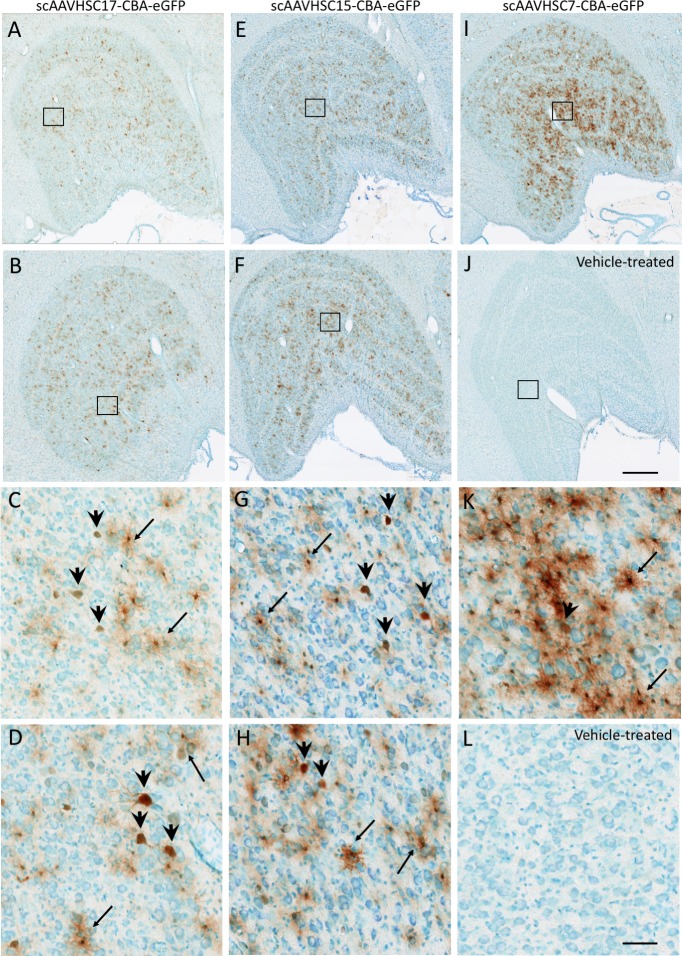
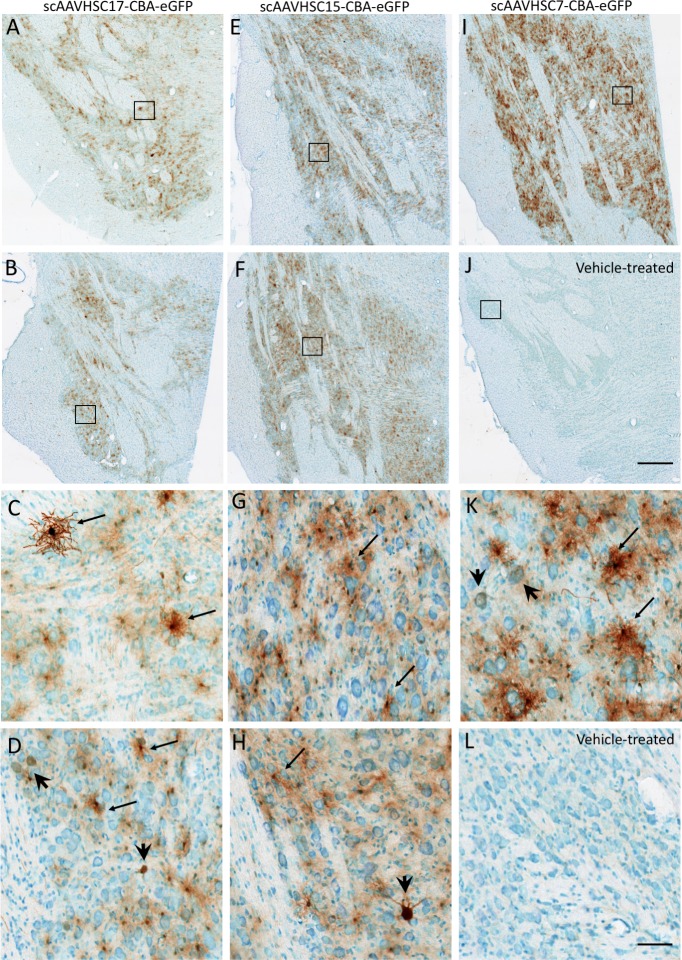
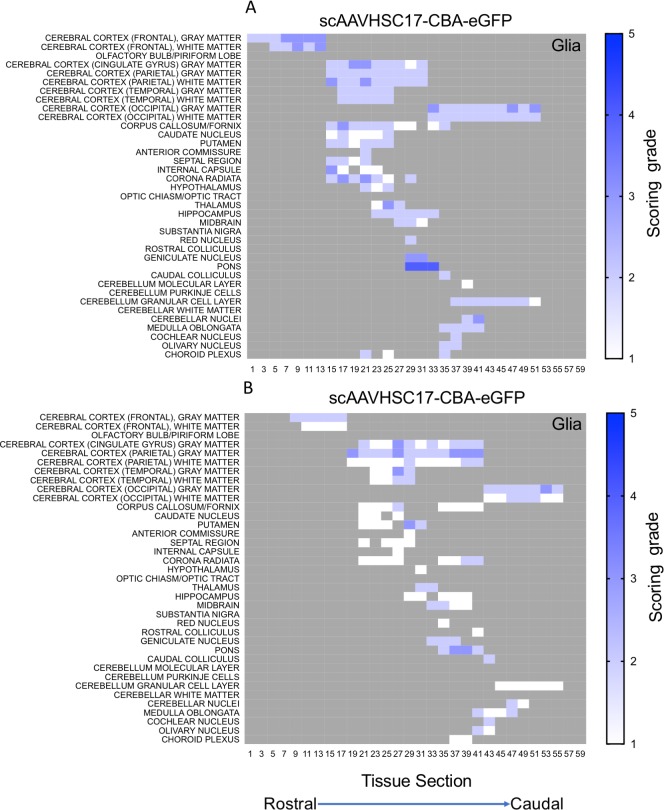
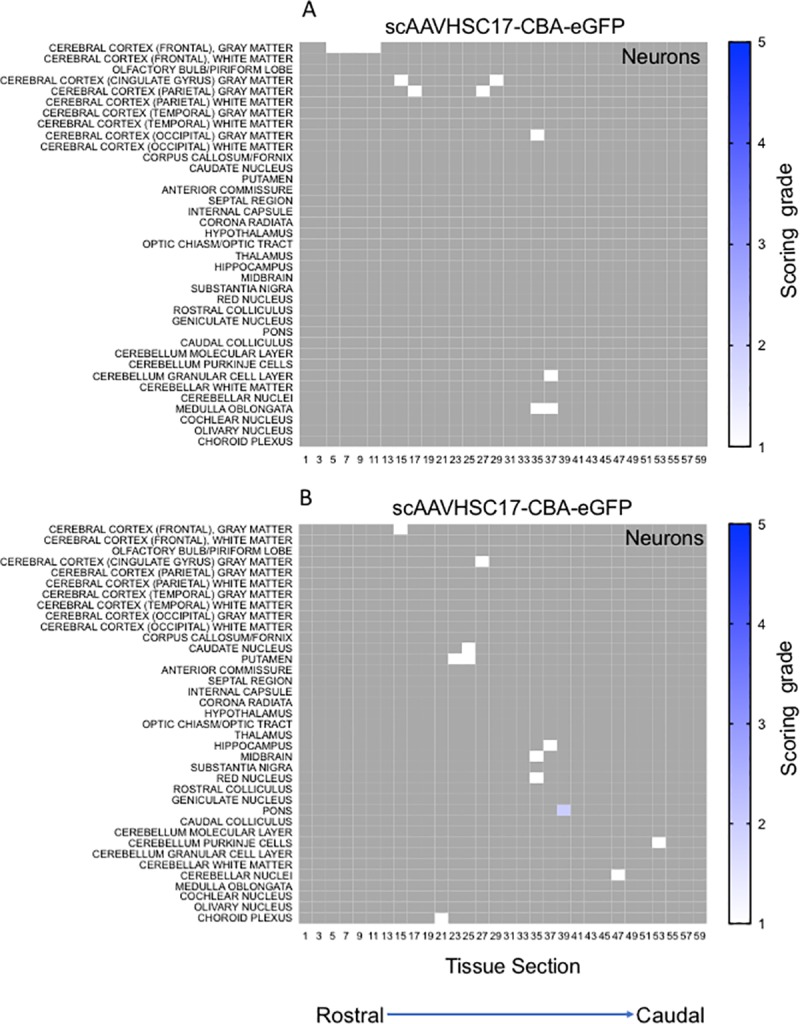
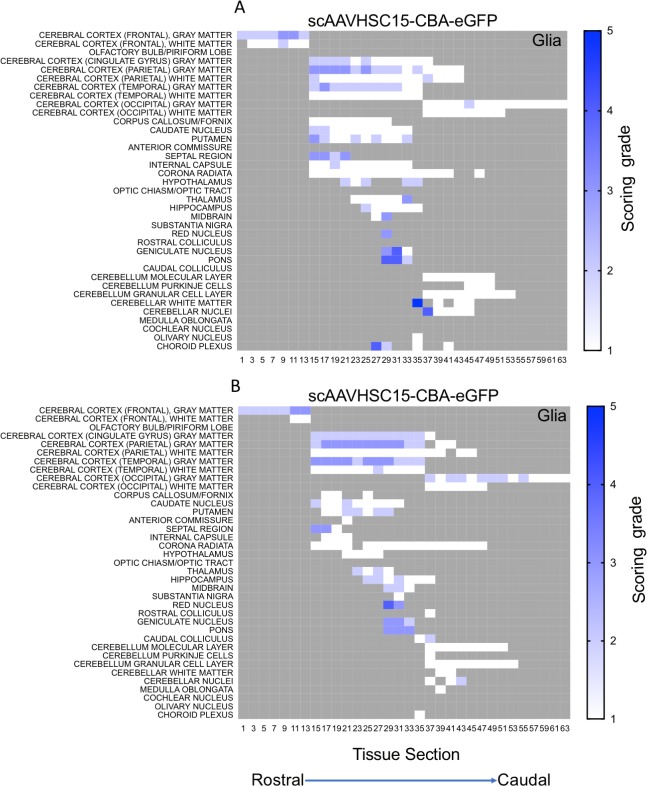
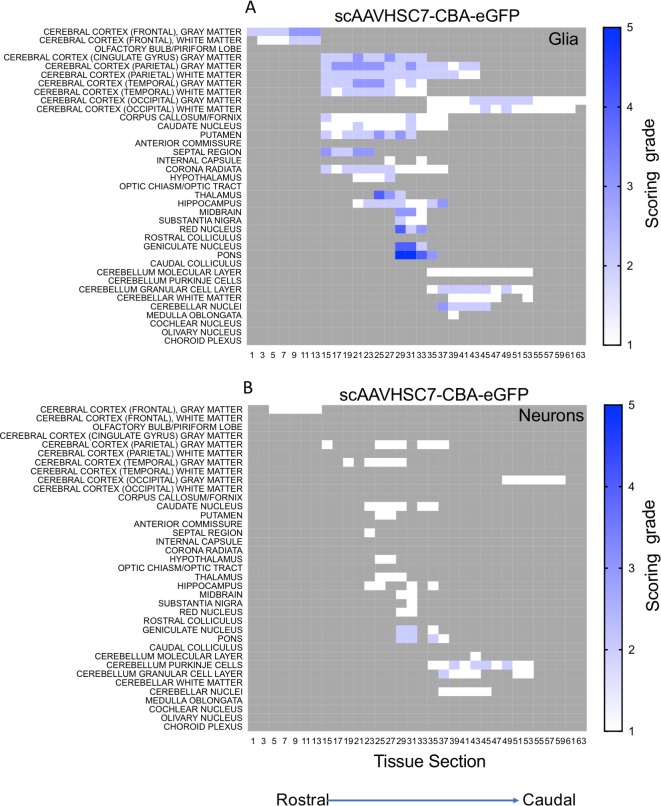
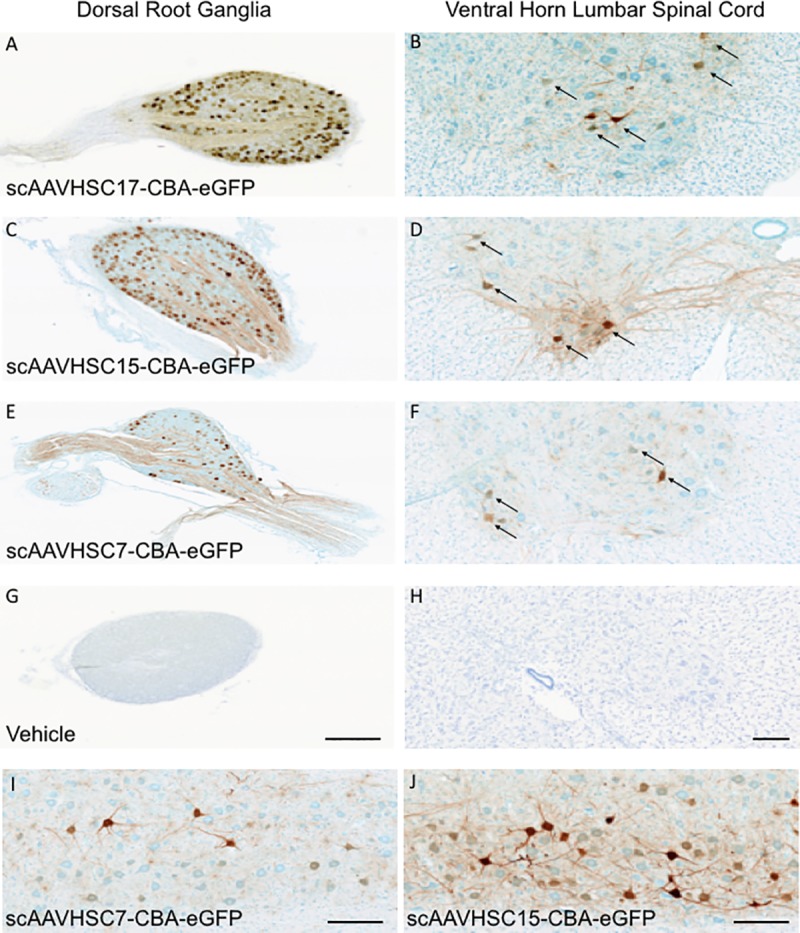
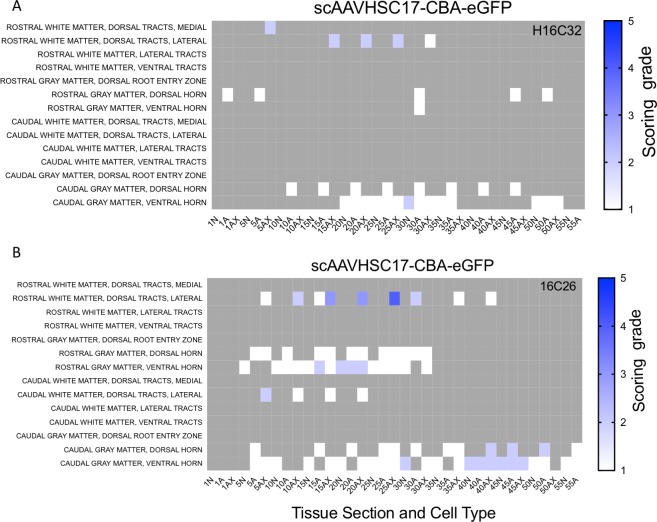
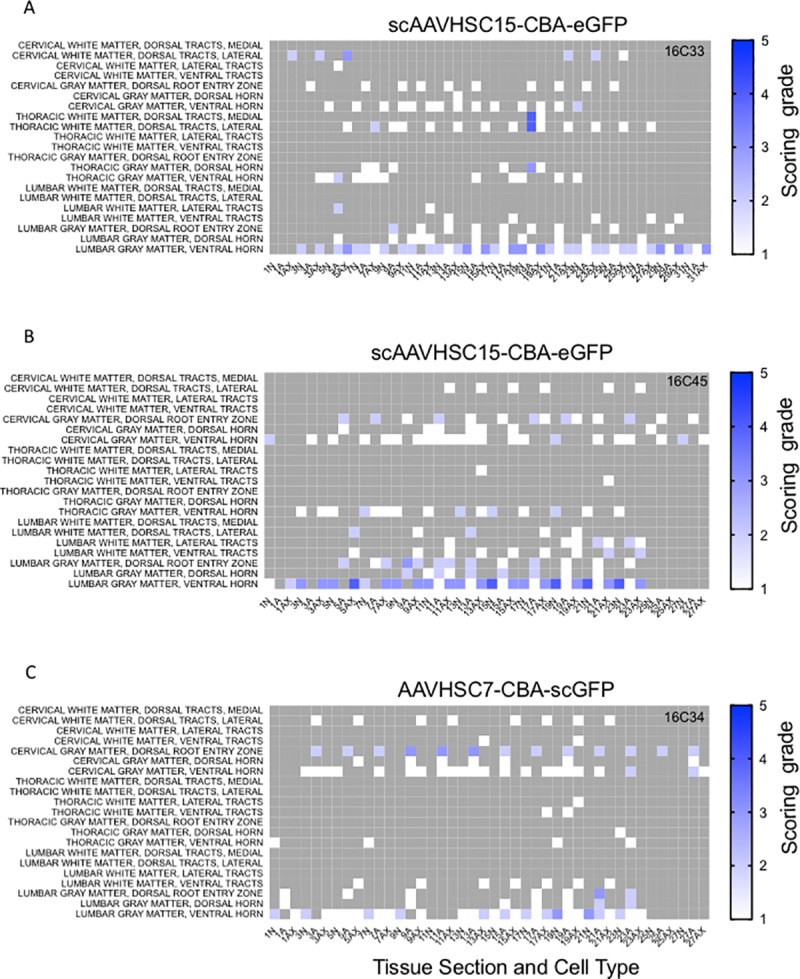
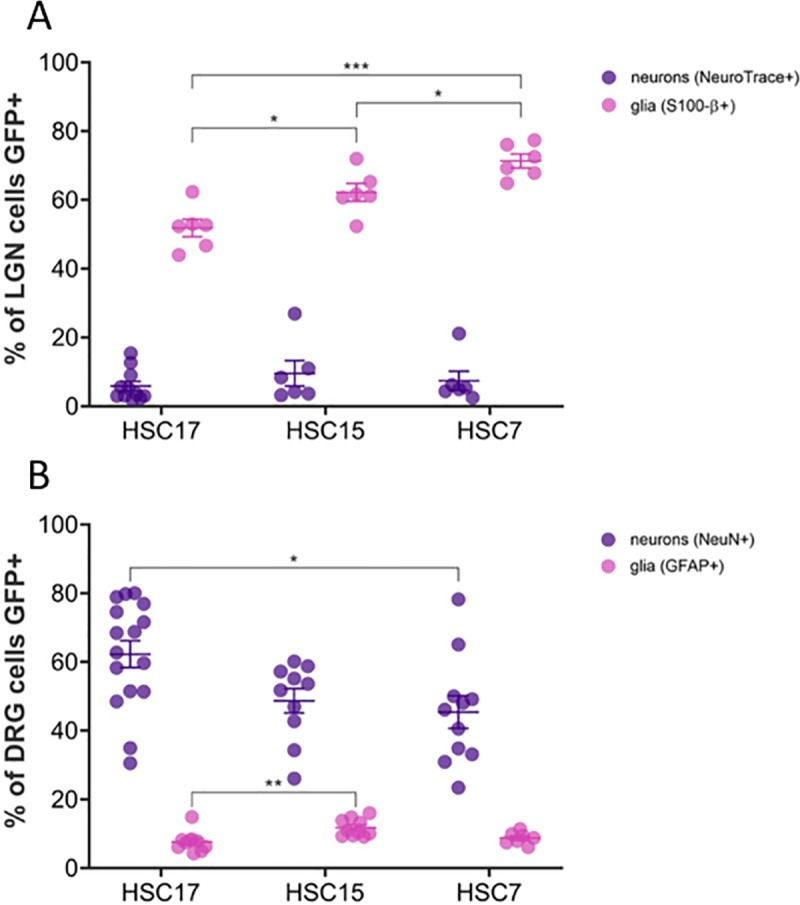
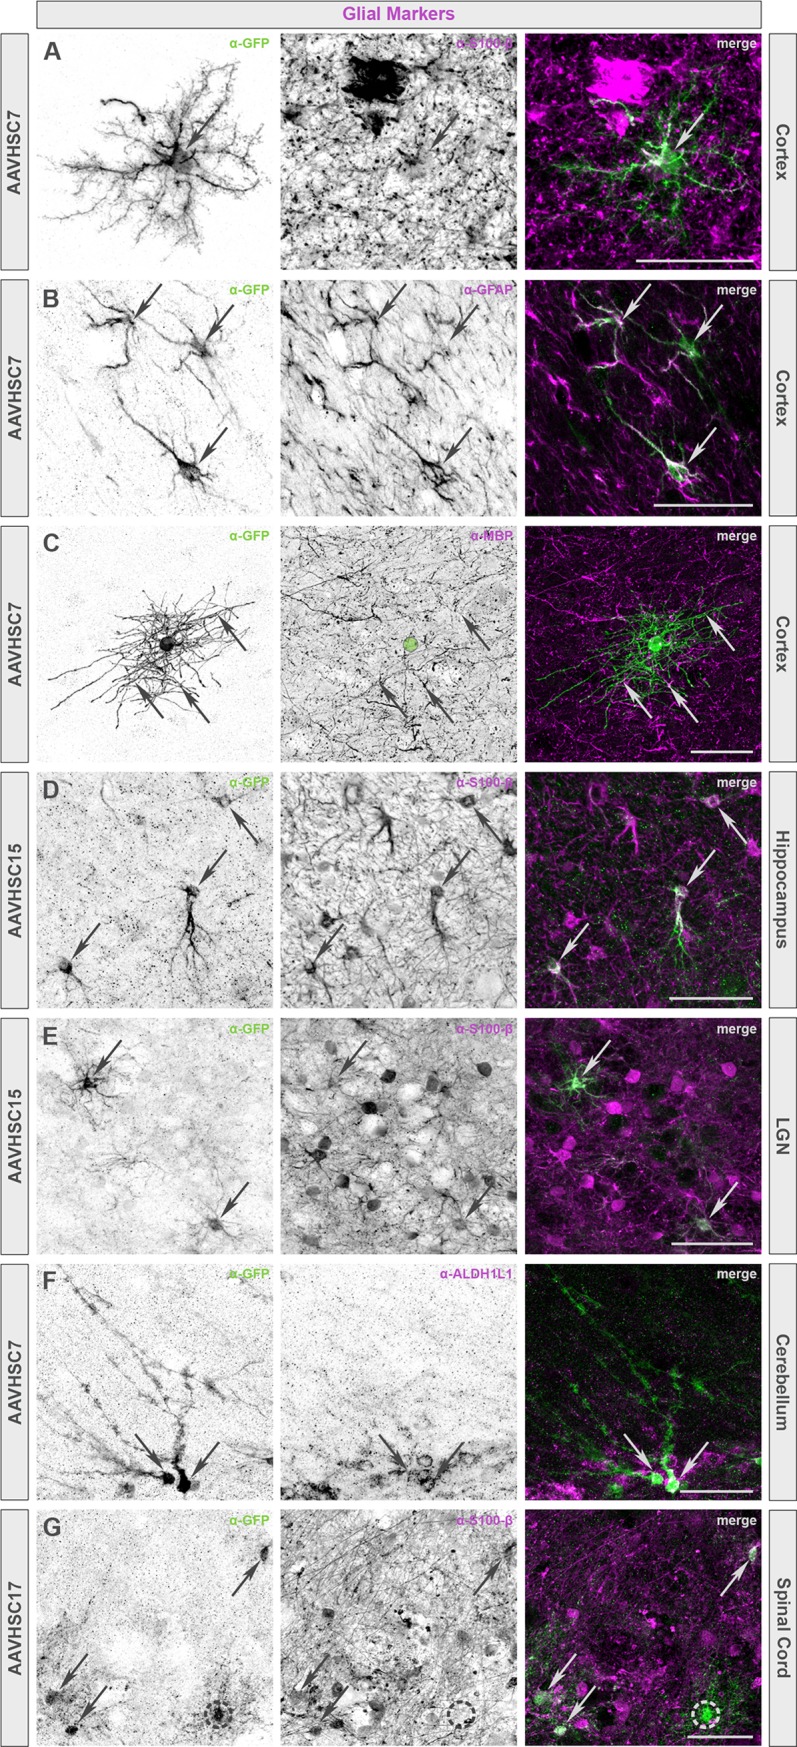
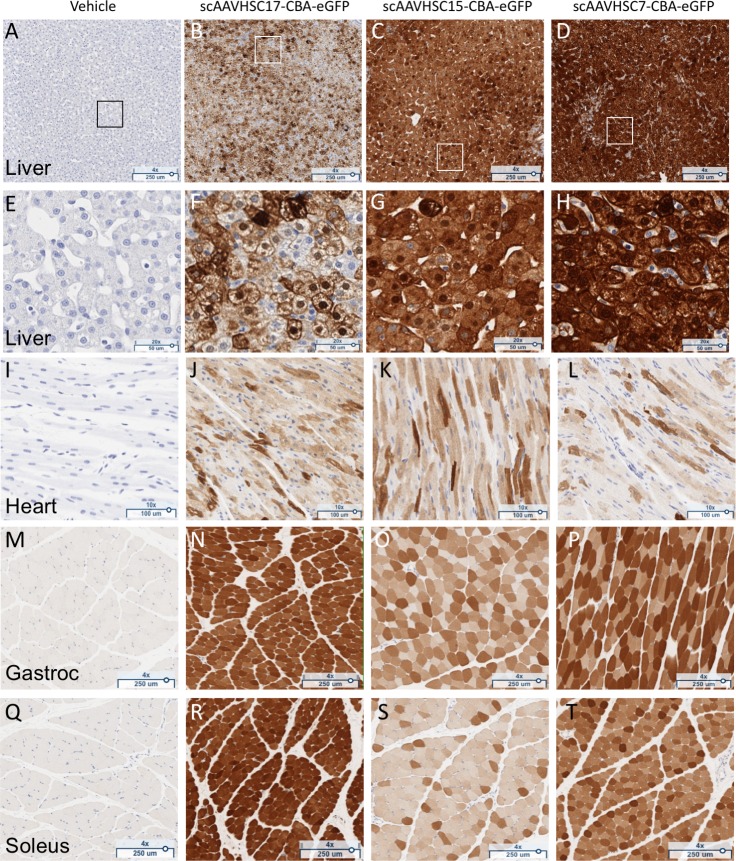
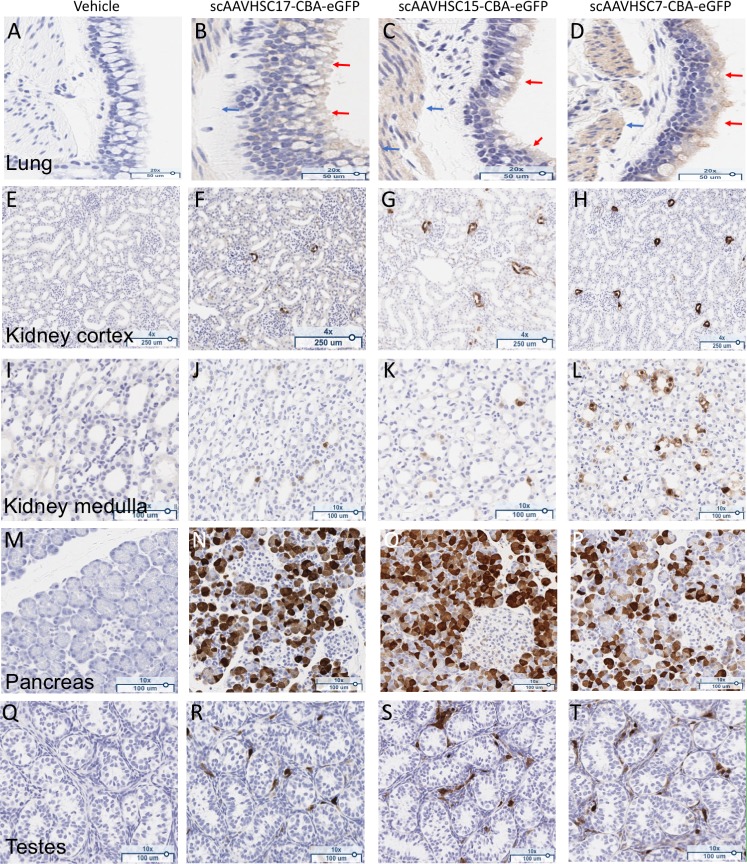
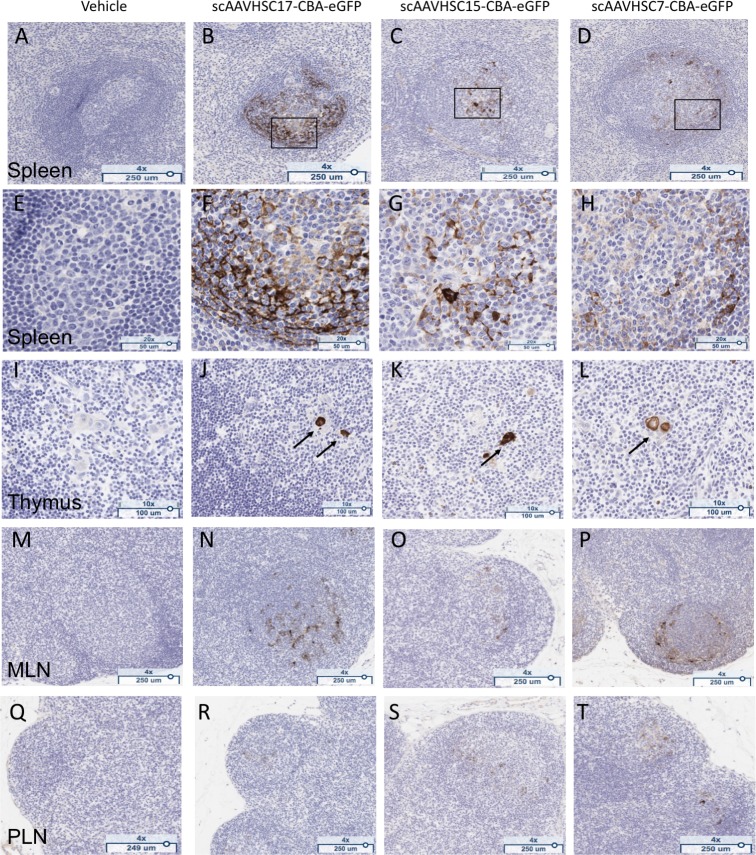
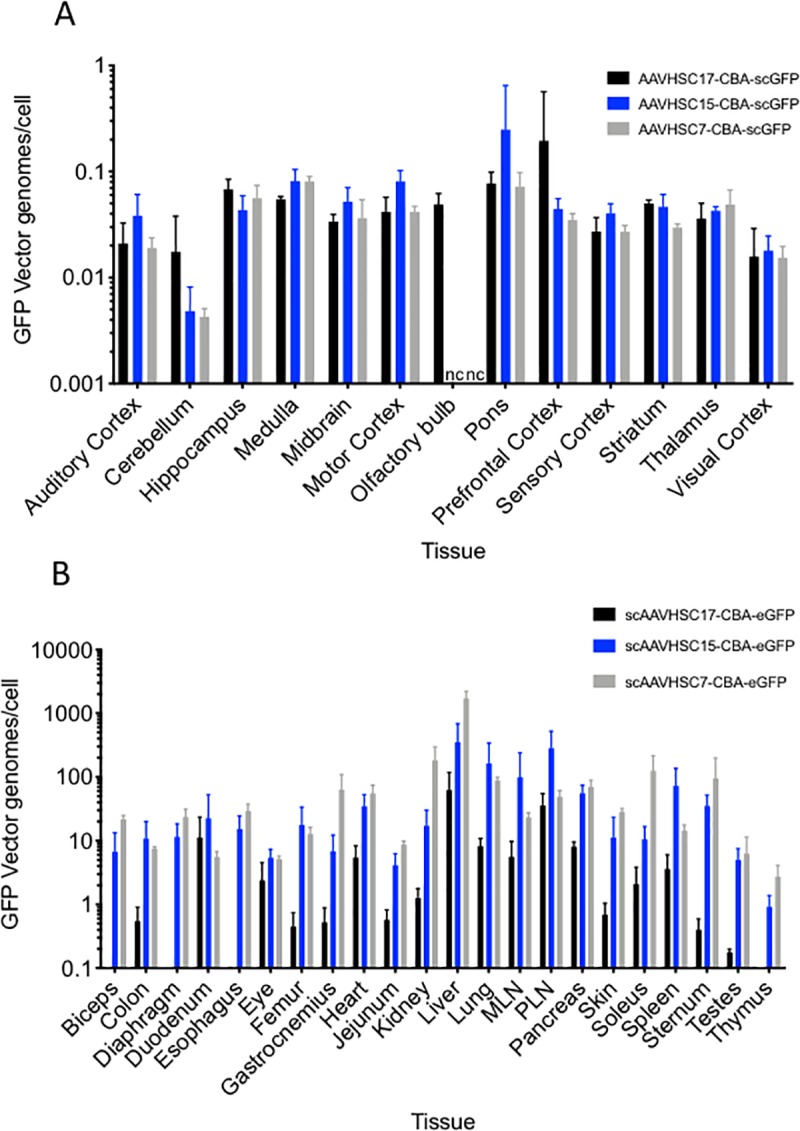
The biodistribution of AAVHSC7, AAVHSC15, and AAVHSC17 following systemic delivery was assessed in cynomolgus macaques (Macaca fascicularis). Animals received a single intravenous (IV) injection of a self-complementary AAVHSC-enhanced green fluorescent protein (eGFP) vector and tissues were harvested at two weeks post-dose for anti-eGFP immunohistochemistry and vector genome analyses. IV delivery of AAVHSC vectors produced widespread distribution of eGFP staining in glial cells throughout the central nervous system, with the highest levels seen in the pons and lateral geniculate nuclei (LGN). eGFP-positive neurons were also observed throughout the central and peripheral nervous systems for all three AAVHSC vectors including brain, spinal cord, and dorsal root ganglia (DRG) with staining evident in neuronal cell bodies, axons and dendritic arborizations. Co-labeling of sections from brain, spinal cord, and DRG with anti-eGFP antibodies and cell-specific markers confirmed eGFP-staining in neurons and glia, including protoplasmic and fibrous astrocytes and oligodendrocytes. For all capsids tested, 50 to 70% of glial cells (S100-β+) and on average 8% of neurons (NeuroTrace+) in the LGN were positive for eGFP expression. In the DRG, 45 to 62% of neurons and 8 to 12% of satellite cells were eGFP-positive for the capsids tested. eGFP staining was also observed in peripheral tissues with abundant staining in hepatocytes, skeletal- and cardio-myocytes and in acinar cells of the pancreas. Biodistribution of AAVHSC vector genomes in the central and peripheral organs generally correlated with eGFP staining and were highest in the liver for all AAVHSC vectors tested. These data demonstrate that AAVHSCs have broad tissue tropism and cross the blood-nerve and blood-brain-barriers following systemic delivery in nonhuman primates, making them suitable gene editing or gene transfer vectors for therapeutic application in human genetic diseases.


Conflict of interest statement

The authors have read the journal's policy and the authors [JLE, JG, LJS, HR, TAS, KP, NZ, KO, MO, AS] of this manuscript have the following competing interests: All authors are current or former employees of Homology Medicines, Inc. EC is an employee of Premier Laboratory, LLC and performed immunohistochemistry under contract with Homology Medicines, Inc. PM is an employee of The Mannheimer Foundation Inc. and performed in-life biodistribution studies in nonhuman primates under contract with Homology Medicines, Inc. The commercial affiliation between Homology Medicines, Inc. and Premier Laboratory LLC and between Homology Medicines, Inc., and the Mannheimer Foundation, Inc. does not alter our adherence to all PLOS ONE policies on sharing data and materials.

Figures

Fig 1
Fig 1. eGFP detection within multiple brain regions of Cynomolgus macaques following IV delivery of scAAVHSC17-CBA-eGFP.
(A and B) low power hindbrain and cortical/midbrain regions, respectively, of the two individual macaques (A: animal H16C32; B: animal 16C26) treated with IV scAAVHSC17-CBA-eGFP (1 x10¹⁴ vg/kg) on Day 0. (C): low power cortical/midbrain view of a macaque treated with IV vehicle alone (animal H16C14). Tissues were harvested two weeks post-dose and brains were sectioned and stained with an anti-eGFP antibody as described under Materials and methods. eGFP was visualized with diaminobenzidine staining (brown color). Location of the cortex, basal ganglia (caudate and putamen) pons, red nuclei and LGN and putamen are shown. Insets are higher magnification views of the boxed areas in each panel. Each bar represents 1000 μm or 50 μm in the insets.
Fig 2
Fig 2. Detection of eGFP expression with neurons and glia of the LGN of Cynomolgus macaques treated with IV scAAVHSC-CBA-eGFP.
(A-D) Each animal received an IV injection of scAAVHSC17-CBA-eGFP at 1.0 x10¹⁴ vg/kg (animals H16C32 and 16C26: A/C and B/D, respectively). (E-H) Each animal received an IV injection of scAAVHSC15-CBA-eGFP at 0.7 x10¹⁴ vg/kg (animals 16C33 and 16C45: E/G and F/H, respectively). (I and K) The animal received an IV injection of scAAVHSC7-CBA-eGFP [0.7 x10¹⁴ vg/kg, (animal 16C34)]. (J and L) The animal received an IV injection of an identical volume of vehicle alone (animal H16C14). Tissues were collected and stained for eGFP as described in the legend to Fig 1. Large and small arrows: neuronal and glial staining, respectively. Higher magnification views of the boxed areas in the upper panels are shown in the corresponding lower panels. The bar represents 500 μm (A, B, E, F, I, J) or 50 μm (C, D, G, H, K, L). Brown color represents eGFP staining.
Fig 3
Fig 3. Expression of eGFP within pontine neurons and glia of Cynomolgus macaques treated with an IV injection of scAAVHSC-CBA-eGFP.
(A-D) Each animal received an IV injection of scAAVHSC17-CBA-eGFP at 1.0 x 10¹⁴ vg/kg (animals H16C32 and 16C26: panels A/C and B/D, respectively). (E-H) Each animal received an IV injection of scAAVHSC15-CBA-eGFP at 0.7 x10¹⁴ vg/kg (animals 16C33 and 16C45: panels E/G and F/H, respectively). (I, K) The animal received an IV injection of scAAVHSC7-CBA-eGFP at 0.7 x10¹⁴ vg/kg (animal 16C34)]. (J, L) The animal received an IV injection of an equivalent volume of vehicle alone (animal H16C14). Tissues were collected and stained for eGFP as described in the legend to Fig 1. Large and small arrows: neuronal and glial staining, respectively. Higher magnification views of the boxed areas in the upper panels are shown in the corresponding lower panels. The scale bars represent 500 μm (A, B, E, F, I, J) or 50 μm (C, D, G, H, K, L). Brown color represents eGFP staining.
Fig 4
Fig 4. Heat maps of eGFP staining intensity within glia throughout the brain of Cynomolgus macaques treated with IV scAAVHSC17-CBA-eGFP.
(A) Glial staining in animal H16C32. (B) glial staining in animal 16C26. All sections were scored in a blinded manner as described under Materials and methods. The percent of cell type stained per structure on each slide was grade 1: <1%, grade 2: 1–5%, grade 3: 5–15%, grade 4: 15–40%, and grade 5: >40%. Grey areas represent those areas where either no brain structure was present or no eGFP staining was seen. The numbers below each heat map represent the coronal brain section from most rostral (slide 1) to most caudal (slide 59).
Fig 5
Fig 5. Heat maps of eGFP staining intensity within neurons throughout the brain of Cynomolgus macaques treated with IV scAAVHSC17-CBA-eGFP.
(A) Neuronal staining in animal H16C32. (B) Neuronal staining in animal 16C26. All sections were scored in a blinded manner as described under Materials and methods. The percent of cell type stained per structure on each slide was grade 1: <1%, grade 2: 1–5%, grade 3: 5–15%, grade 4: 15–40%, and grade 5: >40%. Grey areas represent those areas where either no brain structure was present or no eGFP staining was seen. The numbers below each heat map represent the coronal brain section from most rostral (slide 1) to most caudal (slide 59).
Fig 6
Fig 6. Heat maps of eGFP staining intensity within glia throughout the brain of Cynomolgus macaques treated with IV scAAVHSC15-CBA-eGFP.
(A) Glial eGFP staining in animal 16C33. (B) Glial staining in animal 16C45. All sections were scored in a blinded manner as described under Materials and methods. The percent of cell type stained per structure on each slide was grade 1: <1%, grade 2: 1–5%, grade 3: 5–15%, grade 4: 15–40%, and grade 5: >40%. Grey areas represent those areas where either no brain structure was present or no eGFP staining was seen. The numbers below each heat map represent the brain coronal section from most rostral (slide 1) to most caudal (slide 63).
Fig 7
Fig 7. Heat maps of eGFP staining intensity within neurons throughout the brain of Cynomolgus macaques treated with IV scAAVHSC15-CBA-eGFP.
(A) Neuronal eGFP staining in animal 16C33. (B) Neuronal staining in animal 16C45. All sections were scored in a blinded manner as described under Materials and methods. The percent of cell type stained per structure on each slide was grade 1: <1%, grade 2: 1–5%, grade 3: 5–15%, grade 4: 15–40%, and grade 5: >40%. Grey areas represent those areas where either no brain structure was present or no eGFP staining was seen. The numbers below each heat map represent the brain coronal section from most rostral (slide 1) to most caudal (slide 63).
Fig 8
Fig 8. Heat maps of eGFP staining intensity within glia and neurons throughout the brain of Cynomolgus macaques treated with IV scAAVHSC7-CBA-eGFP.
(A) Glial staining in animal 16C34. (B) Neuronal staining in animal 16C34. All sections were scored in a blinded manner as described under Materials and methods. The percent of cell type stained per structure on each slide was grade 1: <1%, grade 2: 1–5%, grade 3: 5–15%, grade 4: 15–40%, and grade 5: >40%. Grey areas represent those areas where either no brain structure was present or no eGFP staining was seen. The numbers below each heat map represent the brain coronal section from most rostral (slide 1) to most caudal (slide 63).
Fig 9
Fig 9. eGFP staining within the DRG and spinal cord in Cynomolgus macaques treated with IV scAAVHSC-CBA-eGFP.
(A,B) Animal treated with an IV dose of scAAVHSC17-CBA-eGFP at 1.0 x 10¹⁴ vg/kg. (C,D) Animal treated with an IV dose of scAAVHSC15-CBA-eGFP at 0.7 x 10¹⁴ vg/kg. (E,F) Animal treated with scAAVHSC7-CBA-eGFP at 0.7 x 10¹⁴ vg/kg. (G,H) Animal treated with an IV injection of vehicle alone. eGFP staining in lumbar DRG and cross-sections of lumbar spinal cords are shown in the left and right panels, respectively. The bar represents 500 μm (A, C, E and G) and 50 μm (B, D, F and H). (I) Longitudinal section of lumbar spinal cord from an animal treated with scAAVHSC7-CBA-eGFP. (J) Longitudinal section of lumbar spinal cord from an animal treated with scAAVHSC15-CBA-eGFP. The scale bars in I and J represent 250 μm. Arrows = motor neurons.
Fig 10
Fig 10. Heat maps of eGFP staining intensity within glia, neurons and neuronal axons in spinal cords of Cynomolgus macaques treated with IV scAAVHSC17-CBA-eGFP.
(A) Animal H16C32 received an IV injection of scAAVHSC17-CBA-eGFP. (B) Animal 16C26 was treated with an IV injection of scAAVHSC17-CBA-eGFP. Each animal was dosed at 1.0 x 10¹⁴ vg/kg. All sections were scored in a blinded manner as described under Materials and methods. Only the rostral and caudal portions of the spinal cords were available for analysis. The percent of cell type stained per structure on each slide was grade 1: <1%, grade 2: 1–5%, grade 3: 5–15%, grade 4: 15–40%, and grade 5: >40%. Grey areas represent those areas where either no cord structure was present or no eGFP staining was seen. The numbers below each heat map represent the spinal cord sections with N = neurons, Ax = axons and A = glia. Animal identifiers are in the upper right of each panel.
Fig 11
Fig 11. Heat maps of eGFP staining intensity within glia, neurons and neuronal axons in spinal cords of Cynomolgus macaques treated with IV scAAVHSC-CBA-eGFP.
(A) Animal 16C33 was treated with an IV injection of scAAVHSC15-CBA-eGFP. (B) Animal 16C45 received an IV injection of scAAVHSC15-CBA-eGFP. (C) Animal 16C34 was treated with an IV injection of scAAVHSC7-CBA-eGFP. All animals were dosed at 0.7 x 10¹⁴ vg/kg. All sections were scored in a blinded manner as described under Materials and methods. The percent of cell type stained per structure on each slide was grade 1: <1%, grade 2: 1–5%, grade 3: 5–15%, grade 4: 15–40%, and grade 5: >40%. Grey areas represent those areas where either no cord structure was present or no eGFP staining was seen. The numbers below each heat map represent the spinal cord sections with N = neurons, Ax = axons and A = glia. Animal identifiers are in the upper right of each panel.
Fig 12
Fig 12. Variation in the transduction efficiency of glia and neurons in the central and peripheral nervous systems.
(A) Quantitation of eGFP immunostaining in the LGN of the CNS [S100-β+ (glia); n = 6 sections of tissue from 1–2 animals/capsid; NeuroTrace+ (neurons); n = 6–11 sections of tissue from 1–2 animals/capsid]. (B) Quantitation of eGFP staining in the DRG of the PNS [GFAP+ (glia); n = 7–10 sections of tissue from 1–2 animals/capsid; (NeuN+ (neurons); n = 10–16 sections of tissue from 1–2 animals/capsid). For scAAVHSC7-CBA-eGFP, tissue from one animal was stained. Individual data points are shown along with mean ± SEM. *p < 0.05; **p < 0.005; ***p < 0.001; one-way ANOVA with Tukey’s multiple comparisons test. All glia counts were within 100 μm x 100 μm areas and DRG neuron counts were within 200 μm x 200 μm. For these, each data point represents the average of counts from 3 ROIs within a single image. For neuron counts in LGN, each data point represents counts from an entire single image (500 μm x 500 μm). HSC17 = scAAVHSC17-CBA-eGFP, HSC15 = scAAVHSC15-CBA-eGFP, HSC7 = scAAVHSC7-CBA-eGFP.
Fig 13
Fig 13. Colocalization of eGFP immunofluorescence with neuronal markers in multiple brain regions of nonhuman primates treated with an IV dose of scAAVHSC-CBA-eGFP.
(A, D, E) Animals received an intravenous dose of scAAVHSC15-CBA-eGFP. (B, C, F) Animals received an intravenous dose of scAAVHSC17-CBA-eGFP. (G) The animal received an intravenous dose of scAAVHSC7-CBA-eGFP. eGFP-positive cells exhibiting neuronal-like profiles co-labeled with the neuronal markers NeuN (A, B, D, F, G), neurofilament H (SMI-32) (C), or calbindin (E). In all panels, arrows indicate colocalization. Scale bars represent 50 μm.
Fig 14
Fig 14. Colocalization of eGFP immunofluorescence with glial markers in multiple brain regions of nonhuman primates treated with an IV dose of scAAVHSC-CBA-eGFP.
(A, B, C, F) Animals were dosed with scAAVHSC7-CBA-eGFP. (D, E) Animals were dosed with scAAVHSC15-CBA-eGFP. (G) The animal was dosed with scAAVHSC17-CBA-eGFP. Glial-like profiles of eGFP-positive cells included protoplasmic and fibrous astrocytes (A, B and D-G, respectively) as well as oligodendrocytes (C). The identity of cells with these profiles was confirmed with either myelin basic protein (MBP), a marker exclusively expressed by myelinating glia including oligodendrocytes (C) or astrocyte markers, including S100-β (A, D, E, G), glial fibrillary acidic protein (GFAP) (B), and ALDH1L1 (F). In all panels, arrows indicate colocalization. Green circle in C denotes the location of the oligodendrocyte cell body. Dashed circle in G marks an eGFP-positive cell with a glial-like profile that has no S100-β expression. Scale bars represent 50 μm.
Fig 15
Fig 15. eGFP staining in the retinas of Cynomolgus macaques following IV delivery of scAAVHSC-CBA-eGFP.
(A) Animals received an IV dose of vehicle alone. (B) The animal was treated with an IV dose of scAAVHSC17-CBA-eGFP. (C) The animal was treated with an IV dose of scAAVHSC15-CBA-eGFP. (D) The animal received an IV dose of scAAVHSC7-CBA-eGFP. Tissues were harvested two weeks post-dosing and processed for eGFP staining as described under Materials and methods. Brown color represents eGFP detection. Tissue sections were counterstained with thionine. PR = photoreceptor layer, ONL = outer nuclear layer, OPL = outer plexiform layer, INL = inner nuclear layer, IPL = inner plexiform layer, GCL = ganglion cell layer.
Fig 16
Fig 16. Widespread eGFP staining in peripheral tissues of nonhuman primates dosed with scAAVHSC-CBA-eGFP.
(A, E, I, M, Q) The animal received an IV dose of vehicle alone. (B, F, J, N, R) The animal received an IV dose of scAAVHSC17-CBA-eGFP. (C, G, K, O, S) The animal received an IV dose of scAAVHSC15-CBA-eGFP. (D, H, L, P, T) The animal received an IV dose of scAAVHSC7-CBA-eGFP. Tissues were harvested two weeks post-dose and were processed for eGFP staining as described under Materials and methods. Representative tissues shown are: liver (A-D) with higher magnification views of boxed areas shown in E-H; cardiac muscle (I-L), gastrocnemius muscle (M-P), and soleus muscle (Q-T). Brown staining represents eGFP staining.
Fig 17
Fig 17. eGFP staining in peripheral tissues of Cynomolgus macaques dosed with scAAVHSC-CBA-eGFP.
(A, E, I, M, Q) The animal received an IV dose of vehicle alone. (B, F, J, N, R) The animal received an IV dose of scAAVHSC17-CBA-eGFP. (C, G, K, O, S) The animal received an IV dose of scAAVHSC15-CBA-eGFP. (D, H, L, P, T) The animal received an IV dose of scAAVHSC7-CBA-eGFP. Tissues were processed for eGFP staining as described under Materials and methods. Representative tissues shown are: lung, large airway epithelium (A-D), kidney cortex (E-H); kidney medulla (I-L), pancreas (M-P), and testes (Q-T). Brown staining represents eGFP staining.
Fig 18
Fig 18. eGFP detection in lymphoid tissue of nonhuman primates treated with scAAVHSC-CBA-eGFP.
(A, E, I, M, Q) The animal received an IV dose of vehicle alone. (B, F, J, N, R) The animal received an IV dose of scAAVHSC17-CBA-eGFP. (C, G, K, O, S) The animal received an IV dose of scAAVHSC15-CBA-eGFP. (D, H, L, P, T) The animal received an IV dose of scAAVHSC7-CBA-eGFP. Tissues were isolated two weeks post-dose for eGFP staining as described under Materials and methods. White pulp splenic nodules are shown in A-D with higher magnification views of the boxed areas shown in F-H. eGFP staining in Hassall’s bodies (arrows) of the thymic medulla are shown in I-L, and eGFP staining within the germinal centers of mesenteric (MLN) and peripheral (PLN) lymph nodes are shown in M-P and Q-T, respectively. Brown staining represents eGFP staining. Representative tissues are shown.
Fig 19
Fig 19. Biodistribution of scAAVHSC-CBA-eGFP in the brain and peripheral organs of nonhuman primates.
(A) Levels of vector genomes in the brain of animals treated with an IV dose of scAAVHSC17-CBA-eGFP (black bars), scAAVHSC15-CBA-eGFP (blue bars) or scAAVHSC7-CBA-eGFP (grey bars). (B) Levels of vector genomes within peripheral tissues of animals treated with an IV dose of scAAVHSC17-CBA-eGFP (black bars), scAAVHSC15-CBA-eGFP (blue bars) or scAAVHSC7-CBA-eGFP (grey bars). Two weeks after dosing tissues were harvested and processed for GFP vector genome analyses as described under Materials and methods. The bars in panel A represent the mean ± SD of n = 2–12 pieces of tissue from each brain area of each animal with each assay performed in triplicate. The background level of eGFP vector genomes/cell measured across all brain areas in animals treated with vehicle was 0.009. The bars in panel B represent the mean ± SD of n = 6 tissue sections from each animal treated with scAAVHSC15-CBA-eGFP or scAAVHSC17-CBA-eGFP and n = 3 tissue sections from the animal treated with scAAVHSC7-CBA-eGFP. Eye samples were tissues sections taken through an intact fixed eye from each animal and retinal images are shown. Olfactory bulb samples were only collected from the animals treated with scAAVHSC17-CBA-eGFP and biceps, diaphragm, and esophageal tissues were only collected from animals treated with scAAVHSC15-CBA-eGFP and scAAVHSC7-CBA-eGFP. MLN = mesenteric lymph node, PLN = peripheral lymph node.

References

    1. Bainbridge JW, Mehat MS, Sundaram V, Robbie SJ, Barker SE, Ripamonti C, et al. Long-term effect of gene therapy on Leber's congenital amaurosis. N Engl J Med. 2015;372(20):1887–97. Epub 2015/05/06. 10.1056/NEJMoa1414221 - DOI - PMC - PubMed
    1. Edwards TL, Jolly JK, Groppe M, Barnard AR, Cottriall CL, Tolmachova T, et al. Visual Acuity after Retinal Gene Therapy for Choroideremia. N Engl J Med. 2016;374(20):1996–8. Epub 2016/04/28. 10.1056/NEJMc1509501 - DOI - PMC - PubMed
    1. George LA, Sullivan SK, Giermasz A, Rasko JEJ, Samelson-Jones BJ, Ducore J, et al. Hemophilia B Gene Therapy with a High-Specific-Activity Factor IX Variant. N Engl J Med. 2017;377(23):2215–27. Epub 2017/12/07. 10.1056/NEJMoa1708538 - DOI - PMC - PubMed
    1. Maguire AM, Simonelli F, Pierce EA, Pugh EN Jr., Mingozzi F, Bennicelli J, et al. Safety and efficacy of gene transfer for Leber's congenital amaurosis. N Engl J Med. 2008;358(21):2240–8. Epub 2008/04/29. 10.1056/NEJMoa0802315 - DOI - PMC - PubMed
    1. Mendell JR, Al-Zaidy S, Shell R, Arnold WD, Rodino-Klapac LR, Prior TW, et al. Single-Dose Gene-Replacement Therapy for Spinal Muscular Atrophy. N Engl J Med. 2017;377(18):1713–22. Epub 2017/11/02. 10.1056/NEJMoa1706198 . - DOI - PubMed

Substances