Design principles of selective transport through biopolymer barriers
- PMID: 31770897
- PMCID: PMC7502277
- DOI: 10.1103/PhysRevE.100.042414
Design principles of selective transport through biopolymer barriers
Abstract
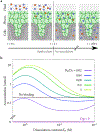
In biological systems, polymeric materials block the movement of some macromolecules while allowing the selective passage of others. In some cases, binding enables selective transport, while in others the most inert particles appear to transit most rapidly. To study the general principles of filtering, we develop a model motivated by features of the nuclear pore complex (NPC) which are highly conserved and could potentially be applied to other biological systems. The NPC allows selective transport of proteins called transport factors, which transiently bind to disordered flexible proteins called phenylalanine-glycine-nucleoporins. While the NPC is tuned for transport factors and their cargo, we show that a single feature is sufficient for selective transport: the bound-state motion resulting from transient binding to flexible filaments. Interchain transfer without unbinding can further improve selectivity, especially for cross-linked chains. We generalize this observation to model nanoparticle transport through mucus and show that bound-state motion accelerates transport of transient nanoparticle application, even with clearance by mucus flow. Our model provides a framework to control binding-induced selective transport in biopolymeric materials.
Figures


Similar articles
-
Stochastically gated diffusion model of selective nuclear transport.Phys Rev E. 2020 Apr;101(4-1):042404. doi: 10.1103/PhysRevE.101.042404. Phys Rev E. 2020. PMID: 32422829
-
Emergence of selectivity and specificity in a coarse-grained model of the nuclear pore complex with sequence-agnostic FG-Nups.Phys Chem Chem Phys. 2023 Dec 13;25(48):32824-32836. doi: 10.1039/d3cp03746k. Phys Chem Chem Phys. 2023. PMID: 38018404
-
Nucleoporins' exclusive amino acid sequence features regulate their transient interaction with and selectivity of cargo complexes in the nuclear pore.Mol Biol Cell. 2021 Nov 1;32(21):ar31. doi: 10.1091/mbc.E21-04-0161. Epub 2021 Sep 2. Mol Biol Cell. 2021. PMID: 34473567 Free PMC article.
-
The Part and the Whole: functions of nucleoporins in nucleocytoplasmic transport.Trends Cell Biol. 2010 Aug;20(8):461-9. doi: 10.1016/j.tcb.2010.05.001. Epub 2010 Jun 4. Trends Cell Biol. 2010. PMID: 20627572 Review.
-
The selective permeability barrier in the nuclear pore complex.Nucleus. 2016 Sep 2;7(5):430-446. doi: 10.1080/19491034.2016.1238997. Epub 2016 Sep 27. Nucleus. 2016. PMID: 27673359 Free PMC article. Review.
Cited by
-
Bound-State Diffusion due to Binding to Flexible Polymers in a Selective Biofilter.Biophys J. 2020 Jan 21;118(2):376-385. doi: 10.1016/j.bpj.2019.11.026. Epub 2019 Nov 26. Biophys J. 2020. PMID: 31858976 Free PMC article.
-
Physics of the Nuclear Pore Complex: Theory, Modeling and Experiment.Phys Rep. 2021 Jul 25;921:1-53. doi: 10.1016/j.physrep.2021.03.003. Epub 2021 Mar 24. Phys Rep. 2021. PMID: 35892075 Free PMC article.
-
Enhanced diffusion by reversible binding to active polymers.Macromolecules. 2021 Feb 23;54(4):1850-1858. doi: 10.1021/acs.macromol.0c02306. Epub 2021 Feb 10. Macromolecules. 2021. PMID: 35663922 Free PMC article.
-
Regulating transport efficiency through the nuclear pore complex: The role of binding affinity with FG-Nups.Mol Biol Cell. 2024 Dec 1;35(12):ar149. doi: 10.1091/mbc.E24-05-0224. Epub 2024 Oct 30. Mol Biol Cell. 2024. PMID: 39475712 Free PMC article.
-
On the nuclear pore complex and its emerging role in cellular mechanotransduction.APL Bioeng. 2022 Mar 10;6(1):011504. doi: 10.1063/5.0080480. eCollection 2022 Mar. APL Bioeng. 2022. PMID: 35308827 Free PMC article. Review.
References
-
- Zhou R, Zhou H, Xiong B, He Y, and Yeung ES, Journal of the American Chemical Society 134, 13404 (2012). - PubMed
-
- Strambio-De-Castillia C, Niepel M, and Rout MP, Nature Reviews Molecular Cell Biology 11, 490 (2010). - PubMed
-
- Schneider AFL and Hackenberger CPR, Current Opinion in Biotechnology 48, 61 (2017). - PubMed
Grants and funding
LinkOut - more resources
Full Text Sources
