. 2019 Nov 27;19(1):517.
doi: 10.1186/s12870-019-2133-z.

Single-molecule real-time sequencing facilitates the analysis of transcripts and splice isoforms of anthers in Chinese cabbage (Brassica rapa L. ssp. pekinensis)

Affiliations

Single-molecule real-time sequencing facilitates the analysis of transcripts and splice isoforms of anthers in Chinese cabbage (Brassica rapa L. ssp. pekinensis)

Chong Tan et al. BMC Plant Biol. .

Abstract

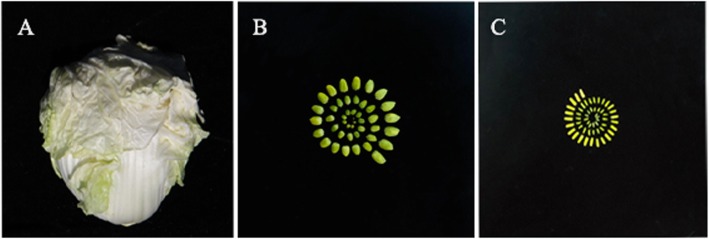
Background: Anther development has been extensively studied at the transcriptional level, but a systematic analysis of full-length transcripts on a genome-wide scale has not yet been published. Here, the Pacific Biosciences (PacBio) Sequel platform and next-generation sequencing (NGS) technology were combined to generate full-length sequences and completed structures of transcripts in anthers of Chinese cabbage.

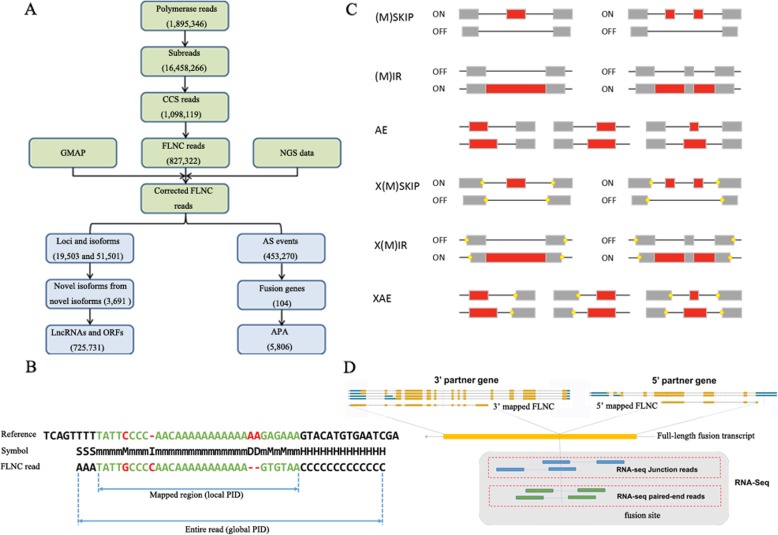
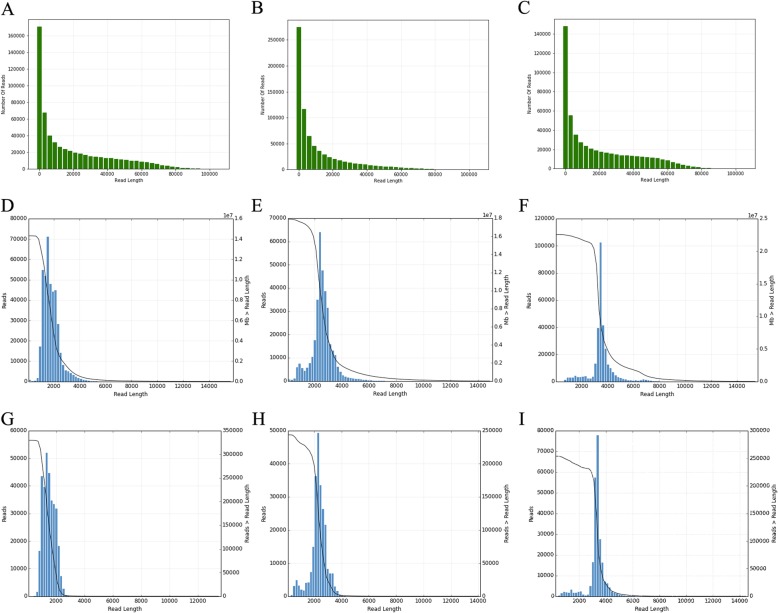
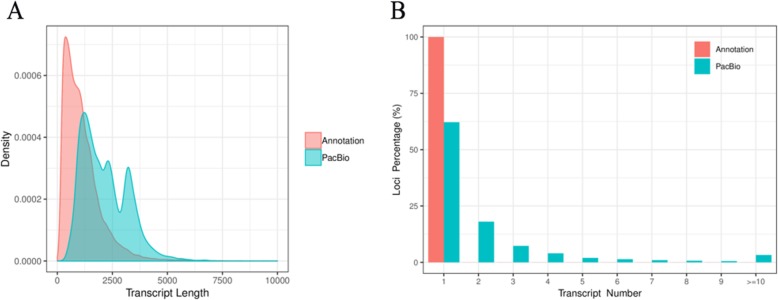
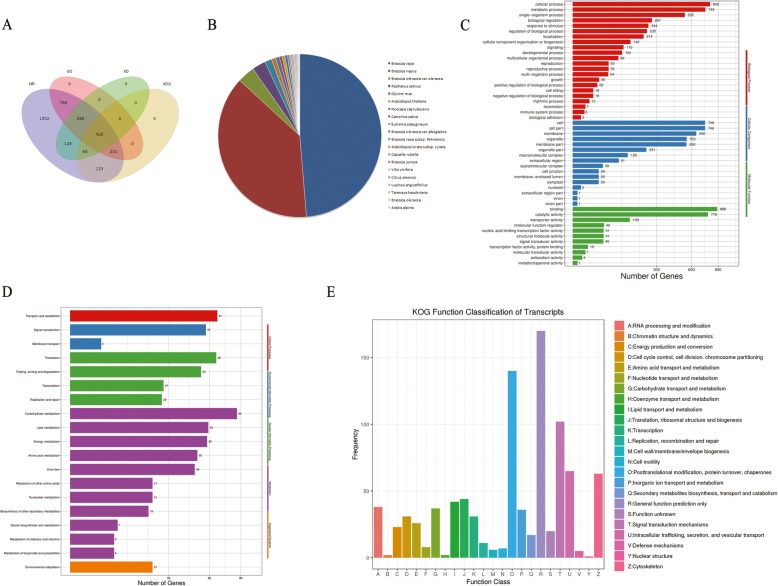
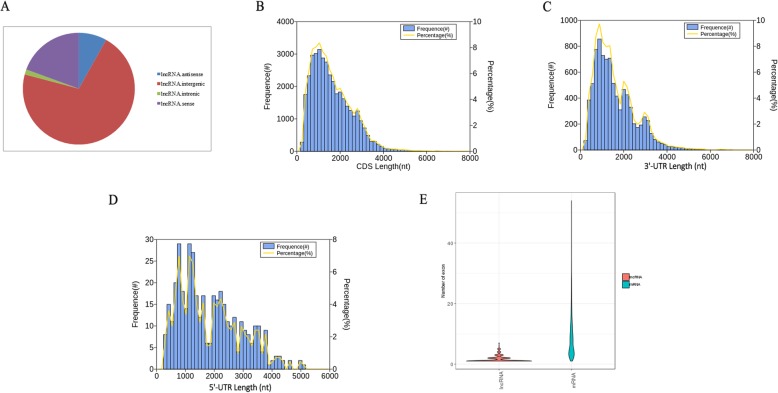
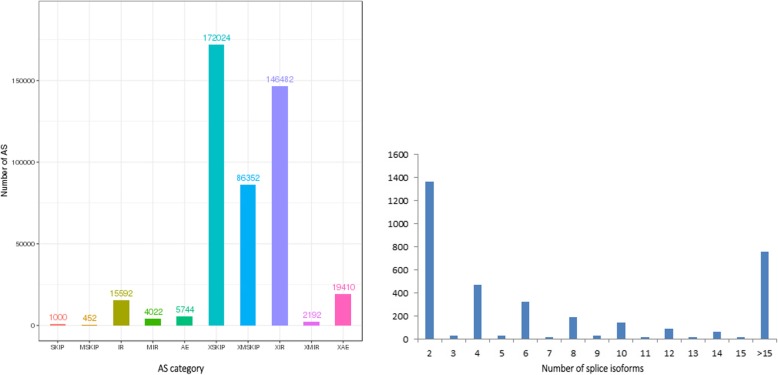
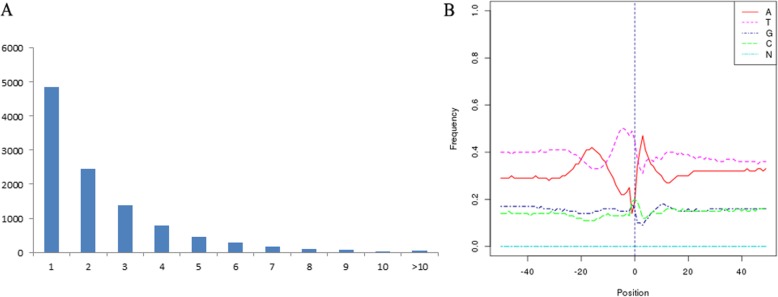
Results: Using single-molecule real-time sequencing (SMRT), a total of 1,098,119 circular consensus sequences (CCSs) were generated with a mean length of 2664 bp. More than 75% of the CCSs were considered full-length non-chimeric (FLNC) reads. After error correction, 725,731 high-quality FLNC reads were estimated to carry 51,501 isoforms from 19,503 loci, consisting of 38,992 novel isoforms from known genes and 3691 novel isoforms from novel genes. Of the novel isoforms, we identified 407 long non-coding RNAs (lncRNAs) and 37,549 open reading frames (ORFs). Furthermore, a total of 453,270 alternative splicing (AS) events were identified and the majority of AS models in anther were determined to be approximate exon skipping (XSKIP) events. Of the key genes regulated during anther development, AS events were mainly identified in the genes SERK1, CALS5, NEF1, and CESA1/3. Additionally, we identified 104 fusion transcripts and 5806 genes that had alternative polyadenylation (APA).

Conclusions: Our work demonstrated the transcriptome diversity and complexity of anther development in Chinese cabbage. The findings provide a basis for further genome annotation and transcriptome research in Chinese cabbage.

Keywords: Alternative splicing; Anther; Chinese cabbage; Full-length transcript; Fusion transcript.


Conflict of interest statement

All the authors declare that they have no competing interests.

Figures

Fig. 1
Fig. 1
Morphological characteristics of DH line ‘FT’. a Leafy head. b The entire buds of inflorescence. c Anthers during different development stages
Fig. 2
Fig. 2
Bioinformatics analysis. a Flow chart of PacBio Sequel platform. b Illustration of FLNC mapping and PID calculation. m: match. M: mismatch; S: soft-clipping. H: hard-clipping. D: deletion; I: insertion. The calculation formulas of PID were as follow: local PID = m/ (m + M + D + I), gobal PID = m/ (m + M + S + H + D + I). c Classification map of AS events. (M)SKIP: (cassette exons) exon skipping; (M)IR: retention of (multiple) single introns; AE: alternative exon ends (5′, 3′ or both); X(M)SKIP: approximate (cassette exons) exon skipping; X(M)IR: approximate retention of (multiple) single introns; XAE: approximate alternative exon ends; d Schematic diagram of fusion transcripts detection
Fig. 3
Fig. 3
Length distribution of the PacBio Sequel data output. a-c Number and length distribution of polymerase reads. d-f Number and length distribution of CCSs. g-i Number and length distribution of FLNC reads
Fig. 4
Fig. 4
The distribution of PID (percentage-of-identity) before and after error correction. a Gobal PID distribution before error correction. b Local PID distribution before error correction. c Gobal PID distribution after error correction. d Local PID distribution after error correction
Fig. 5
Fig. 5
Isoform length density and Isoform number of loci density. a The length distribution of all isoforms in the PacBio Sequel platform compared to the reference genome. b The number distribution of isoforms from each locus in the PacBio Sequel platform compared to the reference genome
Fig. 6
Fig. 6
Circos visualization of the PacBio Sequel platform at genome-wide level. a Ten chromosomes distribution of B.rapa genome. b APA sites distribution mapped to B.rapa genome. c Novel isoforms density from the PacBio Sequel platform. d Novel loci density from the PacBio Sequel platform. The closer the color is to red, the higher the density. Conversely, the closer the color is to blue, the lower the density. e LncRNA density from the PacBio Sequel platform. The closer the point is to the center, the lower the density. f Fusion transcripts distribution. Purple line represents intra-chromosome fusion transcripts, and yellow line represents inter-chromosomal
Fig. 7
Fig. 7
Function annotations of novel isoforms identified by the PacBio Sequel platform. a The number statistics of novel isoforms in Nr, GO, KEGG, KOG databases. b Distribution of novel isoforms in Nr homologous top 20 species. c Distribution of novel isoforms in GO terms. d Distribution of novel isoforms in KEGG pathway. e Distribution of novel isoforms in KOG
Fig. 8
Fig. 8
LncRNA and ORF analysis. a Identification of four types of lncRNA. b Number, percentage and length distributions of CDS of novel isoforms with predicted ORF. c Number, percentage and length distributions of 3′ UTRs of novel isoforms with predicted ORF. d Number, percentage and length distributions of 5′ UTRs of novel isoforms with predicted ORF. e Exon number distribution of novel isoforms with predicted ORF and lncRNAs
Fig. 9
Fig. 9
Identification of AS events. a The number distribution of AS events in loci detected by the PacBio Sequel platform. b Distribution of loci that produce two or more splice isoforms detected by the PacBio Sequel platform
Fig. 10
Fig. 10
APA analysis predicted by the PacBio Sequel platform. a The number distribution of poly-A sites per gene. b Nucleotide distribution around poly-A cleavage sites

References

    1. Sang F, Nicklen S. Coulson. DNA sequencing with chain-terminating inhibitors. PNAS. 1977;74(12):5463–5467. doi: 10.1073/pnas.74.12.5463. - DOI - PMC - PubMed
    1. van Dijk EL, Auger H, Jaszczyszyn Y, Thermes C. Ten years of next generation sequencing technology. Trends Genet. 2014;30(9):418–426. doi: 10.1016/j.tig.2014.07.001. - DOI - PubMed
    1. Wang Z, Gerstein M, Snyder M. RNA-Seq: a revolutionary tool for transcriptomics. Nat Rev Genet. 2009;15(1):57–63. doi: 10.1038/nrg2484. - DOI - PMC - PubMed
    1. An H, Yang Z, Yi B, Wen J, Shen J, Tu J, Ma C, Fu T. Comparative transcript profiling of the fertile and sterile flower buds of pol CMS in B napus. BMC Genomics. 2014;15:258. doi: 10.1186/1471-2164-15-258. - DOI - PMC - PubMed
    1. Liu C, Liu Z, Li C, Zhang Y, Feng H. Comparative transcriptome analysis of fertile and sterile buds from a genetically male sterile line of Chinese cabbage. In Vitro Cell Dev Biol Plant. 2016;52(2):130–139. doi: 10.1007/s11627-016-9754-9. - DOI