. 2020 Feb;10(2):288-305.
doi: 10.1158/2159-8290.CD-19-0811. Epub 2019 Nov 26.

Gain-of-Function RHOA Mutations Promote Focal Adhesion Kinase Activation and Dependency in Diffuse Gastric Cancer

Affiliations

Gain-of-Function RHOA Mutations Promote Focal Adhesion Kinase Activation and Dependency in Diffuse Gastric Cancer

Haisheng Zhang et al. Cancer Discov. 2020 Feb.

Abstract

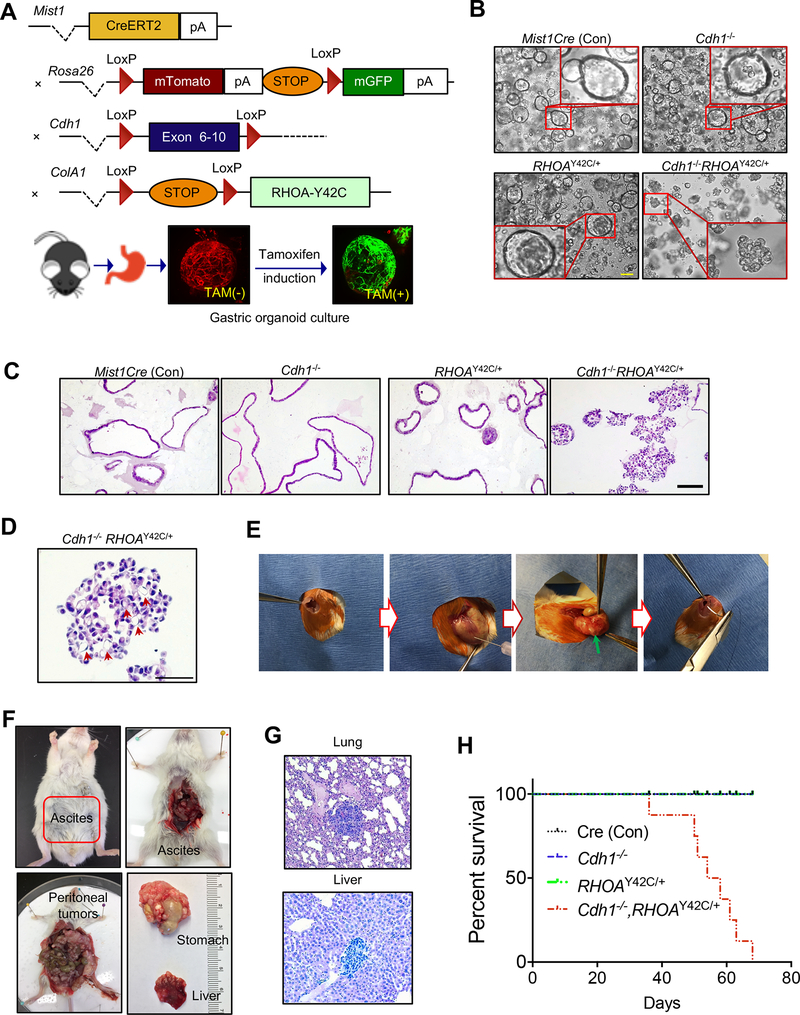
Diffuse gastric cancer (DGC) is a lethal malignancy lacking effective systemic therapy. Among the most provocative recent results in DGC has been that of highly recurrent missense mutations in the GTPase RHOA. The function of these mutations has remained unresolved. We demonstrate that RHOAY42C, the most common RHOA mutation in DGC, is a gain-of-function oncogenic mutant, and that expression of RHOAY42C with inactivation of the canonical tumor suppressor Cdh1 induces metastatic DGC in a mouse model. Biochemically, RHOAY42C exhibits impaired GTP hydrolysis and enhances interaction with its effector ROCK. RHOA Y42C mutation and Cdh1 loss induce actin/cytoskeletal rearrangements and activity of focal adhesion kinase (FAK), which activates YAP-TAZ, PI3K-AKT, and β-catenin. RHOAY42C murine models were sensitive to FAK inhibition and to combined YAP and PI3K pathway blockade. These results, coupled with sensitivity to FAK inhibition in patient-derived DGC cell lines, nominate FAK as a novel target for these cancers. SIGNIFICANCE: The functional significance of recurrent RHOA mutations in DGC has remained unresolved. Through biochemical studies and mouse modeling of the hotspot RHOAY42C mutation, we establish that these mutations are activating, detail their effects upon cell signaling, and define how RHOA-mediated FAK activation imparts sensitivity to pharmacologic FAK inhibitors.See related commentary by Benton and Chernoff, p. 182.This article is highlighted in the In This Issue feature, p. 161.


Figures

Figure 1.
Figure 1.. Cdh1 loss with RHOA hotspot mutation induces diffuse gastric cancer in vivo.
A, Schematic for the generation of mice with distinct genotypes, including the tomato-GFP reporter allele; bottom: representative stack confocal image of gastric organoids with Mist1CreERT2-R26mTmG 48 hours after tamoxifen (2 μM) induction in vitro. Representative images of (B) phase contrast and (C) H&E for gastric organoids with annotated genotypes after three weeks following in vitro tamoxifen induction. Scale bar = 100 μm. D, Representative higher-magnification image showing signet ring cells in Cdh1−/−RHOAY42C/+organoids following tamoxifen induction. Scale bar = 50 μm. E, Procedure of orthotopic injection into gastric wall with green arrow noting location following injection. F, Representative gross images of mouse with gastric tumor, ascites, peritoneal spread with liver metastases at eight weeks following orthotopic injection of Cdh1−/−RHOAY42C/+ organoids. G, Representative H&E images of liver and lung metastases following orthotopic implantation of Cdh1−/−RHOAY42C/+ organoids. Scale bar = 100 μm. H, Kaplan-Meier survival curve following orthotopic implantation of organoids of noted genotypes. Log-rank (Mantel-Cox) test, P=0.0047 (Cdh1−/−RHOAY42C/+ versus other genotypes).
Figure 2.
Figure 2.. RHOAY42C is a mutation with gain-of-function by stimulating stress fibers and focal adhesions.
A, Immunofluorescence analysis of NIH/3T3 fibroblasts stably expressing exogenous HA epitope-tagged RHOA WT and mutant proteins, stained with phalloidin to monitor stress fiber formation and anti-vinculin antibody to visualize focal adhesions (FA). Images are representative of three independent experiments. Scale bar = 10 μm. B, Quantitation of stress fiber formation in the cells from (A), by calculating the corrected total cell fluorescence (20 cells per condition, n = 3 independent experiments). To measure FA assembly in the cells from (A), the area of each FA (C), the number of FA per cell (D), and the eccentricity of each FA (E) was calculated based on the vinculin staining (1307 to 2295 FA in 14 to 20 cells per condition, n = 3). Data are mean ± S.E.M. F, CMFDA-labelled NIH/3T3 cells were allowed to adhere upon fibronectin for 1 h. Data are mean ± S.E.M. (n = 3). G, Images of cells during random migration were captured using a time lapse microscope at 1 frame/10 min for 16 h. Data are mean migration velocities ± S.E.M. (n = 4, 25 cells per experiment); ***P<0.001, **P<0.01, *P<0.05, ns, not significant; P values from one-way ANOVA with Tukey’s multiple comparison test. H, Representative immunofluorescence images for F-actin in organoids from mice with annotated genotypes. Phalloidin (in red) was used to visualize F-actin, DAPI (in blue) for the nucleus. Scale bar = 50 μm.
Figure 3.
Figure 3.. RHOAY42C exhibits impaired GTP hydrolysis and altered effector binding.
A, E. coli-expressed RHOA proteins were evaluated in vitro. Intrinsic guanine nucleotide exchange activity (n = 3). B, Recombinant ECT2 DH-PH catalytic domain stimulation of RHOA nucleotide exchange activity (n = 3). Intrinsic RHOA GTP hydrolysis activity was determined by (C, D) directly measuring RHOA bound GTP levels (n = 4) or (E, F) based on phosphate release using the phosphate binding protein sensor (n = 2). G, Determination of p190RhoGAP catalytic domain stimulation of RHOA GTP hydrolysis activity using the phosphate binding protein sensor (n = 2). Data in A-G are mean ± S.E.M.; ***P<0.001, **P<0.01, *P<0.05, ns, not significant; unpaired t-test. H, RHOA guanine nucleotide binding was determined in NIH/3T3 cells expressing the indicated RHOA proteins by 32P-metabolic labeling (n = 2). Data are mean ± S.E.M., ***P<0.001, ns, not significant; one-way ANOVA with Tukey’s multiple comparison test. I, Normalized binding affinities of RHOA WT and Y42C to RBD domains of indicated effectors, as determined in effector-nucleotide dissociation assays; nb = binding too weak to be detected (n = 3). All affinities were normalized to RHOA WT binding to each effector. Data are mean ± S.E.M.; ***P<0.001, ns, not significant; unpaired t-test. J, Comparison of WT and mutant RHOA biochemical properties.
Figure 4.
Figure 4.. RHOAY42C promotes activation of PI3K/β-catenin and YAP/TAZ.
A, Heatmap representation of selected antibodies from RPPA analysis of isogenic gastric organoids with annotated genotypes. Cdh1+/+ and Cdh1−/− fold change values were calculated with respect to matched RHOA-EV controls per antibody (see also Supplementary Fig. S4A, S4D, S4E and Supplementary Table S1). Resulting values were log2 changed and clustered using k-means clustering for antibodies. B-C, Volcano plots representing results comparing RHOAY42C versus RHOAWT in (B) Cdh1-null organoids or (C) in Cdh1 WT organoids by RPPA analysis. Significantly upregulated and downregulated proteins and phosphorylation sites are represented by pink and gold dots, respectively. Horizontal dotted line represents p-value threshold of 0.05. The list of top protein phosphorylation/expression differences is provided in Supplementary Table S1. D, Immunoblots of Cdh1 intact and null isogenic organoids engineered with lentiviral EGFP-RHOAY42C or controls (representative image from 3 independent experiments). E, Immunofluorescence analysis of β-catenin in organoids from mice with annotated genomes. Scale bar = 100 μm. F, Immunoblotting for YAP in Cdh1-null organoids with lentiviral EGFP-RHOAY42C or controls (representative image from 3 independent experiments). G, Immunofluorescence of active (non-phosphorylated) YAP in organoids from mice of annotated genomes. Scale bar = 100 μm. H, Tumor incidence of Cdh1-null organoids with ectopic expression of YAP(S127A) or β-catenin(S33Y) or both vectors, implanted into flanks of NSG mice. Data are mean ± S.D; ****P<0.0001, unpaired two-tailed Student’s t-test.
Figure 5.
Figure 5.. YAP and β-catenin pathways are both required for the Cdh1−/−RHOAY42C/+-induced transformation.
A, Tumor volume of Cdh1−/−RHOAY42C/+ organoids with ectopic expression of either TCF4-DN (del aa 1–31) or YAP-DN (S94A) followed by flank implantation, with representative images (bottom) of tumors from each group (n=4 for each). Data are mean ± S.E.M. ****P<0.0001, two-way ANOVA, (TCF4-DN or YAP-DN versus EV group). B, Representative images of Ki67 staining of the tumors from (A). Scale bar = 50 μm. C, Representative H&E images for the tumors from (A). Scale bar = 100 μm. D, Tumor volume of Trp53−/−KrasG12D/+ organoids with ectopic expression of TCF4-DN (del aa 1–31) or YAP-DN (S94A) or combination, implanted into flanks, with representative images of tumors from each group (n = 4 for each). Data are mean ± S.E.M. E, In vitro proliferation of Cdh1−/−RHOAY42C/+ and Trp53−/−KrasG12D/+ organoids treated with DMSO or verteporfin (YAP inhibitor, 5 μM) combined with ICG-001 (antagonist of β-catenin/TCF4 binding, 5 μM) or MK-2206 (AKT inhibitor, 2 μM) for 48 h. Data are mean ± S.E.M. *P<0.05, ***P<0.001, unpaired two-tailed Student’s t-test. F, Representative phase contrast images of Cdh1−/−RHOAY42C/+ or Trp53−/−KrasG12D/+ organoids treated for 48 h with DMSO or verteporfin (5 μM), combined with ICG-001 (5 μM) or MK-2206 (2 μM). Scale bar = 100 μm. G, Tumor volume of Cdh1−/−RHOAY42C/+ organoids injected into flanks of NSG mice and treated with DMSO, pictilisib (PI3K inhibitor, 75 mg/kg), verteporfin (100 mg/kg) or the combination (n = 8 tumors for each). Data are mean ± S.E.M. **P<0.01, ****P<0.0001, two-way ANOVA (treatment versus DMSO).
Figure 6.
Figure 6.. RHOAY42C-mediated FAK Activation Induces PI3K/AKT and YAP/TAZ.
A, Representative immunoblotting and quantitation of Cdh1−/− organoids with ectopic expression of RHOAY42C, RHOAWT or EGFP control (n = 3 independent experiments). B, Representative immunoblotting of gastric organoids with noted genotypes (n = 3 independent experiments). C, Immunoblotting of Cdh1−/− organoids with ectopic expression of Ptk2 (FAK) or vector control (n = 3 independent experiments). Representative images of H&E (D) and Alcian Blue (E) for Cdh1−/− organoids with ectopic expression of Ptk2 or vector control. Scale bar = 100 μm. F, Immunoblotting of Cdh1−/−RHOAY42C/+ organoids with silencing of Ptk2 or control (n= 3 independent experiments). G, Immunoblotting of Cdh1−/−RHOAY42C/+ organoids treated with DMSO or PF-573228 (1 μM and 5 μM) for 48 h (n= 3 independent experiments). Representative images of (H) H&E and (I) Alcian Blue staining of Cdh1−/−RHOAY42C/+ organoids treated with DMSO or PF-573228 (5 μM) for 48 h. Scale bar = 100 μm. J, Images from live-cell confocal microscopy of Cdh1−/−RHOAY42C/+ organoids treated with DMSO or PF-573228 (5 μM), with time from drug administration marked for each image. Scale bar = 20 μm. K, Tumor volume of Cdh1−/−RHOAY42C/+ organoids injected into flanks of NSG mice (n = 10 tumors per arm) treated with DMSO or PF-573228 (12.5 mg/kg), with representative images (right) of tumors. ***P<0.001, ****P<0.0001, unpaired two-tailed Student’s t-test. Data are mean ± S.E.M. L, Tumor volume of Cdh1−/−RHOAY42C/+ organoids injected into flanks of NSG mice (n = 10), randomly separated into 2 groups and treated with DMSO or defactinib (12.5 mg/kg) every other day. ****P<0.0001, two-way ANOVA (defactinib versus DMSO). Data are mean ± S.E.M. M, Representative images of Ki67 staining of tumors from (K) and (L). Scale bar = 100 μm. N, Representative images of TUNEL staining of tumors from (K) and (L). Scale bar = 100 μm. O, Model of the signaling network induced by the gain-of-function mutation RHOAY42C and loss of Cdh1 (E-cadherin) in DGC. Targeted inhibitors are depicted in red boxes.
Figure 7.
Figure 7.. FAK is a potent therapeutic target in human DGC cell lines and patients.
A, Immunoblots from IGC cell lines: AGS, KE39,YCC-1 and SNU719, and DGC lines SNU668, NUGC4 and FU97 (n = 3 independent experiments). B, Quantification of pFAK levels from (A). C, Representative immunoblots of FU97,SNU668 and SNU719 cells treated for 24 h with DMSO or FAK inhibitor PF-573228 (5 μM) or defactinib (2.5 μM) (n = 3 independent experiments). D, In vitro proliferation of SNU668, NUGC4 and FU97 cells treated for indicated days with DMSO or PF-573228 (5 μM). Data are mean ± S.E.M. ****P<0.0001, two-way ANOVA. E, In vitro proliferation of SNU719 and AGS cells treated for the indicated days with DMSO or PF-573228 (5 μM). Data are mean ± S.E.M. ****P<0.0001, two-way ANOVA. F, Tumor volume of 1✕106 SNU668 cells injected into flanks of NSG mice and treated with DMSO (n=4) or 5-FU (n=4, 50 mg/kg) or PF-573228 (n=6, 12.5 mg/kg) every other day, with representative images (bottom) of tumors from each group. *P<0.05, ****P<0.0001, two-way ANOVA (Treatments versus DMSO). Data are mean ± S.E.M. G, Representative images of H&E of tumors from panel (F). Scale bar = 100 μm. H, Tumor volume of 1✕106 SNU719 cells injected into flanks of NSG mice and treated with DMSO (n=4) or 5-FU (n=5, 50 mg/kg) or PF-573228 (n=4, 12.5 mg/kg) every other day. ns, not significant, ****P<0.0001, two-way ANOVA (Treatment versus DMSO). Data are mean ± S.E.M. I, Representative images of pFAK staining for human diffuse gastric patients with tumor area (left), adjacent normal surface epithelial area (middle) and gland epithelial cells (right). Scale bar = 100 μm.

Comment in

References

    1. Ferlay J, Soerjomataram I, Dikshit R, Eser S, Mathers C, Rebelo M, et al. Cancer incidence and mortality worldwide: sources, methods and major patterns in GLOBOCAN 2012. Int J Cancer 2015;136(5):E359–86 doi 10.1002/ijc.29210. - DOI - PubMed
    1. Lauren P The Two Histological Main Types of Gastric Carcinoma: Diffuse and So-Called Intestinal-Type Carcinoma. An Attempt at a Histo-Clinical Classification. Acta Pathol Microbiol Scand 1965;64:31–49. - PubMed
    1. Kakiuchi M, Nishizawa T, Ueda H, Gotoh K, Tanaka A, Hayashi A, et al. Recurrent gain-of-function mutations of RHOA in diffuse-type gastric carcinoma. Nat Genet 2014;46(6):583–7 doi 10.1038/ng.2984. - DOI - PubMed
    1. Cancer Genome Atlas Research N. Comprehensive molecular characterization of gastric adenocarcinoma. Nature 2014;513(7517):202–9 doi 10.1038/nature13480. - DOI - PMC - PubMed
    1. Becker KF, Atkinson MJ, Reich U, Becker I, Nekarda H, Siewert JR, et al. E-cadherin gene mutations provide clues to diffuse type gastric carcinomas. Cancer Res 1994;54(14):3845–52. - PubMed

Publication types

MeSH terms