. 2019 Nov 26;4(6):e00639-19.
doi: 10.1128/mSystems.00639-19.

Racial Differences in the Oral Microbiome: Data from Low-Income Populations of African Ancestry and European Ancestry

Affiliations

Racial Differences in the Oral Microbiome: Data from Low-Income Populations of African Ancestry and European Ancestry

Yaohua Yang et al. mSystems. .

Abstract

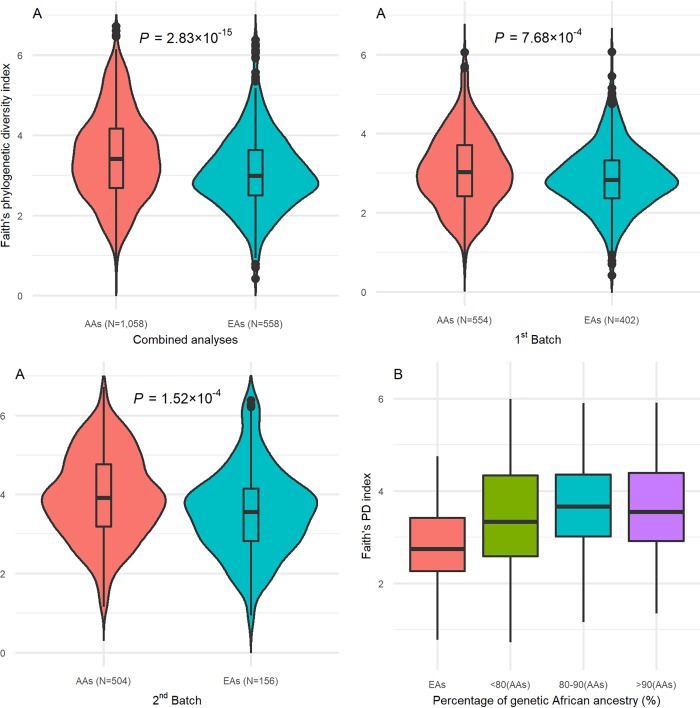
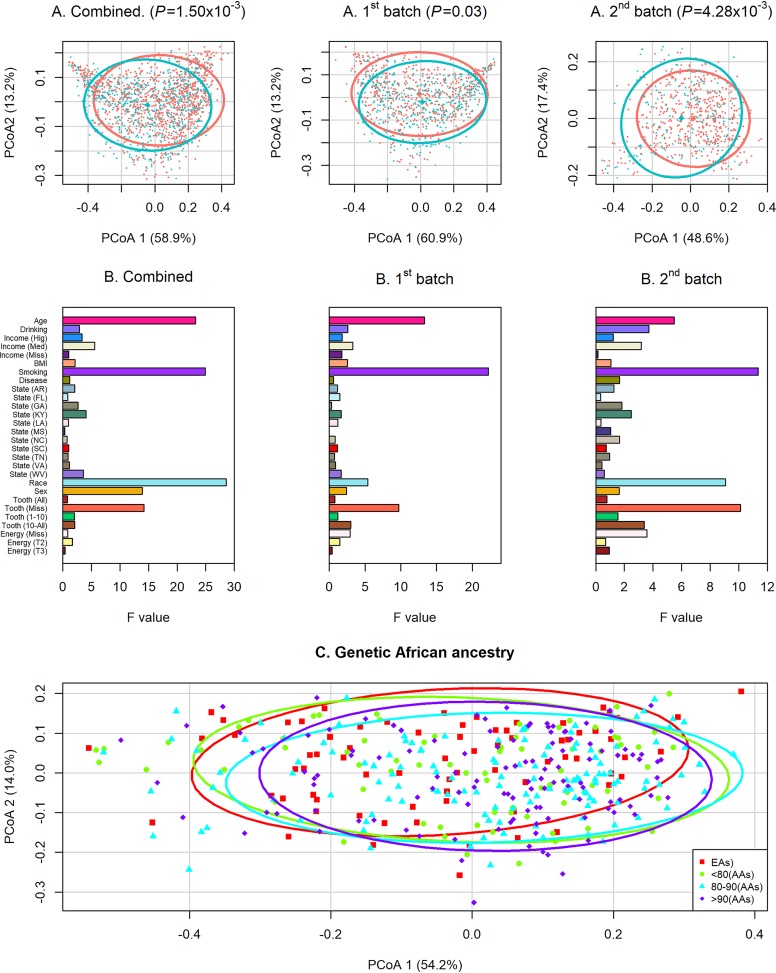
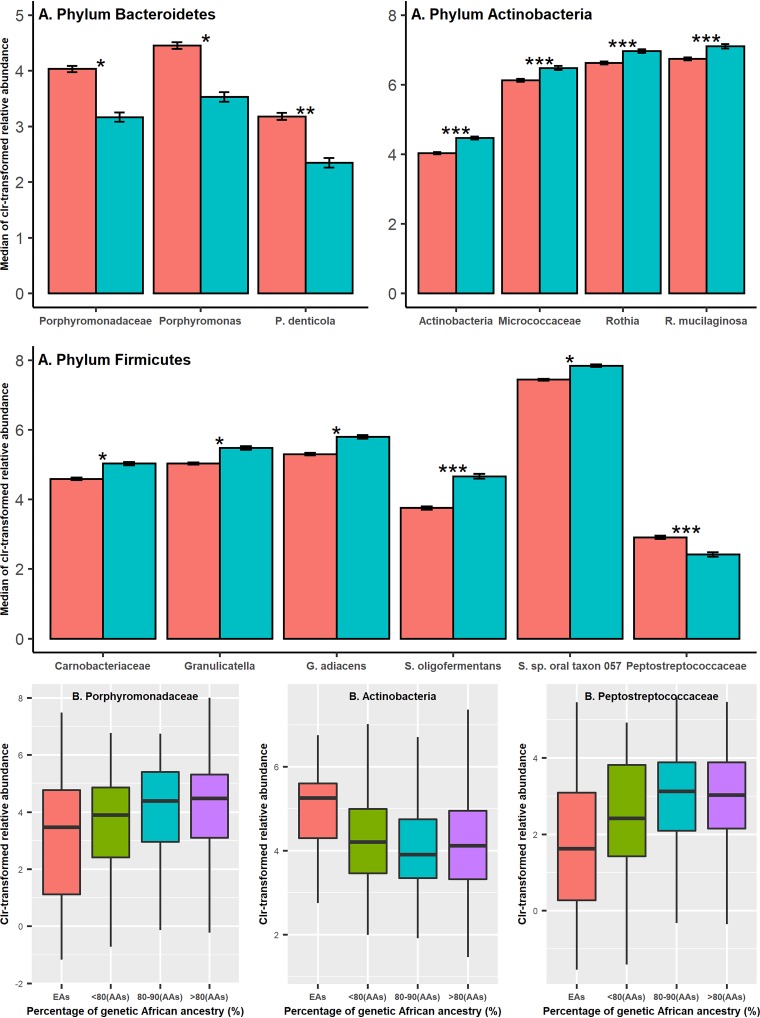
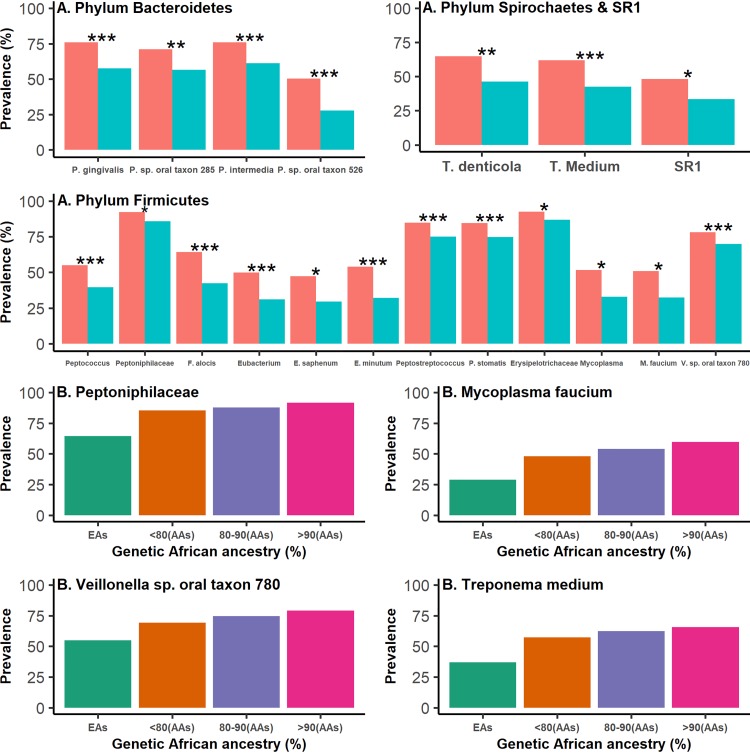
Increasing evidence indicates the significant racial difference in gut, vaginal, and skin microbiomes. However, little is known regarding the racial difference in the oral microbiome. In this study, deep sequencing of 16S rRNA genes was utilized to assess the oral microbiome in mouth rinse samples of 1,058 African-Americans (AAs) and 558 European-Americans (EAs) from the Southern Community Cohort Study. Generally, AAs had a higher species richness than EAs, with P = 5.28 × 10⁻¹⁴ (Wilcoxon rank sum test) for Faith's phylogenetic diversity index. A significant difference in overall microbiome composition was observed between AAs and EAs, with P = 5.94 × 10⁻⁴ (MiRKAT) for the weighted UniFrac distance matrix. We also found 32 bacterial taxa showing a significant differential abundance or prevalence between the two racial groups at a Bonferroni-corrected P < 0.05 in linear or logistic regression analyses. Generally, AAs showed a higher abundance of Bacteroidetes and a lower abundance of Actinobacteria and Firmicutes Interestingly, four periodontal pathogens, Porphyromonas gingivalis, Prevotella intermedia, Treponema denticola, and Filifactor alocis, were more prevalent among AAs than among EAs, with Bonferroni-corrected P values of 5.23 × 10⁻⁶, 4.47 × 10⁻⁶, 1.08 × 10⁻³, and 4.49 × 10⁻⁵, respectively. In addition, all of these 32 taxa were significantly correlated with the percentage of genetic African ancestry. These findings call for research to understand how the racial difference in oral microbiome influences the health disparity.IMPORTANCE In this systemic investigation of racial differences in the oral microbiome using a large data set, we disclosed the significant differences in the oral microbial richness/evenness, as well as in the overall microbial composition, between African-Americans and European-Americans. We also found multiple oral bacterial taxa, including several preidentified oral pathogens, showing a significant different abundance or prevalence between African-Americans and European-Americans. Furthermore, these taxa were consistently found to be associated with the percentage of genetic African ancestry. Our findings warrant further research to understand how the racial difference in the oral microbiome influences the health disparity.

Keywords: oral microbiome; racial difference.


Figures

FIG 1
FIG 1
Significant differences of oral microbial richness and evenness between AAs and EAs. The oral microbial richness and evenness were estimated using Faith’s phylogenetic diversity (PD) index. P values were calculated using Wilcoxon rank sum test. (A) Significant differences of Faith’s PD index were consistently observed in combined analyses and in stratified analyses by the two sequencing batches. (B) Increases in Faith’s PD index along with the increase in hosts’ genetic African ancestry.
FIG 2
FIG 2
Significant differences of overall oral microbiome composition between AAs and EAs. The overall oral microbiome composition was estimated using the weighted UniFrac matrices, and the P values were calculated using MiRKAT. (A) Red circles and blue triangles represent AAs and EAs, respectively. The ellipses and centroids (diamond) of the first two principal-coordinate analyses of weighted UniFrac distances for AAs (red) and EAs (blue) were estimated using the “dataEllipse” function of the R package “car.” (B) F values of other factors on weighted UniFrac distance in combined analyses and in stratified analyses by the two sequencing batches. (C) Changes in the first two principal coordinates of weighted UniFrac distance along with the increase in hosts’ genetic African ancestry.
FIG 3
FIG 3
Thirteen common bacterial taxa showing a significant differential abundance between AAs and EAs in linear regression analyses. (A) The associations of taxon abundance and race were evaluated using linear regression analyses. *, **, and *** represent the Bonferroni-corrected P values <0.05, <0.01, and <0.001, respectively. (B) Changes in centered-log-ratio-transformed relative abundance of three common taxa along with the increase in hosts’ genetic African ancestry. Similar plots for other common taxa shown in Table 2 are presented in Fig. S4.
FIG 4
FIG 4
Nineteen rare bacterial taxa showing a significant differential prevalence between AAs and EAs in logistic regression analyses. (A) The associations of taxon prevalence and race were evaluated using logistic regression analyses. *, **, and *** represent Bonferroni-corrected P values of <0.05, <0.01, and <0.001, respectively. (B) Increases in prevalence of four rare taxa along with the increase in hosts’ genetic African ancestry. Similar plots for other rare taxa shown in Table 3 are presented in Fig. S6.

References

    1. Human Microbiome Project Consortium. 2012. Structure, function and diversity of the healthy human microbiome. Nature 486:207–214. doi:10.1038/nature11234. - DOI - PMC - PubMed
    1. Nicholson JK, Holmes E, Kinross J, Burcelin R, Gibson G, Jia W, Pettersson S. 2012. Host-gut microbiota metabolic interactions. Science 336:1262–1267. doi:10.1126/science.1223813. - DOI - PubMed
    1. Cho I, Blaser MJ. 2012. The human microbiome: at the interface of health and disease. Nat Rev Genet 13:260–270. doi:10.1038/nrg3182. - DOI - PMC - PubMed
    1. Wade WG. 2013. The oral microbiome in health and disease. Pharmacol Res 69:137–143. doi:10.1016/j.phrs.2012.11.006. - DOI - PubMed
    1. Aas JA, Paster BJ, Stokes LN, Olsen I, Dewhirst FE. 2005. Defining the normal bacterial flora of the oral cavity. J Clin Microbiol 43:5721–5732. doi:10.1128/JCM.43.11.5721-5732.2005. - DOI - PMC - PubMed

LinkOut - more resources