. 2019 Dec 17;116(51):25430-25439.
doi: 10.1073/pnas.1900819116. Epub 2019 Nov 26.

Shaping the zebrafish myotome by intertissue friction and active stress

Affiliations

Shaping the zebrafish myotome by intertissue friction and active stress

S Tlili et al. Proc Natl Acad Sci U S A. .

Abstract

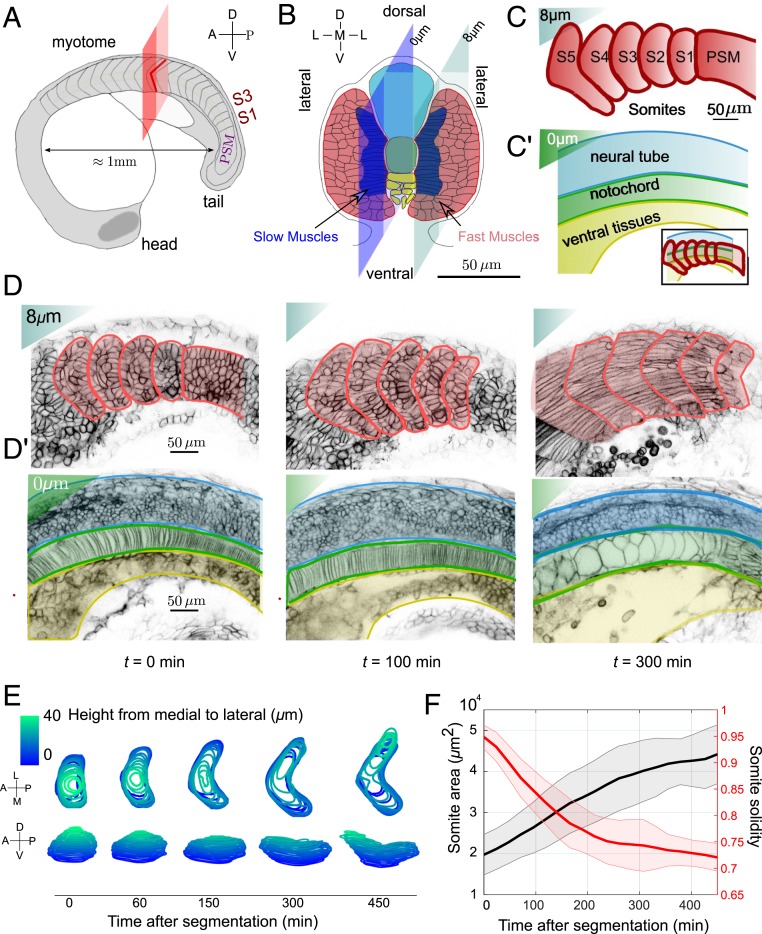
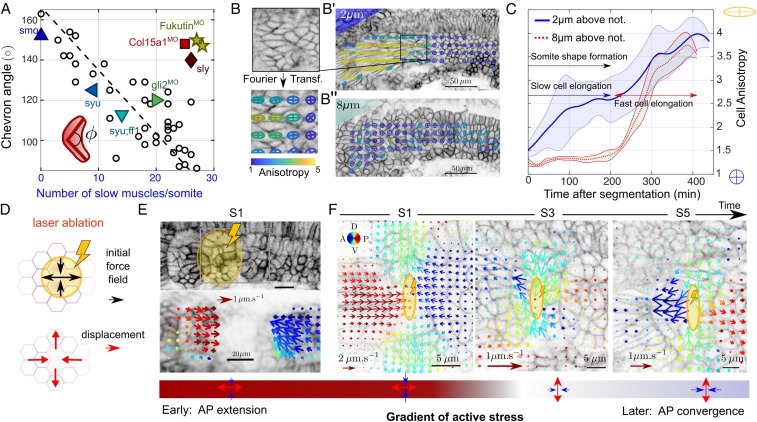
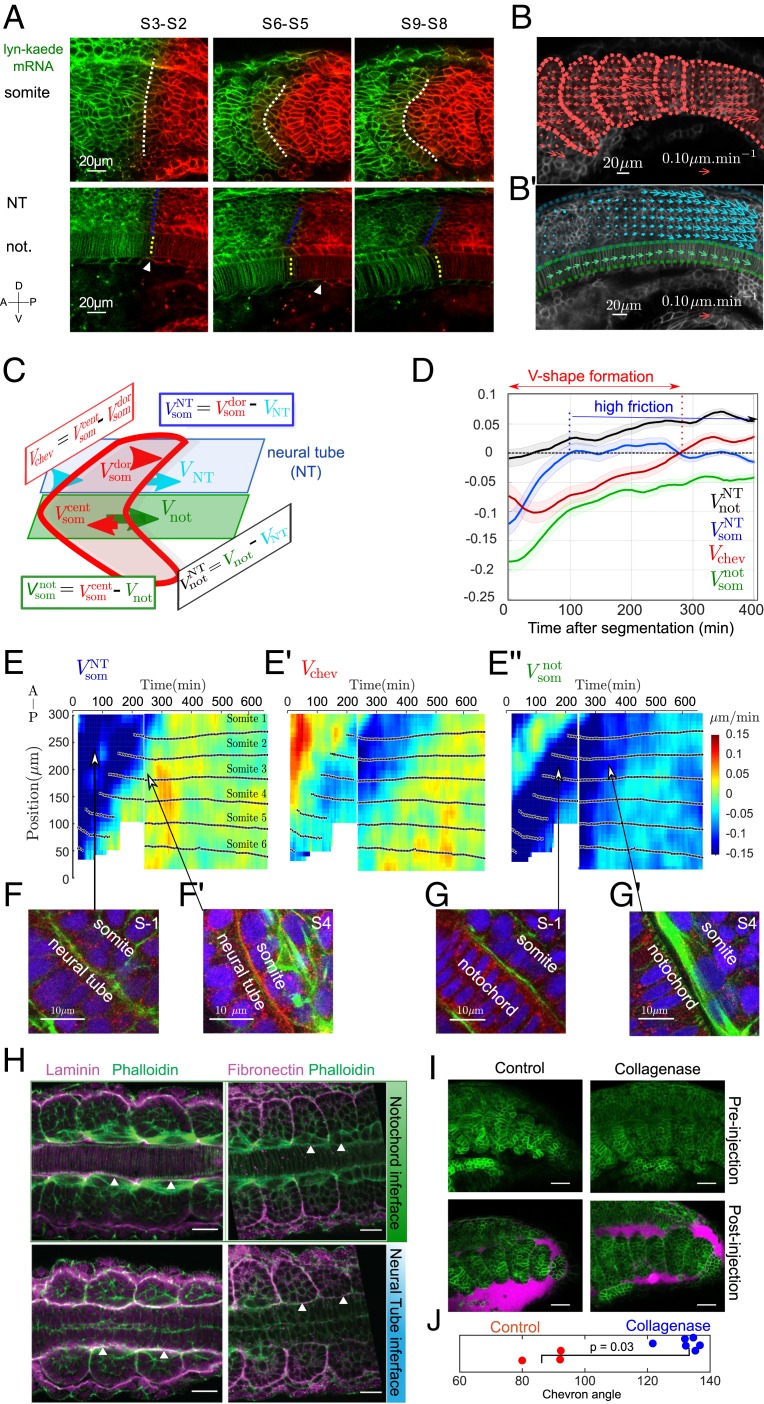
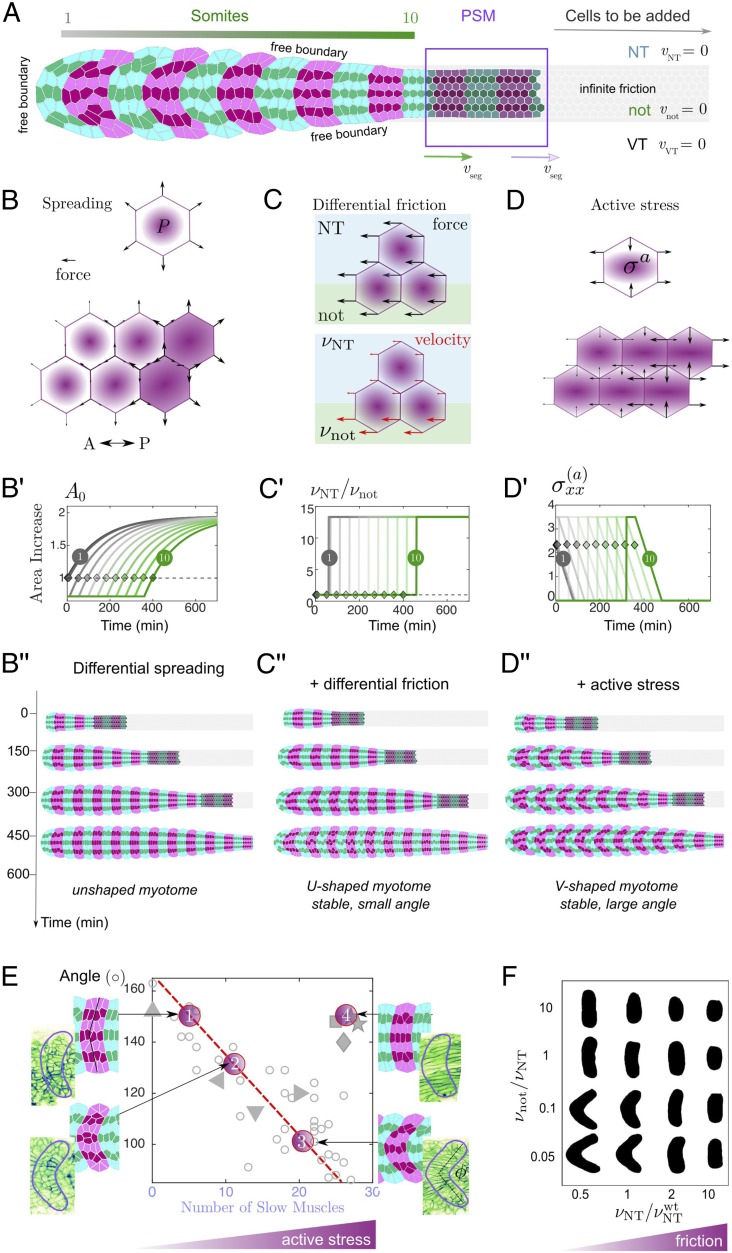
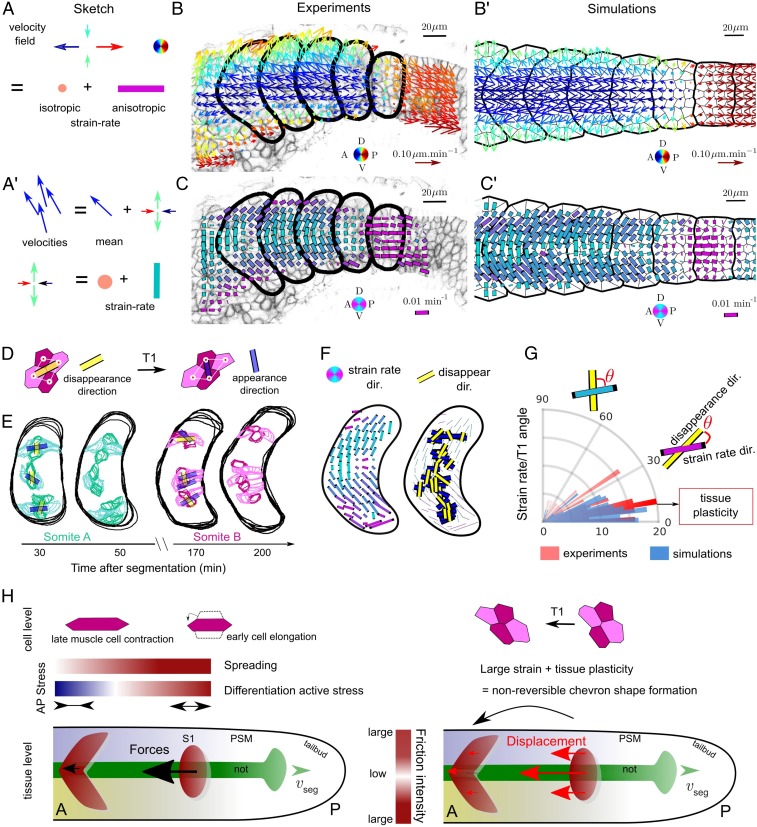
Organ formation is an inherently biophysical process, requiring large-scale tissue deformations. Yet, understanding how complex organ shape emerges during development remains a major challenge. During zebrafish embryogenesis, large muscle segments, called myotomes, acquire a characteristic chevron morphology, which is believed to aid swimming. Myotome shape can be altered by perturbing muscle cell differentiation or the interaction between myotomes and surrounding tissues during morphogenesis. To disentangle the mechanisms contributing to shape formation of the myotome, we combine single-cell resolution live imaging with quantitative image analysis and theoretical modeling. We find that, soon after segmentation from the presomitic mesoderm, the future myotome spreads across the underlying tissues. The mechanical coupling between the future myotome and the surrounding tissues appears to spatially vary, effectively resulting in spatially heterogeneous friction. Using a vertex model combined with experimental validation, we show that the interplay of tissue spreading and friction is sufficient to drive the initial phase of chevron shape formation. However, local anisotropic stresses, generated during muscle cell differentiation, are necessary to reach the acute angle of the chevron in wild-type embryos. Finally, tissue plasticity is required for formation and maintenance of the chevron shape, which is mediated by orientated cellular rearrangements. Our work sheds light on how a spatiotemporal sequence of local cellular events can have a nonlocal and irreversible mechanical impact at the tissue scale, leading to robust organ shaping.

Keywords: organ morphogenesis; somitogenesis; tissue mechanics; vertex models.


Conflict of interest statement

The authors declare no competing interest.

Figures

Fig. 1.
Fig. 1.
The chevron architecture of the future myotome emerges early after segmentation from the presomitic mesoderm (PSM). (A) Sketch of a 21-somite zebrafish embryo. Transverse plane to AP axis is shown in red. Two somites, at stages S1 and S3, are highlighted. (B) Sketch of S3-stage somite (t90 min postsegmentation) in the transverse plane. Dark blue (red) cells are future slow (fast) muscle cells, respectively. The dark and light blue planes represent the cross-sectional views shown in C and D. The notochord is at the center, with the neural tube (light blue) located more dorsally and ventral tissues below (yellow). (C and C′) Cartoon of somite shape after segmentation: (C) plane lying z=8μm from notochord and underlying tissues and (C′) plane crossing the notochord, neural tube, and ventral tissues. Inset shows shape of somites superimposed on underlying tissues. (D and D′) Confocal images of embryos expressing Lyn-td-Tomato and superimposed contours of (D) somites and PSM (red lines) and (D′) neural tube, notochord, and ventral tissues (blue, green, and yellow lines, respectively) at t=0,100,300 min postsegmentation from PSM for midbody somites (i.e., around the red plane in Fig. 1A). (E) The 3D evolution of somite shape after segmentation from PSM of a representative wild-type embryo. (F) Cross-sectional area and solidity (ratio of somite area to area of its convex hull) of segmented somites for the most medial layer of future fast muscle fibers (as in D) as a function of time after segmentation. Shaded region represents ±1 SD. Average is performed over 11 somites from 6 embryos.
Fig. 2.
Fig. 2.
Slow muscle elongation leads to anisotropic stresses. (A) Chevron angle (in degrees) in most medial layer of future fast muscle fibers against number of slow muscles per somite at S4. Black circles: cyclopamine-treated embryos at different concentrations. Triangles: morpholinos and mutants affecting cell differentiation [dark blue , smo (61); light blue , syu (62); cyan , syu + ff1 (62); and green , gli2MO (41)]. Morpholinos or mutants altering tissue integrity [dark yellow , Fukutin (37); light red , Col15a1aMO (36); dark red , sly (32, 63)]. See SI Appendix, SI Methods and Table S1 for further details (N=30 embryos and n=41 somites). (B) Fourier transform image analysis method (42) provides cell elongation field, with anisotropy represented by ellipsoids (SI Appendix, SI Methods). Cell elongation is along the major axis of the ellipse. (B′and B) Elongation maps of future slow (B′, 2μm above notochord) and fast (B, 8μm above notochord) muscle fibers. (C) Mean cell anisotropy after segmentation within a medial plane containing slow muscle fibers (solid blue line) and a more lateral plane, composed of fast muscle fibers (dashed red line). Shaded regions represent ±1 SD. Average is performed over 11 somites from 6 embryos. (D) Cartoon of predicted relaxation direction upon ablation of early somitic tissue. (E, Top) Laser ablation (yellow region) of somites expressing lyn-tdTomato at stages S0 and S1. (E, Bottom) Corresponding time-averaged tissue velocity from optic flow analysis in the 10s after ablation. Arrow color represents direction and length represents speed. (F) DV-orientated laser ablation at the DV midline of the medial layer of future fast fibers (yellow region), at different somite stages, with tissue velocity from optic flow analysis superimposed in the 10s after ablation. Color coding is as in E. Note the velocity scale is different for S1 compared to S3 and S5. (E and F, Bottom) Schematic of the inferred stress directions imposed by the ablated element on the tissue.
Fig. 3.
Fig. 3.
Differential tissue flow and tissue contact correlate with chevron emergence. (A) Lyn-Kaede showing relative movement of the somites (Top) with respect to the notochord and neural tube (Bottom) from S2 to S9. Kaede photoswitching was performed at the S2 stage in the more posterior somites (SI Appendix, SI Methods). Dashed lines highlight interfaces between the fluorescent regions. (B and B′) Velocity fields estimated by optic flow in WT embryos (SI Appendix, SI Methods) within the somite (som, red arrows, B), neural tube (NT, cyan arrows, B′) and notochord (not, green arrows, B′). (C) Definition of the mean AP velocities within each tissue. Color scheme is as in B. (D) Average relative tissue AP velocities (n=11 somites, N=5 embryos) after segmentation from the PSM. Shaded regions represent ±1 SD. (E, E′, and E) Kymographs of shear velocities VsomNT, Vchev, and Vsomnot show somite-to somite reproducibility of the features identified in D. Each panel is from 2 embryos, with stitching at t=220 min. Black dots indicate the position of each somite’s center of mass along the AP axis, with somite labeling representing somite number with respect to the start of the movie. In E′, negative shear (blue colored region) indicates region of chevron shape emergence. (F and G) Confocal images of actin (green), laminin (red), and nuclei (blue) in transverse plane to the ML axis for somites S − 1 and S − 4. (Scale bar: 10μm.) (F and F′) Somite–neural tube interface at S − 1 (F) and S4 (F′). (G and G′) Somite–notochord interface at S − 1 (G) and S4 (G′). Arrows highlight correlation between actin localization and relative tissue velocities in E–E. (H) Laminin (Left) and fibronectin (Right) antibody staining (SI Appendix, SI Methods) at the somite–notochord (Top row) and somite–neural tube (Bottom row) interfaces, imaged along the DV axis. Rightmost somite is in stage S1. Arrowheads highlight accumulation (or lack) of ECM components at the somite boundary with other tissues. (Scale bar: 20 μm.) (I) The 18-hpf embryos pre- and postinjection with collagenase or control. Green is Lyn-Td-Tomato and cyan is Dextran Alexa 647 showing the extracellular space. Postinjection images were taken 10 min after injection. (Scale bar: 25μm.) (J) Quantification of chevron angle 24 h postcollagenase injection. The 3 most posterior intact somites are quantified, along with the equivalent position in the control (P value from Mann–Whitney test).
Fig. 4.
Fig. 4.
Vertex model of chevron formation. (A) Simulated geometry used in the model. Simulated cell number increases with time as new cells are progressively added from the tailbud (purple box); magenta (green) cells belong to somite number 2N (2N+1), respectively. New somites appear at a velocity Vseg=1somite/(30min). Tension is increased along the somite–somite boundaries. (B–D) Principle elements included within the vertex model: (B) Differential spreading is implemented through increased cellular pressure along the AP axis, leading to a spatial modulation along the embryo axis of cellular outward forces (black arrows). (B′) Exponential increase in somite target area as a function of time, based on experimental measurements. Gray curve (dark green) corresponds to first (last) somite formed in simulation (diamonds indicate timing of segmentation of specific somite from PSM, A). (B) Simulations with differential spreading only. (C) Vertex displacement (red arrow) is spatially modulated by an inhomogeneous friction coefficient ν, where ν=νNT=νVT for vertices over the neural tube and ventral tissues and ν=νnot otherwise. (C′) The ratio of νNT to νnot is implemented as a step function. (C) Simulations with somite spreading and differential friction. (D) An imposed bulk active stress σ(a) leads to elongation forces along the AP axis (black arrows; see SI Appendix for derivation). (D′) Evolution of the extensile stress along the AP axis for different somite stages, with maximal stress 60 min before segmentation, corresponding to the onset of slow muscle fiber elongation. (D) Simulations with active differentiation stresses and differential friction (wild-type case): Somites acquire a stable chevron shape. (E) Comparison of experimentally measured chevron angle (Fig. 1G) with the angle measured for 4 simulation outcomes. Only the active differentiation stress level is varied from points 1 to 3 (all other parameters fixed), describing embryos treated with 50μmol (1) and 10μmol (2) of cyclopamine and wild-type embryos (3). (4) corresponds to the homogeneous friction case with νnot=νNT, describing perturbed tissue–tissue coupling of Col15a1aMO. (F) Somite shape variations depending on νNT and νnot/νNT.
Fig. 5.
Fig. 5.
Model accurately predicts orientation of cellular rearrangements. (A and A′) Definition of velocity field (arrows) and corresponding strain rates. (A′) Decomposition of velocities into isotropic and anisotropic strain-rate components. (B and B′) Comparison of velocity fields measured in experiments (B) (with optic flow; SI Appendix, SI Methods) and simulation (B′). Arrow color represents direction and length represents speed. (C and C′) Comparison of anisotropic component of the strain rates (ASR) in experiments (C) and simulations (C′). Bar color represents orientation (AP [magenta] and DV [cyan]) and length represents magnitude of the ASR (SI Appendix, SI Methods). (D) Scheme of cellular rearrangements, with cells losing contact joined by yellow bar and cells forming new contacts joined by blue bar. (E) Experimental examples of 3D cellular rearrangements for 2 somites at different somite stages. (F) Time- and ensemble-averaged ASR (Left) compared to accumulated cell rearrangement orientations superimposed on the ASR map (Right) (n=4 somites). (G) Rose plot alignment of cellular rearrangements with ASR in experiments (n=44 from 4 somites) and simulations (n=60 from 6 simulated somites). (H) Recapitulative cartoon. Gradients of spreading and active differentiation stresses result in an overall force oriented toward the anterior; reduced friction over the notochord leads to an increased displacement of the somite region over the notochord; large somite deformations are stabilized by cell rearrangements (tissue plasticity).

Similar articles

Cited by

References

    1. Baena-López L. A., Baonza A., García-Bellido A., The orientation of cell divisions determines the shape of Drosophila organs. Curr. Biol. 15, 1640–1644 (2005). - PubMed
    1. Hozumi S., et al. , An unconventional myosin in Drosophila reverses the default handedness in visceral organs. Nature 440, 798–802 (2006). - PubMed
    1. Affolter M., Zeller R., Caussinus E., Tissue remodelling through branching morphogenesis. Nat. Rev. Mol. Cell Biol. 10, 831–842 (2009). - PubMed
    1. Hariharan I. K., Organ size control: Lessons from Drosophila. Dev. Cell 34, 255–265 (2015). - PMC - PubMed
    1. Hamant O., et al. , Developmental patterning by mechanical signals in Arabidopsis. Science 322, 1650–1655 (2008). - PubMed

Publication types

LinkOut - more resources