

Linking energy loss in soft adhesion to surface roughness
- PMID: 31772024
- PMCID: PMC6925979
- DOI: 10.1073/pnas.1913126116
Linking energy loss in soft adhesion to surface roughness
Abstract
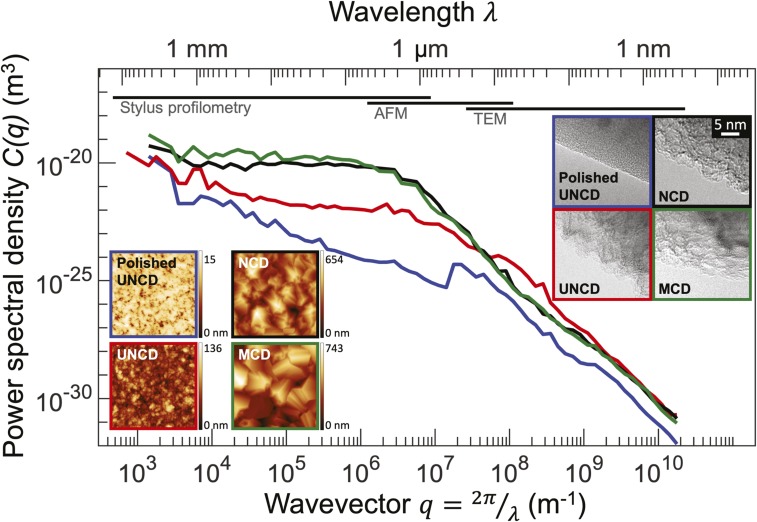
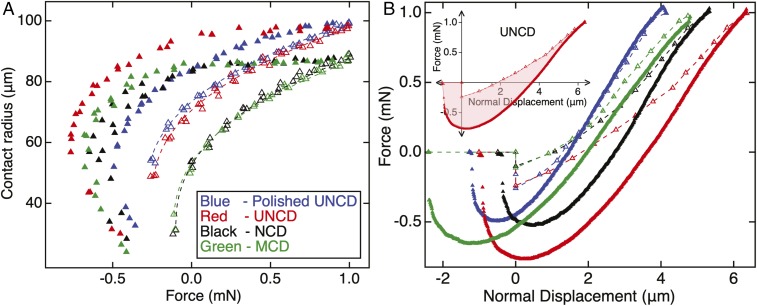
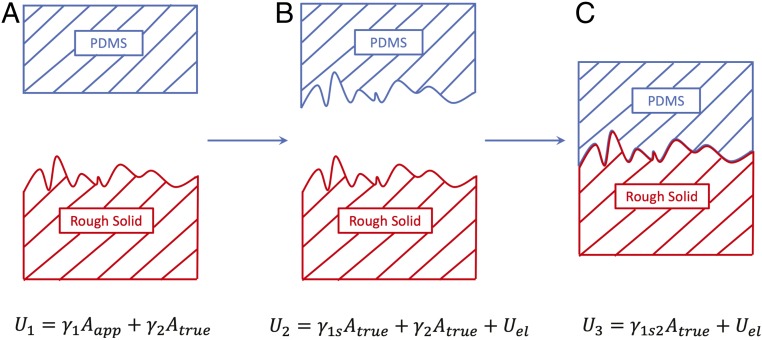
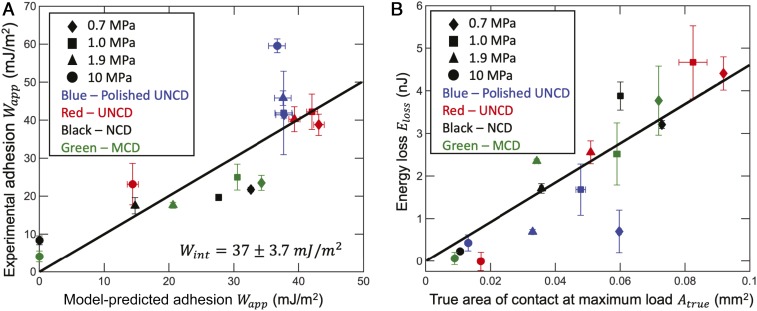
A mechanistic understanding of adhesion in soft materials is critical in the fields of transportation (tires, gaskets, and seals), biomaterials, microcontact printing, and soft robotics. Measurements have long demonstrated that the apparent work of adhesion coming into contact is consistently lower than the intrinsic work of adhesion for the materials, and that there is adhesion hysteresis during separation, commonly explained by viscoelastic dissipation. Still lacking is a quantitative experimentally validated link between adhesion and measured topography. Here, we used in situ measurements of contact size to investigate the adhesion behavior of soft elastic polydimethylsiloxane hemispheres (modulus ranging from 0.7 to 10 MPa) on 4 different polycrystalline diamond substrates with topography characterized across 8 orders of magnitude, including down to the angstrom scale. The results show that the reduction in apparent work of adhesion is equal to the energy required to achieve conformal contact. Further, the energy loss during contact and removal is equal to the product of the intrinsic work of adhesion and the true contact area. These findings provide a simple mechanism to quantitatively link the widely observed adhesion hysteresis to roughness rather than viscoelastic dissipation.
Keywords: adhesion; contact mechanics; multiscale surface roughness; soft matter; surface topography.
Conflict of interest statement
The authors declare no competing interest.
Figures
Similar articles
-
Why soft contacts are stickier when breaking than when making them.Sci Adv. 2024 Mar 8;10(10):eadl1277. doi: 10.1126/sciadv.adl1277. Epub 2024 Mar 6. Sci Adv. 2024. PMID: 38446897 Free PMC article.
-
Small-scale roughness entraps water and controls underwater adhesion.Sci Adv. 2024 Aug 9;10(32):eadn8343. doi: 10.1126/sciadv.adn8343. Epub 2024 Aug 7. Sci Adv. 2024. PMID: 39110787 Free PMC article.
-
Dependence of adhesive friction on surface roughness and elastic modulus.Soft Matter. 2022 Aug 10;18(31):5843-5849. doi: 10.1039/d2sm00163b. Soft Matter. 2022. PMID: 35900052
-
Modeling the surface topography dependence of friction, adhesion, and contact compliance.MRS Bull. 2022;47(12):1221-1228. doi: 10.1557/s43577-022-00468-2. Epub 2023 Jan 18. MRS Bull. 2022. PMID: 36846502 Free PMC article. Review.
-
Surface topography as a material parameter.MRS Bull. 2022;47(12):1205-1210. doi: 10.1557/s43577-022-00465-5. Epub 2023 Jan 31. MRS Bull. 2022. PMID: 36846501 Free PMC article. Review.
Cited by
-
Core-shell dry adhesives for rough surfaces via electrically responsive self-growing strategy.Nat Commun. 2022 Dec 10;13(1):7659. doi: 10.1038/s41467-022-35436-6. Nat Commun. 2022. PMID: 36496484 Free PMC article.
-
Why soft contacts are stickier when breaking than when making them.Sci Adv. 2024 Mar 8;10(10):eadl1277. doi: 10.1126/sciadv.adl1277. Epub 2024 Mar 6. Sci Adv. 2024. PMID: 38446897 Free PMC article.
-
Exploring the dynamics of viscoelastic adhesion in rough line contacts.Sci Rep. 2023 Sep 12;13(1):15060. doi: 10.1038/s41598-023-39932-7. Sci Rep. 2023. PMID: 37699918 Free PMC article.
-
Understanding How Cells Probe the World: A Preliminary Step towards Modeling Cell Behavior?Int J Mol Sci. 2023 Jan 23;24(3):2266. doi: 10.3390/ijms24032266. Int J Mol Sci. 2023. PMID: 36768586 Free PMC article.
-
How surface stress transforms surface profiles and adhesion of rough elastic bodies.Proc Math Phys Eng Sci. 2020 Nov;476(2243):20200477. doi: 10.1098/rspa.2020.0477. Epub 2020 Nov 4. Proc Math Phys Eng Sci. 2020. PMID: 33362416 Free PMC article.
References
-
- Niewiarowski P. H., Stark A. Y., Dhinojwala A., Sticking to the story: Outstanding challenges in gecko-inspired adhesives. J. Exp. Biol. 219, 912–919 (2016). - PubMed
-
- Persson B. N. J., Albohr O., Tartaglino U., Volokitin A. I., Tosatti E., On the nature of surface roughness with application to contact mechanics, sealing, rubber friction and adhesion. J. Phys. Condens. Matter 17, R1–R62 (2005). - PubMed
-
- Luan B., Robbins M. O., The breakdown of continuum models for mechanical contacts. Nature 435, 929–932 (2005). - PubMed
-
- Jacobs T. D. B., et al. , The effect of atomic-scale roughness on the adhesion of nanoscale asperities: A combined simulation and experimental investigation. Tribol. Lett. 50, 81–93 (2013).
Publication types
LinkOut - more resources
Full Text Sources
