. 2019 Nov 26;8(12):69.
doi: 10.1038/s41389-019-0178-3.

Repression of transcription factor AP-2 alpha by PPARγ reveals a novel transcriptional circuit in basal-squamous bladder cancer

Affiliations

Repression of transcription factor AP-2 alpha by PPARγ reveals a novel transcriptional circuit in basal-squamous bladder cancer

Hironobu Yamashita et al. Oncogenesis. .

Abstract

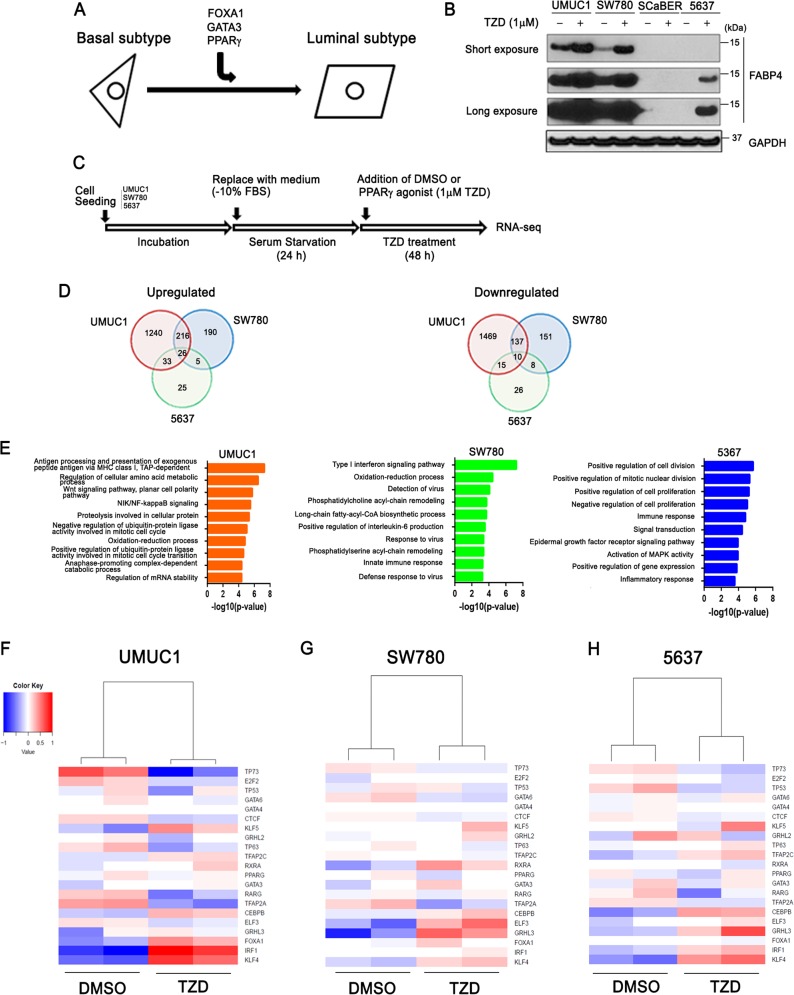
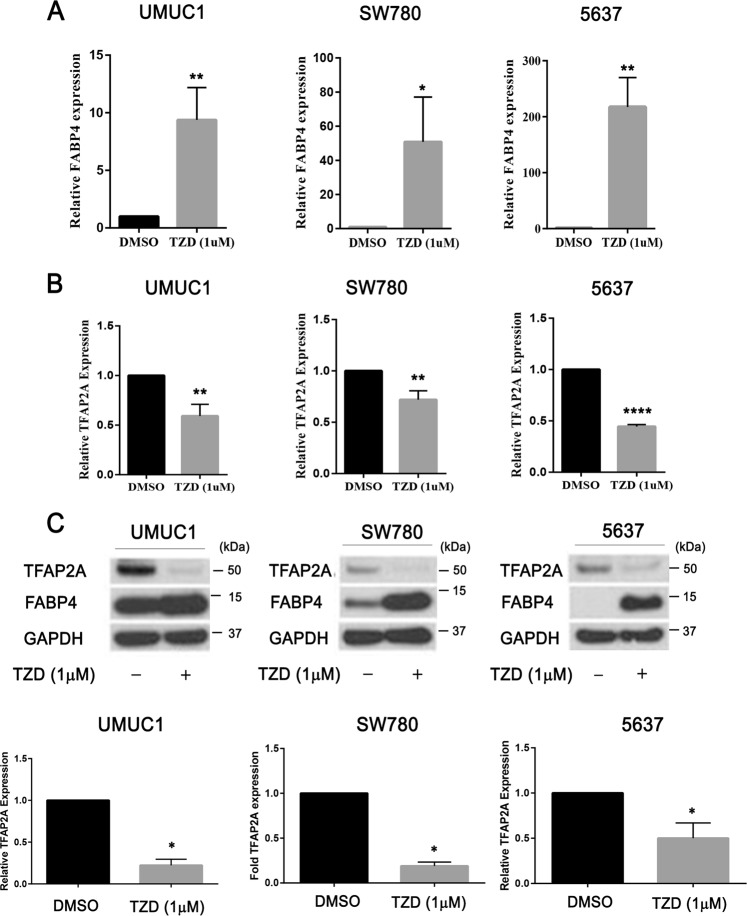
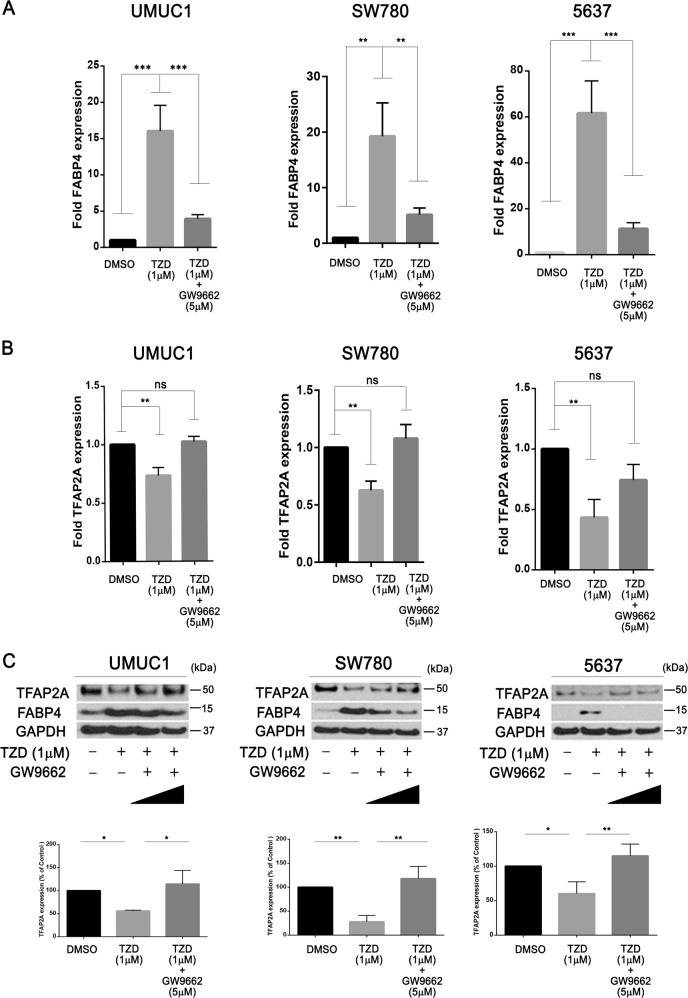
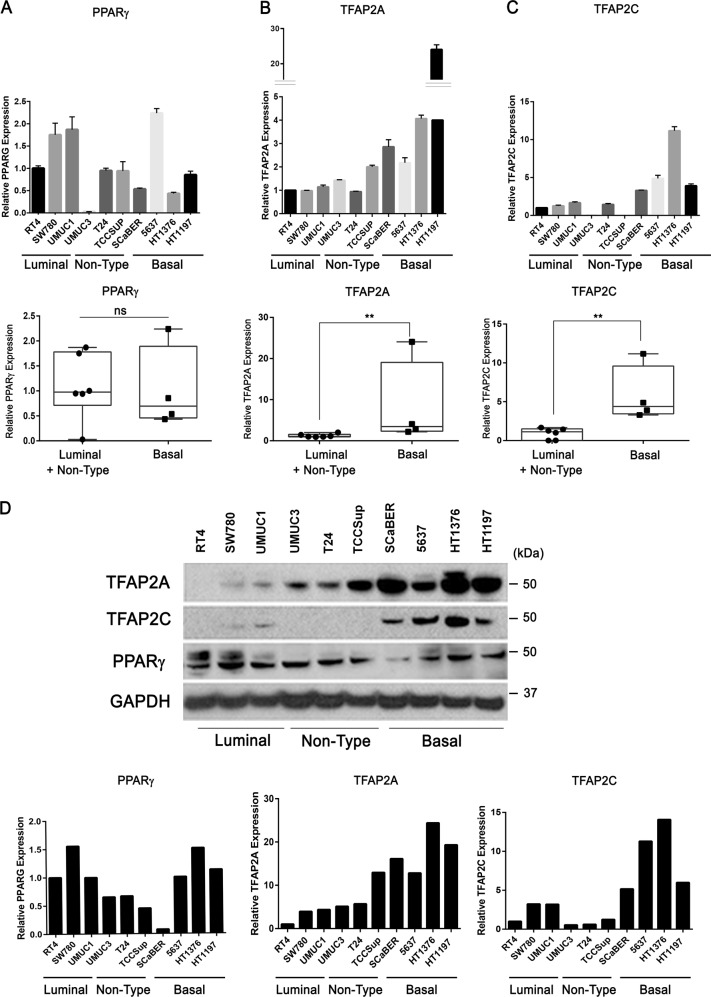
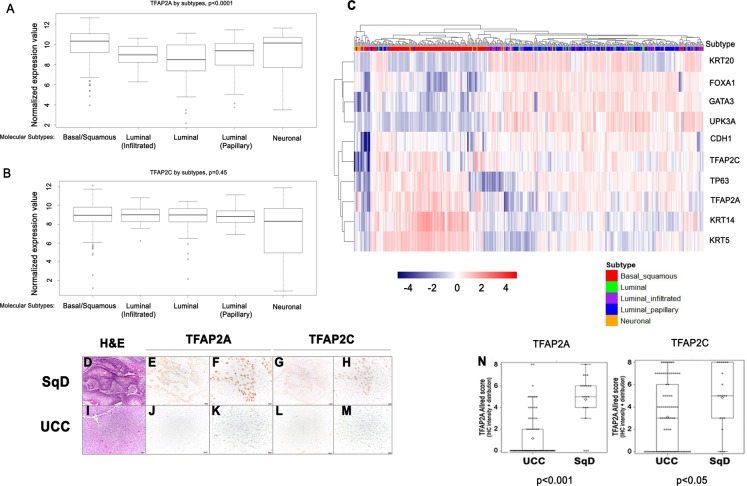
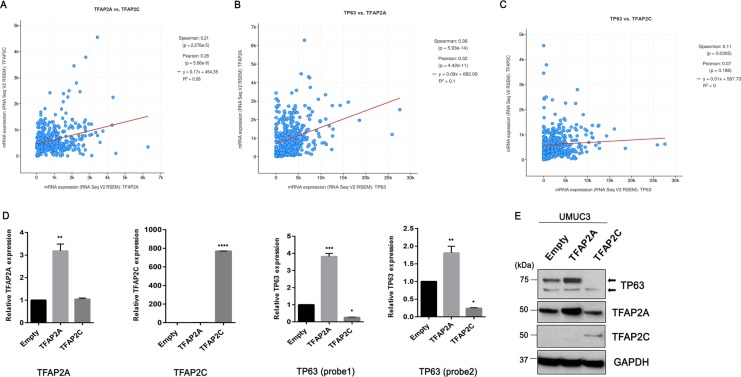
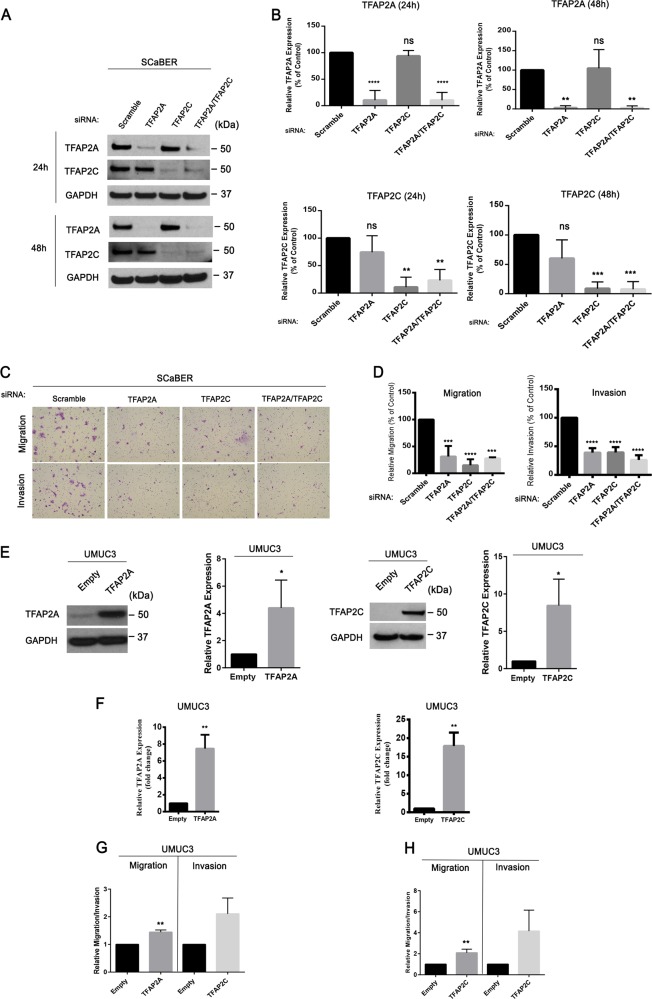
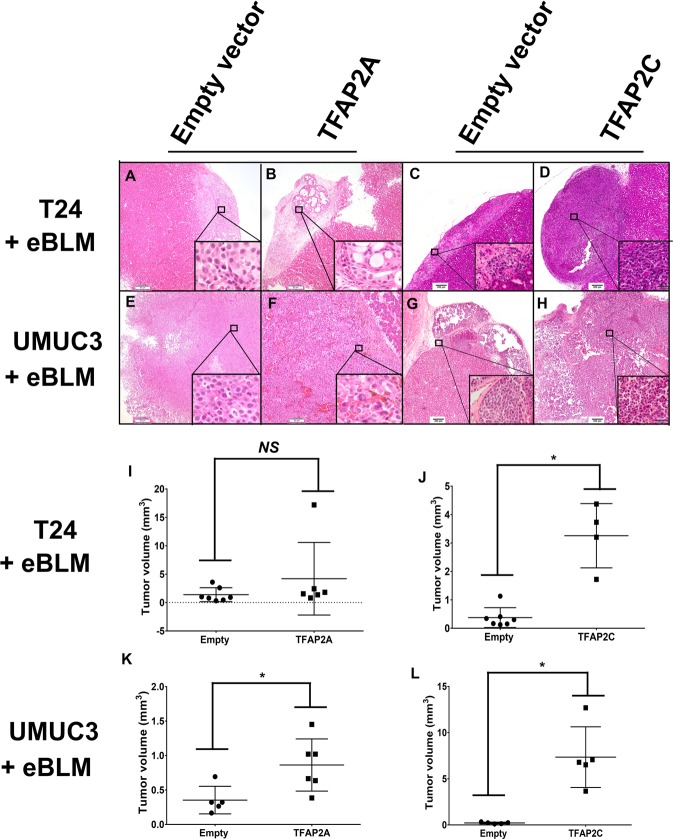
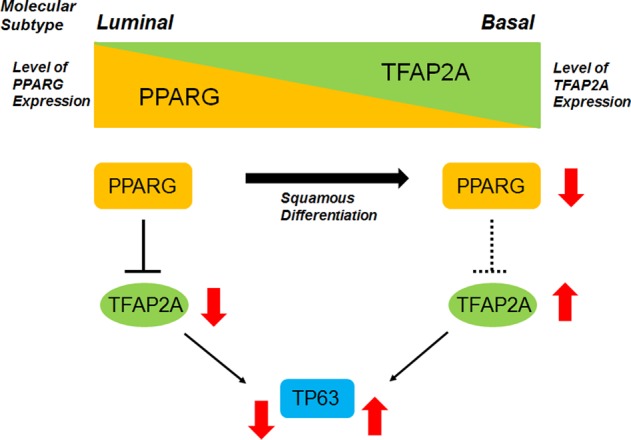
The discovery of bladder cancer transcriptional subtypes provides an opportunity to identify high risk patients, and tailor disease management. Recent studies suggest tumor heterogeneity contributes to regional differences in molecular subtype within the tumor, as well as during progression and following treatment. Nonetheless, the transcriptional drivers of the aggressive basal-squamous subtype remain unidentified. As PPARɣ has been repeatedly implicated in the luminal subtype of bladder cancer, we hypothesized inactivation of this transcriptional master regulator during progression results in increased expression of basal-squamous specific transcription factors (TFs) which act to drive aggressive behavior. We initiated a pharmacologic and RNA-seq-based screen to identify PPARɣ-repressed, basal-squamous specific TFs. Hierarchical clustering of RNA-seq data following treatment of three human bladder cancer cells with a PPARɣ agonist identified a number of TFs regulated by PPARɣ activation, several of which are implicated in urothelial and squamous differentiation. One PPARɣ-repressed TF implicated in squamous differentiation identified is Transcription Factor Activating Protein 2 alpha (TFAP2A). We show TFAP2A and its paralog TFAP2C are overexpressed in basal-squamous bladder cancer and in squamous areas of cystectomy samples, and that overexpression is associated with increased lymph node metastasis and distant recurrence, respectively. Biochemical analysis confirmed the ability of PPARɣ activation to repress TFAP2A, while PPARɣ antagonist and PPARɣ siRNA knockdown studies indicate the requirement of a functional receptor. In vivo tissue recombination studies show TFAP2A and TFAP2C promote tumor growth in line with the aggressive nature of basal-squamous bladder cancer. Our findings suggest PPARɣ inactivation, as well as TFAP2A and TFAP2C overexpression cooperate with other TFs to promote the basal-squamous transition during tumor progression.


Conflict of interest statement

The authors declare that they have no conflict of interest.

Figures

Fig. 1
Fig. 1. Identification of PPARɣ-repressed transcription factors.
a Our previous study shows FOXA1, GATA3, and PPARɣ activation cooperate to “reprogram” a human basal BC cell line (5637) to exhibit a luminal gene expression subtype, thus providing a platform for the identification of PPARɣ-regulated genes. b Western blot analysis of FABP4 in UMUC1, SW780, SCaBER, 5637 cell after 48 h PPARɣ agonist (Rosiglitazone (TZD)) treatment. Short and long exposure of FABP4 were also shown. c Experimental design for PPARɣ activation via TZD treatment in BC cells (see materials and methods). d Venn diagram showing shared and unique sets of significantly upregulated (left) or downregulated (right) genes following 48 h TZD treatment of UMUC1, SW780 and 5637 cells. e GO analysis based on significantly upregulated genes following PPARɣ activation. Biological process by GO analysis based on significantly upregulated genes following PPARɣ activation in UMUC1, SW780, and 5637 cells. Top 10 biological process cetegories of significantly upregulated by PPARɣ activation are shown. The vertical axis shows biological process cetegories, and horizontal axis shows the –log10(P-value). fh Heatmap shows hierarchical clustering of RNA-seq data following treatment of UMUC1 (f), SW780 (g), 5637 (h) with vehicle control (DMSO) or TZD for 48 h. Genes for clustering analysis based on previous studies suggesting a role for urothelial differentiation and/or differential expression in BC molecular subtypes are shown. Expression values are median centered by gene in all heatmap displays.
Fig. 2
Fig. 2. PPARɣ activation represses TFAP2A expression in human bladder cancer cells.
a q-RT-PCR analysis of FABP4 expression levels in UMUC1, SW780, and 5637 cells after 48 h PPARɣ agonist treatment. FABP4 expression was normalized by 18S ribosomal RNA, internal control. Data are expressed as the mean ± S.D. from three independent experiments. *p < 0.05, **p < 0.01 (Student’s t test). b q-RT-PCR analysis of TFAP2A expression levels in UMUC1, SW780 and 5637 cells after 48 h PPARɣ agonist treatment. TFAP2A expression was normalized by 18S ribosomal RNA, internal control. Data are expressed as the mean ± S.D. from three independent experiments. **p < 0.01, ****p < 0.0001 (Student’s t test). c Western blot analysis of TFAP2A protein expression level in UMUC1, SW780, 5637 cells after 48 h PPARɣ agonist treatment. Densitometric analysis of western blot of TFAP2A expression (below). In ac, relative expression levels of FABP4 and TFAP2A mRNA and or/protein after PPARɣ agonist treatment are represented compared with that of DMSO treatment. Data are expressed as the mean ± S.D. from three independent experiments. *p < 0.05 (Student’s t test).
Fig. 3
Fig. 3. Repression of TFAP2A expression via PPARɣ is dependent on a functional receptor.
a, b q-RT-PCR analysis of FABP4 (a) and TFAP2A (b) expression levels in UMUC1, SW780, and 5637 cells after PPARɣ agonist (1 μM) treatment alone or in the presence of the PPARɣ antagonist (5 μM), GW9662. The putative PPARɣ-regulated gene, FABP4 was used as positive control for drug treatments. Relative expression levels of TFAP2A and FABP4 after PPARɣ treatment is represented relative to that of DMSO treatment. Data are expressed as the mean ± S.D. from three independent experiments. **p < 0.01, ***p < 0.001, ns: not significant, one-way ANOVA with post hoc multiple comparison (Tukey). c Western blotting analysis of TFAP2A protein expression levels in UMUC1, SW780, and 5637 cells after PPARɣ agonist (1 μM) treatment alone and in the presence (1 μM and 5 μM) of the PPARɣ antagonist, GW9662. Densitometric analysis of western blotting of TFAP2A expression (below). TFAP2A expression was normalized by GAPDH, internal control. Data are expressed as the mean ± S.D. from three independent experiments. *p < 0.05, **p < 0.01, one-way ANOVA with post hoc multiple comparison (Tukey).
Fig. 4
Fig. 4. TFAP2A and TFAP2C are highly expressed in basal-squamous bladder cancer cell lines.
a–c q-RT-PCR analysis of mRNA expression of PPARɣ (a), TFAP2A (b), and TFAP2C (c) in 10 human BC cell lines. Data are expressed as the mean ± S.D. from three independent experiments. Data of Luminal/Non-Type vs Basal are expressed as the medians ± S.D. **p < 0.01, ns: not significant, Mann–Whitney U test. d Western blot analysis of TFAP2A, TFAP2C, and PPARɣ protein expression in 10 human BC cell lines (Luminal: RT4, SW780, UMUC1/ Non-type: UMUC3, T24, TCCSup/Basal: SCaBER, 5637, HT1376, HT1197). Densitometric analysis of western blotting data is below. TFAP2A, TFAP2C, and PPARɣ expression was normalized by GAPDH, internal control.
Fig. 5
Fig. 5. TFAP2A and TFAP2C expression is associated with basal-squamous human bladder cancer.
a, b Relationship between molecular subtype and expression of TFAP2A and TFAP2C was examined using data compiled through the TCGA bladder cancer study. While TFAP2A (a; Kruskal–Wallis H test; p < 0.0001) expression was significantly elevated in the basal-squamous molecular subtype, TFAP2C (b) expression was not significantly associated with any subtype at the mRNA level. c Hierarchical clustering analysis using data compiled through the same TCGA bladder cancer study shows tumors that express TFAP2A and TFAP2C cluster with tumors expressing additional markers of basal bladder cancer. d–m Representative images of H&E (d, i) and IHC staining for TFAP2A (e, f, j, and k), TFAP2C (g, h, l, and m) from human BC specimens (dh: SqD, UCC: im). n TFAP2A (p < 0.001; Wilcoxon rank sum) and TFAP2C (p < 0.05; Wilcoxon rank sum) protein expression are significantly higher in SqD compared with UCC.
Fig. 6
Fig. 6. TFAP2A is positively correlated with TP63 in human bladder cancer samples and also positively regulates TP63 expression in human bladder cancer cell.
a–c Spearman’s rank correlation analysis between TFAP2A and TFAP2C (a), TFAP2A and TP63 (b), TFAP2C and TP63 (c) mRNA in human bladder urothelial carcinoma. d q-RT-PCR of TP63, TFAP2A, TFAP2C in TFAP2A or TFAP2C overexpresssing UMUC3 cells. Probe1 and 2 for TP63 were used to detect the boundary of exon 1–2 (full length) and exon 4–5, 6–7 (both full length and variants), respectively. Data are expressed as the mean ± S.D. from twice independent experiments. *p < 0.05, **p < 0.01, ***p < 0.001, ****p < 0.0001, one-way ANOVA with post hoc multiple comparison (Dunnett). e Western blot analysis of TP63, TFAP2A, TFAP2C in TFAP2A or TFAP2C overexpresssing UMUC3 cells. Arrow shows full length (~75 kDa) and variants, respectively.
Fig. 7
Fig. 7. Expression of TFAP2A and TFAP2C influences BC cell migration and invasion.
a Western blotting analysis of TFAP2A and TFAP2C expression in SCaBER cells after siRNA transfection. SiRNAs included Scrambled (negative control), as well as constructs targeting TFAP2A and TFAP2C individually and in combination. b Densitometric analysis of western blotting results for TFAP2A and TFAP2C expression for data depicted in (a). TFAP2A and TFAP2C expression was normalized to GAPDH. Data are expressed as the mean ± S.D from three independent experiments. **p < 0.01, ***p < 0.001, ****p < 0.0001, one-way ANOVA with post hoc multiple comparison (Dunnett). c Representative images following migration and Invasion assays using SCaBER cells transfected with siRNA for Scrambled construct, TFAP2A, TFAP2C, and TFAP2A/TFAP2C. d Relative migration and invasion of SCaBER cells transfected with siRNA. Data are expressed as the mean ± S.D. from three independent experiments. ***p < 0.001, ****p < 0.0001, one-way ANOVA with post hoc multiple comparison (Dunnett). e Western blotting analysis of TFAP2A and TFAP2C protein expression levels in UMUC3 cells overexpressing TFAP2A (left) or TFAP2C (right). Also included is densitometric analysis of western blotting data for TFAP2A and TFAP2C. f q-RT-PCR analysis of TFAP2A and TFAP2C expression in UMUC3 cells overexpressing TFAP2A and TFAP2C. g Migration and Invasion assay of UMUC3 stable cells overexpressing TFAP2A. h Migration and Invasion assay of UMUC3 cell overexpressing TFAP2C. Data are expressed as the mean ± S.D. from three independent experiments. **p < 0.01 (Student’s t test).
Fig. 8
Fig. 8. Overexpression of TFAP2A or TFAP2C in bladder cancer cell promotes tumorigenicity in tissue recombination xenografting assays.
Following genetic manipulation and recombination with embryonic rat bladder mesenchyme, tissue recombinants were inserted underneath the renal capsule as described in materials and methods. a–d Hematoxylin and eosin staining of T24 cells engineered to stably express empty vector (a) or TFAP2A (b), empty vector (c) or TFAP2C (d). e–h Hematoxylin and eosin staining of UMUC3 cells engineered to stably express empty vector (e) or TFAP2A (f), empty vector (g) or TFAP2C (h). Overexpression of TFAP2A in T24 had no significant effect on tumor volume in the tissue recombination assay (i), while overexpression of TFAP2C significantly increased tumor volume of T24 recombinants (j). Overexpression of TFAP2A (k) and TFAP2C (l) significantly increased tumor volume of UMUC3 recombinants. Data are expressed as the medians ± S.D. *p < 0.05, **p < 0.01, ns: not significant, Mann–Whitney U test.
Fig. 9
Fig. 9. Schematic diagram of hypothetical model in this study.
During BC progression, squamous differentiation (SqD) was often obsearved in advanced bladder cancer. Molecular basal subtypes is relatively associated with SqD than luminal subtypes. In luminal subtypes, TFAP2A expression is repressed by PPARɣ receptor. On the other hand, TFAP2A is expressed in basal subtypes due to the loss or malfunction of PPARɣ in terms of the capabilities to repress TFAP2A. TFAP2A upregulates TP63 expression and cooperates to induce SqD with TP63 as well as other factors in basal subtypes of human BC.

References

    1. Al-Ahmadie HA, et al. Frequent somatic CDH1 loss-of-function mutations in plasmacytoid variant bladder cancer. Nat. Genet. 2016;48:356–358. doi: 10.1038/ng.3503. - DOI - PMC - PubMed
    1. Guo CC, et al. Gene expression profile of the clinically aggressive micropapillary variant of bladder cancer. Eur. Urol. 2016;70:611–620. doi: 10.1016/j.eururo.2016.02.056. - DOI - PMC - PubMed
    1. Thomsen MBH, et al. Comprehensive multiregional analysis of molecular heterogeneity in bladder cancer. Sci. Rep. 2017;7:11702. doi: 10.1038/s41598-017-11291-0. - DOI - PMC - PubMed
    1. Hedegaard J, et al. Comprehensive transcriptional analysis of early-stage urothelial carcinoma. Cancer Cell. 2016;30:27–42. doi: 10.1016/j.ccell.2016.05.004. - DOI - PubMed
    1. Hovelson Daniel H., Udager Aaron M., McDaniel Andrew S., Grivas Petros, Palmbos Phillip, Tamura Shuzo, Lazo de la Vega Lorena, Palapattu Ganesh, Veeneman Brendan, El-Sawy Layla, Sadis Seth E., Morgan Todd M., Montgomery Jeffrey S., Weizer Alon Z., Day Kathleen C., Neamati Nouri, Liebert Monica, Keller Evan T., Day Mark L., Mehra Rohit, Tomlins Scott A. Targeted DNA and RNA Sequencing of Paired Urothelial and Squamous Bladder Cancers Reveals Discordant Genomic and Transcriptomic Events and Unique Therapeutic Implications. European Urology. 2018;74(6):741–753. doi: 10.1016/j.eururo.2018.06.047. - DOI - PubMed