. 2019 Nov 26;9(1):17598.
doi: 10.1038/s41598-019-53876-x.

Radiosafe micro-computed tomography for longitudinal evaluation of murine disease models

Affiliations

Radiosafe micro-computed tomography for longitudinal evaluation of murine disease models

Nathalie Berghen et al. Sci Rep. .

Abstract

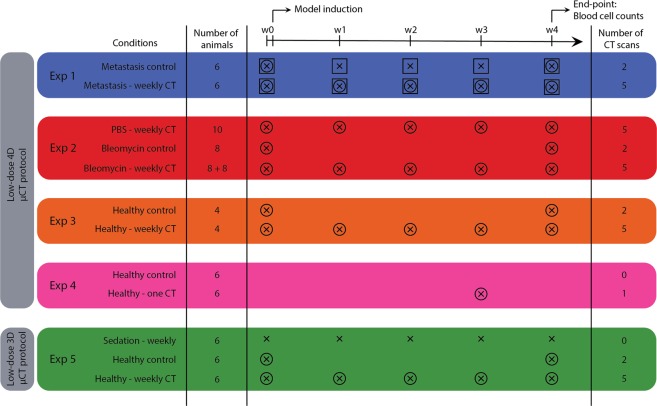
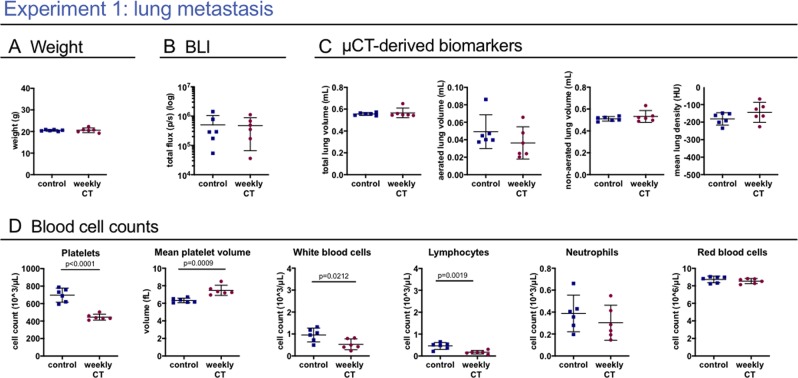
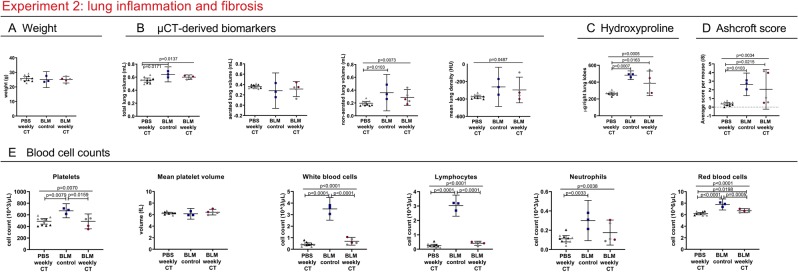
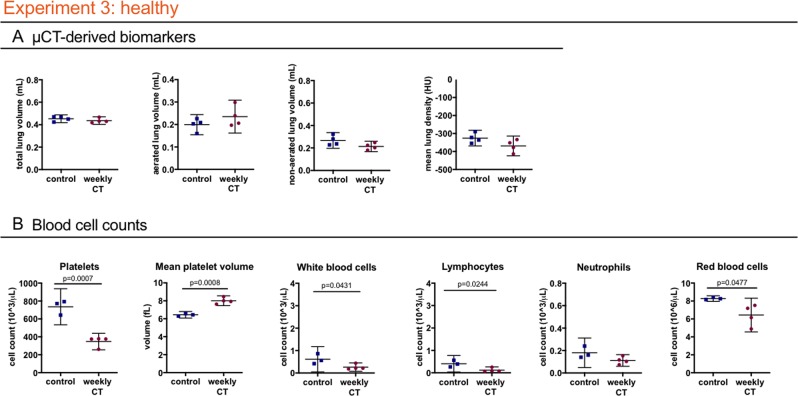
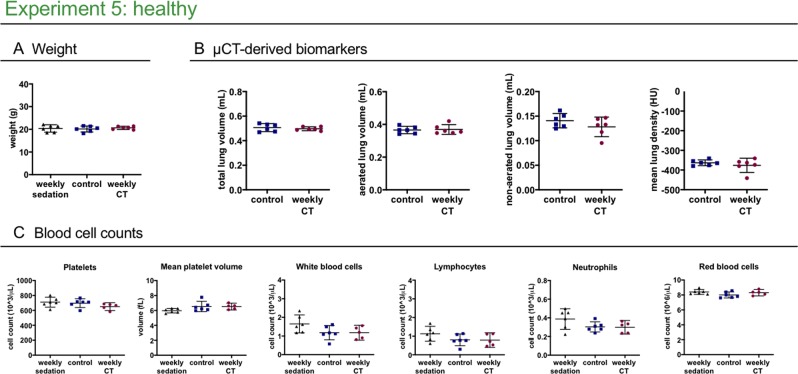
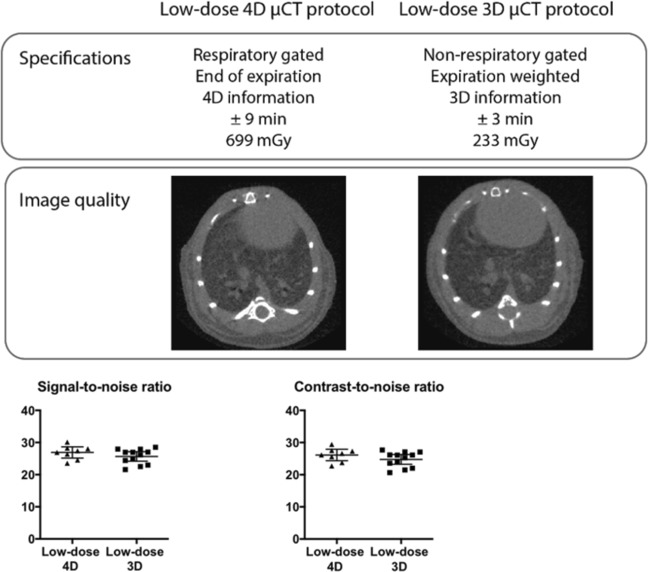
Implementation of in vivo high-resolution micro-computed tomography (µCT), a powerful tool for longitudinal analysis of murine lung disease models, is hampered by the lack of data on cumulative low-dose radiation effects on the investigated disease models. We aimed to measure radiation doses and effects of repeated µCT scans, to establish cumulative radiation levels and scan protocols without relevant toxicity. Lung metastasis, inflammation and fibrosis models and healthy mice were weekly scanned over one-month with µCT using high-resolution respiratory-gated 4D and expiration-weighted 3D protocols, comparing 5-times weekly scanned animals with controls. Radiation dose was measured by ionization chamber, optical fiberradioluminescence probe and thermoluminescent detectors in a mouse phantom. Dose effects were evaluated by in vivo µCT and bioluminescence imaging read-outs, gold standard endpoint evaluation and blood cell counts. Weekly exposure to 4D µCT, dose of 540-699 mGy/scan, did not alter lung metastatic load nor affected healthy mice. We found a disease-independent decrease in circulating blood platelets and lymphocytes after repeated 4D µCT. This effect was eliminated by optimizing a 3D protocol, reducing dose to 180-233 mGy/scan while maintaining equally high-quality images. We established µCT safety limits and protocols for weekly repeated whole-body acquisitions with proven safety for the overall health status, lung, disease process and host responses under investigation, including the radiosensitive blood cell compartment.


Conflict of interest statement

The authors declare no competing interests.

Figures

Figure 1
Figure 1
Experimental set-up. This scheme summarizes isoflurane sedation, number and timing of BLI and µCT scans, model induction and number of animals in each experimental group. Experiment 1 compares mice with lung metastasis (DBA/2 strain) that underwent µCT-scans at baseline and weekly after metastasis induction for 4 weeks, with a metastasis group that was scanned with µCT only at baseline and endpoint. The lung metastasis burden in both groups was monitored with weekly BLI scans. Experiment 2 compares bleomycin- (8 mice with 0.04 U and 8 mice with 0.05 U bleomycin) and sham-instilled mice (5 + 5 mice) of the C57Bl/6 strain that were weekly µCT-scanned with a bleomycin control group (8 mice) that was only scanned at baseline and endpoint. Experiment 3 focuses on the effect of weekly µCT scans without the presence of disease. Analogous to experiment 1, healthy DBA/2 mice received either only a µCT scan at the beginning and at the end of the experiment or weekly scans for the entire experiment duration. In experiment 4, mice (C57Bl/6 strain) scanned once are compared for delayed effects after one week with mice receiving zero scans. Experiment 5 investigates the potential effect of the low-dose 3D µCT protocol after 5 weekly µCT scans compared to one scan at the beginning and one at the end. A third control group was included that was sedated with isoflurane and handled as all other mice but did not receive any µCT scans. (x = isoflurane, ○ = µCT scan, □ = BLI scan)
Figure 2
Figure 2
Weekly low-dose 4D μCT does not influence the general health and disease outcomes but induces a sub-clinical decrease in white blood cell and platelet counts in a murine metastasis model. Experiment 1: weekly low-dose 4D µCT scanning of metastasis-bearing mice induces a decrease in circulating platelets, increase in mean platelet volume, decrease in red blood cells and absolute white blood cell count, due to a decrease in number of lymphocytes. (A) Mouse body weight at end point. (B) In vivo BLI signal intensity expressed as total flux (p/s) from the lung, measuring metastatic load. (C) µCT-derived biomarkers (total lung volume, aerated lung volume, non-aerated lung volume and mean lung density). (D) Selected blood cell parameters: absolute platelet cell count, mean platelet volume, white blood cell count, lymphocyte count and neutrophil count and red blood cell count. Data are presented as individual values, group mean and 95% confidence intervals. P-values are presented in the graph when p < 0.05. HU, Hounsfield units.
Figure 3
Figure 3
Weekly low-dose 4D μCT alters blood cell counts in a bleomycin-induced mouse model. Experiment 2: weekly-repeated 4D µCT scanning of bleomycin induced mice results in a decrease in platelets, red blood cells and a decrease in white blood cells, attributed to decreased lymphocyte counts. (A) Mouse body weight at end point (B) µCT-derived biomarkers reflecting disease progression of pulmonary fibrosis at endpoint (total lung volume, aerated lung volume, non-aerated lung volume and mean lung signal density). (C) Collagen content as measured by hydroxyproline quantification of the right lung lobes and (D) Ashcroft score of extent of fibrosis of the left lung lobes (E) selected blood cell counts: absolute platelet cell count, mean platelet volume, white blood cell count, lymphocyte count and neutrophil count and red blood cell count. Data presented as individual values, group mean and 95% confidence intervals. Grey points represent mice instilled with 0.04 U of bleomycin, other points with 0.05 U. P-values and p-adjusted values are presented in the graph when p < 0.05. HU, Hounsfield unit.
Figure 4
Figure 4
Weekly low-dose 4D μCT does not influence the general health and disease outcomes but induces a decrease in blood cell counts of healthy mice. Experiment 3: weekly low-dose 4D µCT scanning of healthy mice induces a decrease in platelets, increase in mean platelet volume, decrease in red blood cells and white blood cells, attributed to decreased lymphocyte counts. (A) µCT-derived biomarkers show no differences in healthy mice at endpoint (total lung volume, aerated lung volume, non-aerated lung volume and mean lung density). (B) Blood cell counts: absolute platelet cell count, mean platelet volume, white blood cell count, lymphocyte count and neutrophil count and red blood cell count. Data presented as individual values, group median and 95% confidence intervals. P- values are presented in the graph when p < 0.05. HU, Hounsfield unit.
Figure 5
Figure 5
A low-dose 4D µCT scan does not affect blood cell counts one week after scanning. Experiment 4: No differences are found in circulating blood cell counts between healthy control and scanned mice at endpoint, i.e. 1 week after the scan. Data presented as individual values, group mean and 95% confidence intervals. P-values are presented in the graph when p < 0.05.
Figure 6
Figure 6
Weekly low-dose 3D μCT is devoid of any effects on health, lung readouts and circulating blood cell counts. Experiment 5 compares healthy mice scanned weekly or only at baseline and endpoint, and mice that underwent weekly isoflurane anaesthetics and handling without undergoing any µCT scans to isolate a potential effect from stress and anaesthesia from an effect of the x-ray dose associated with a µCT scan (weekly sedation). (A) Mouse body weight at end point. (B) µCT-derived biomarkers show no difference at endpoint (total lung volume, aerated lung volume, non-aerated lung volume and mean lung density) between the healthy control and healthy weekly scanned group. (C) selected blood cell counts: weekly low-dose 3D µCT scanning or weekly isoflurane sedation does not change the platelet, white blood cell or red blood cell counts. Data presented as individual values, group mean and 95% confidence intervals. P-values and p-adjusted values are presented in the graph when p < 0.05.
Figure 7
Figure 7
Low-dose expiration-weighted 3D µCT yields equally high image quality as a 4D respiratory-gated protocol. (A) Specifications of the 3D and 4D imaging protocols compared with representative reconstructed tomographic images at the level of lung and heart for both protocols, along with graphs of (B) signal-to-noise ratio and contrast-to-noise ratio compared for the respiratory-gated 4D (n = 8) and the expiration-weighted 3D µCT protocol (n = 12). Data presented as individual values, group mean and 95% confidence intervals.

References

    1. Marien E, Hillen A, Vanderhoydonc F, Swinnen JV, Vande Velde G. Longitudinal microcomputed tomography-derived biomarkers for lung metastasis detection in a syngeneic mouse model: added value to bioluminescence imaging. Laboratory Investigation. 2017;97:24–33. doi: 10.1038/labinvest.2016.114. - DOI - PubMed
    1. De Langhe E, et al. Quantification of lung fibrosis and emphysema in mice using automated micro-computed tomography. PLoS One. 2012;7:e43123. doi: 10.1371/journal.pone.0043123. - DOI - PMC - PubMed
    1. Vande Velde G, et al. Longitudinal micro-CT provides biomarkers of lung disease and therapy in preclinical models, thereby revealing compensatory changes in lung volume. Dis Model Mech. 2016;9:91–98. doi: 10.1242/dmm.020321. - DOI - PMC - PubMed
    1. Sasaki M, et al. Evaluation of cigarette smoke- induced emphysema in mice using quantitative micro- computed tomography. American journal of physiology. Lung cellular and molecular physiology. 2015;308:L1039. doi: 10.1152/ajplung.00366.2014. - DOI - PubMed
    1. Lederlin, M. et al. In Vivo Micro- CT Assessment of Airway Remodeling in a Flexible OVA- Sensitized Murine Model of Asthma (In Vivo Micro- CT Assessment of Airway Remodeling). 7, e48493, 10.1371/journal.pone.0048493 (2012). - PMC - PubMed

Publication types

MeSH terms