. 2020 Feb;30(2):163-178.
doi: 10.1038/s41422-019-0257-1. Epub 2019 Nov 26.

ILF3 is a substrate of SPOP for regulating serine biosynthesis in colorectal cancer

Affiliations

ILF3 is a substrate of SPOP for regulating serine biosynthesis in colorectal cancer

Kai Li et al. Cell Res. 2020 Feb.

Abstract

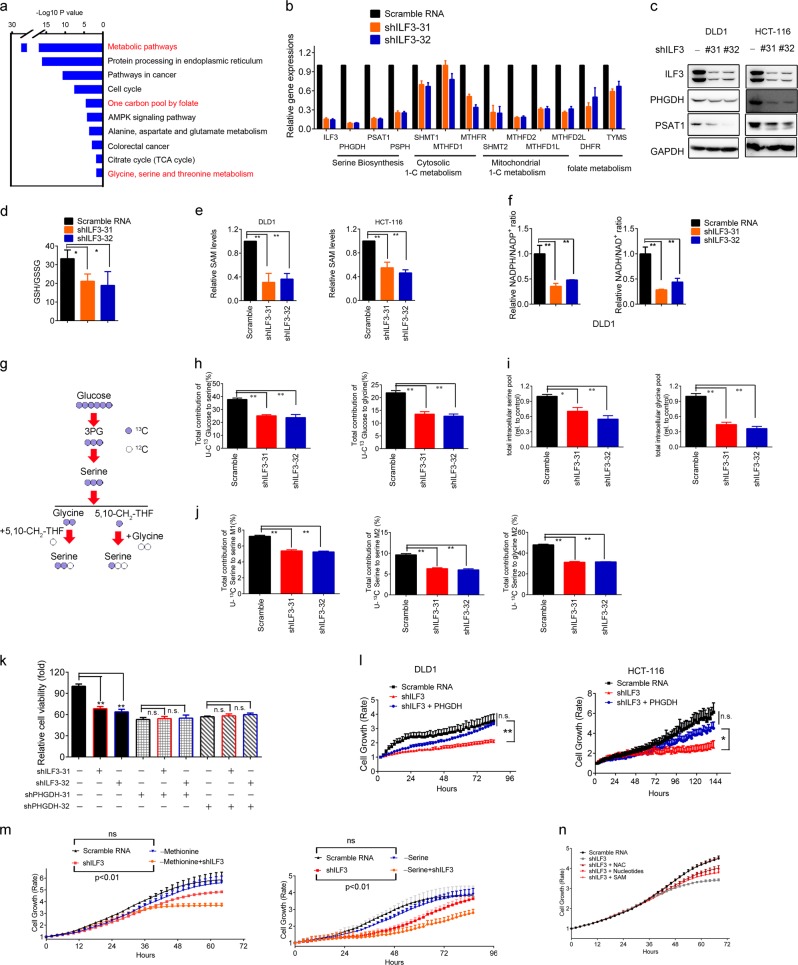
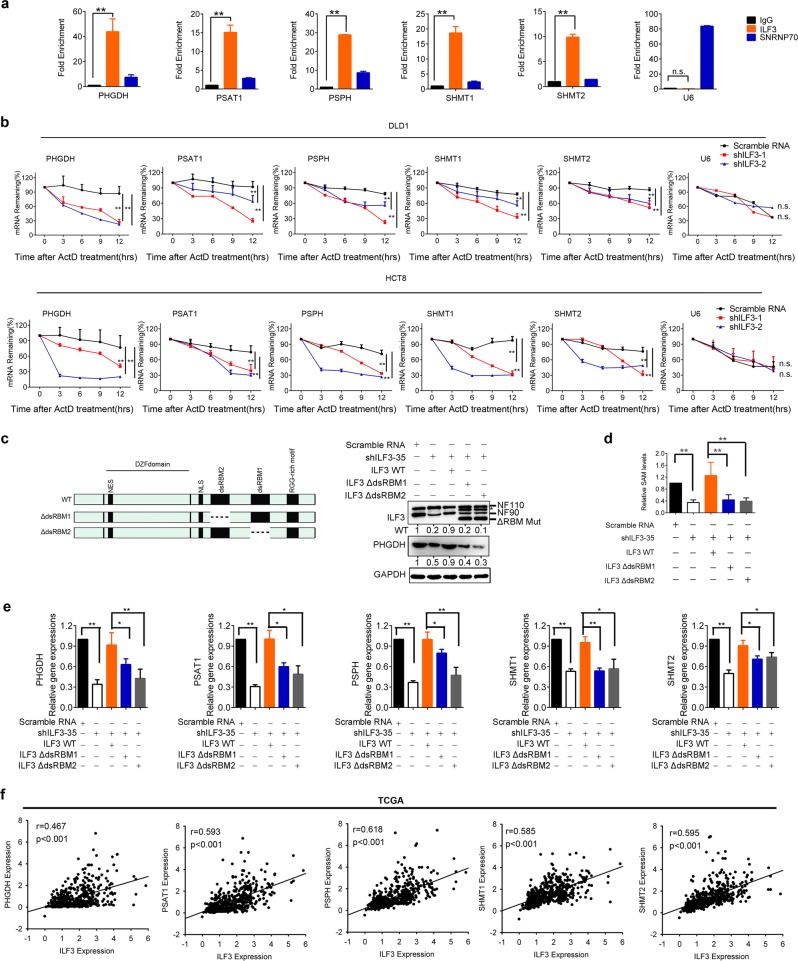
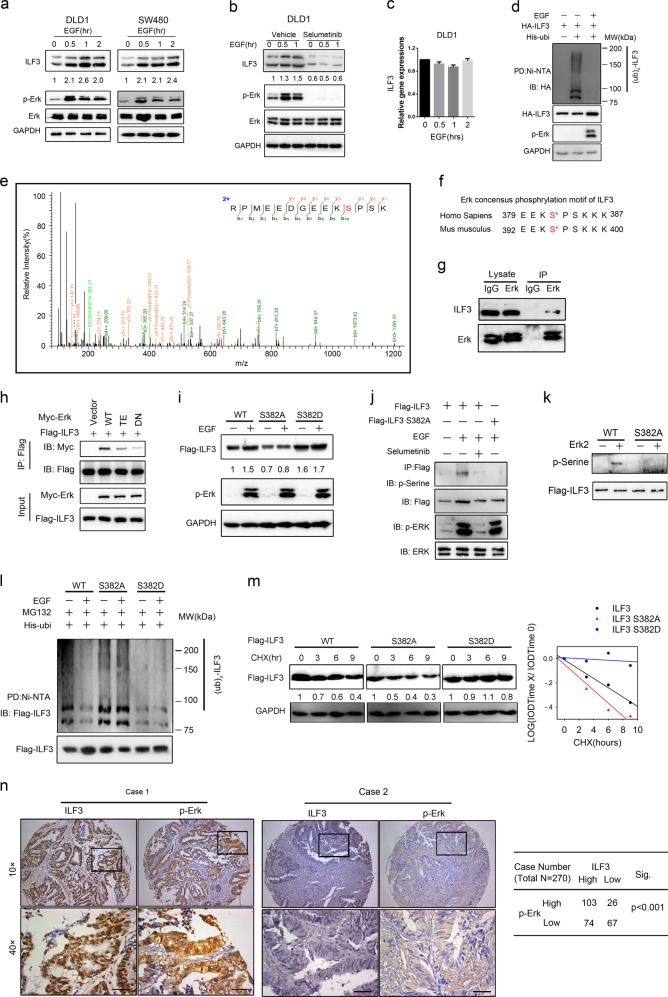
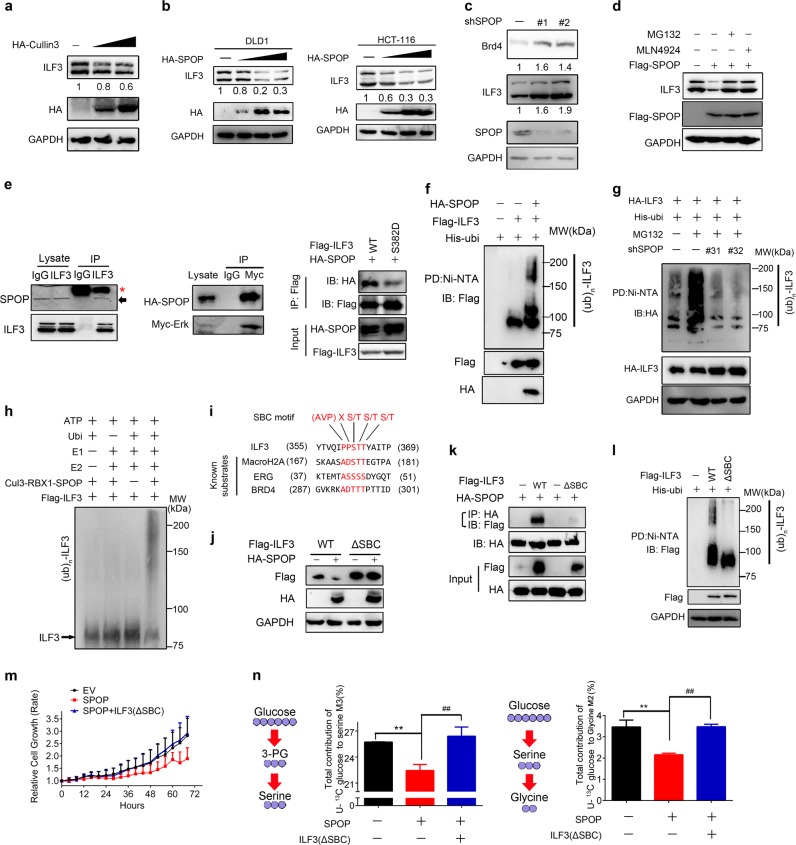
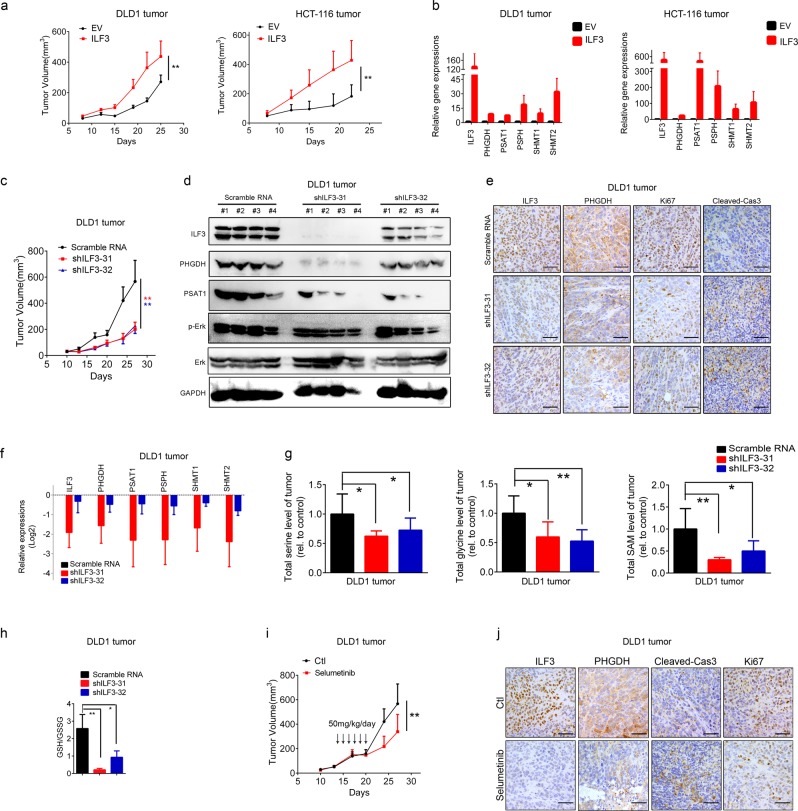
The Serine-Glycine-One-Carbon (SGOC) pathway is pivotal in multiple anabolic processes. Expression levels of SGOC genes are deregulated under tumorigenic conditions, suggesting participation of oncogenes in deregulating the SGOC biosynthetic pathway. However, the underlying mechanism remains elusive. Here, we identified that Interleukin enhancer-binding factor 3 (ILF3) is overexpressed in primary CRC patient specimens and correlates with poor prognosis. ILF3 is critical in regulating the SGOC pathway by directly regulating the mRNA stability of SGOC genes, thereby increasing SGOC genes expression and facilitating tumor growth. Mechanistic studies showed that the EGF-MEK-ERK pathway mediates ILF3 phosphorylation, which hinders E3 ligase speckle-type POZ protein (SPOP)-mediated poly-ubiquitination and degradation of ILF3. Significantly, combination of SGOC inhibitor and the anti-EGFR monoclonal antibody cetuximab can hinder the growth of patient-derived xenografts that sustain high ERK-ILF3 levels. Taken together, deregulation of ILF3 via the EGF-ERK signaling plays an important role in systemic serine metabolic reprogramming and confers a predilection toward CRC development. Our findings indicate that clinical evaluation of SGOC inhibitor is warranted for CRC patients with ILF3 overexpression.


Conflict of interest statement

The authors declare no competing interests.

Figures

Fig. 1
Fig. 1
Identification of ILF3 as a poor prognosis marker in CRC. a Principal component analysis of microarrays from three paired CRC and normal tissue samples. PC1 and PC2 explain 66.79% and 18.99% of the variation, respectively. b Volcano plot analysis of different gene expressions after knockdown of ILF3 (P < 0.05, ∣fold change∣ > 3). c Heatmap of the top 50 genes that were upregulated in CRC. The color scale indicates a log2 ratio of the normalized hybridization signal intensities of the upregulated genes. d Waterfall plot of the relative ILF3 mRNA levels from 34 paired samples of CRC and normal tissue measured using qRT-PCR. e Expression of ILF3 in 79 paired normal and CRC tissue samples. f Representative images of ILF3 IHC staining in human colon cancer and adjacent normal colon tissue. Scale bars, 50 μm. gi Kaplan–Meier survival curves based on ILF3 expression in the CRC tissues of the testing and validation cohorts. The receiver operating characteristic curve was used to define the cutoff, and log-rank analysis was used to test for significance.
Fig. 2
Fig. 2
Activation of de novo serine biosynthesis in ILF3-dependent CRC. a Gene categories significantly (P 0.05) enriched for genes deregulated in metabolism, owing to knockdown of ILF3 in the CRC cell line DLD1. b Gene abundance of the serine biosynthesis pathway after knockdown of ILF3 using shRNA. The data are presented as the means ± SD. c Immunoblot analysis of serine synthesis pathway proteins (PHGDH and PSAT1) after knockdown of ILF3 using shRNA. d Relative ratios of reduced to oxidized glutathione (GSH/GSSG) in cell lines determined by LC–MS/MS. e Measurement of SAM in DLD1 and HCT-116 cells transduced with ILF3 shRNA. f Measurement of NADPH/NADP+ and NADH/NAD+ levels in DLD1 cells with or without ILF3 KD. g Schematic metabolic map of [U-13C-labeled serine metabolism. h Incorporation of carbon-13 (13C) from [U-13C] glucose (11 mM) into the indicated metabolites at 24 h in DLD1 cells. The data are presented as the means ± SD. i Intracellular pool levels of serine and glycine at 24 h in DLD1 cells. j Incorporation of carbon-13 (13C) from [U-13C] serine (0.4 mM) into the indicated metabolites at 24 h in DLD1 cells. The data are presented as the means ± SD. k Relative cell growth rate of DLD1 cells transduced with the indicated constructs. l Relative cell growth rate of DLD1 and HCT-116 cells transduced with the indicated constructs. m Relative cell growth rate of DLD1 and HCT-116 cells cultured with or without serine or methionine. The data are presented as the means ± SD. n Relative cell growth rate of DLD1 cells cultured with or without NAC, nucleotides or SAM upon ILF3 KD. The data are presented as the means ± SD.
Fig. 3
Fig. 3
ILF3 directly regulates SGOC gene mRNA stability. a ILF3 binds to the mRNAs of SGOC pathway genes. RNA immunoprecipitation (RIP) was performed in DLD1 cells using anti-ILF3, anti-SNRNP70 (control) or anti-IgG antibodies, followed by RT-qPCR with primers recognizing the indicated mRNAs. The fold expression of RIP-enriched mRNAs relative to the input was calculated. The data are presented as the means ± SD. b RT-PCR of serine pathway genes in DLD1 and HCT-8 cells transduced with ILF3 shRNA followed by actinomycin D treatment (10 μg/mL) over time. The data are presented as the means ± SD. c A schematic drawing of ILF3 RBM-truncated mutants and their expression. Asterisk indicates non-specific band. d The decreased production of SAM in ILF3 KD cells could be rescued by reintroduction of WT ILF3 but not the ILF3 dsRBM mutants. The data are presented as the means ± SD. **P < 0.01. e The decreased gene expression levels of PHGDH, PSAT1, PSPH, SHMT1 and SHMT2 in ILF3-KD cells could be rescued by reintroduction of ILF3 WT but not RBM-truncated mutants. The data are presented as the means ± SD. *P< 0.05; **P < 0.01. f Correlation analyses of ILF3 and SGOC genes in 521 CRC patients. The human CRC patient dataset was obtained from TCGA.
Fig. 4
Fig. 4
The EGF-ERK axis regulates ILF3 stability and the SGOC network. a Immunoblot analysis of ILF3 protein in cells serum-starved and stimulated with EGF (100 ng/mL). b Immunoblot analysis of ILF3 protein in cells treated with EGF (100 ng/mL) and selumetinib (2 μM). c ILF3 mRNA expression in cells treated with EGF (100 ng/mL). d Immunoblot analysis of ubiquitinated ILF3 protein in DLD1 cells treated with or without EGF (100 ng/mL). MG132 (20 μM) was added to the cells 6 h before they were harvested with guanidine-HCl-containing buffer. The cell lysates were pulled down with nickel beads and immunoblotted with an anti-ILF3 antibody. e MS/MS of the ILF3 S382 phosphorylation site. The fragmentation spectrum of the typical ILF3 peptide RPMEEDGEEKS < phos > PSK (566.9075m/z, 3+) carrying the modification is shown with annotated y-ions (orange) and b-ions (green). The y-ion series covers the phosphorylation site and displays the typical neutral addition of 79.9663 Da (corresponding to the addition of PO3). f Erk consensus phosphorylation motif of ILF3. g Immunoblot analysis of the indicated proteins from immunoprecipitates (IP) obtained from 293T cells with MG132 treatment for 6 h. h Immunoblot analysis of samples from co-IP with anti-Flag antibody in 293T cells transfected with the indicated constructs and treated with 20 µM MG-132 for 6 h. i Immunoblot analysis of ILF3 mutant in 293T cells transfected with the indicated constructs in the presence or absence of EGF. j Immunoblot analysis of samples from co-IP with anti-Flag antibody in 293T cells transfected with the indicated constructs and treated with 20 µM MG-132 for 6 h. k Immunoblot analysis of samples from in vitro kinase assay of Erk2. l Immunoblot analysis of poly-ubiquitinated ILF3 in poly-ubiquitination assays of 293T cells transfected with the indicated constructs and treated with 20 µM MG132 for 6 h. EV, empty vector. m Immunoblot analysis of the ILF3 protein turnover rate in 293T cells treated with cycloheximide (CHX). n Correlation of ILF3, and p-ERK staining in human 270 CRC tissue microarray samples. Representative images are shown.
Fig. 5
Fig. 5
SPOP is the E3 ligase that regulates ILF3 protein stability. a Immunoblot analysis of ILF3 from 293T cells transfected with the HA-Cullin3 plasmid. b Immunoblot analysis of ILF3 from DLD1 and HCT-116 cells transfected with the HA-SPOP plasmid. c Immunoblot analysis of ILF3 from 293T cells transfected with the shSPOP plasmid. d Immunoblot analysis of ILF3 from 293T cells transfected with the Flag-SPOP plasmid in the presence or absence of MG132 or MLN4924. e Immunoblot analysis of the indicated proteins from immunoprecipitates (IP) obtained from 293T cells with MG132 treatment for 6 h. Asterisk, heavy chain. The arrow indicates endogenous SPOP. f, g Immunoblot analysis of poly-ubiquitinated ILF3. Cells were transfected with the indicated constructs and then treated with MG132 for 8 h. The cell lysates were pulled down with nickel beads and immunoblotted with indicated antibody. h Immunoblot of ILF3 in vitro ubiquitination assay by the CUL3–RBX1–SPOP E3 ligase complex. Affinity-purified SPOP complexes were incubated with purified Flag-ILF3 protein, ATP, E1 and E2 enzymes, and his-ubiquitin. i Amino acid sequence alignment of the putative substrate-binding consensus (SBC) motif in ILF3. MacroH2A, ERG and BRD4 are known SPOP substrates containing well-characterized SBC motifs. The amino acids of SBC motifs among the indicated proteins are depicted in red. (AVP) refers to the allowed amino acid groups. (X) denotes any type of residue. j Immunoblot analysis of protein levels of ILF3 constructs from cells transfected with HA-SPOP. k Immunoblot analysis of samples from co-IP with anti-HA antibody in 293T cells transfected with the indicated constructs and treated with 20 µM MG-132 for 6 h. l Immunoblot analysis of poly-ubiquitinated ILF3 in poly-ubiquitination assays of 293T cells transfected with the indicated constructs and treated with 20 µM MG132 for 6 h. EV, empty vector. m Cells were transfected with the indicated constructs and cell proliferation rates were measured. The data are presented as the means ± SD. n Incorporation of carbon-13 (13C) from U[13C] glucose (11 mM) into the indicated metabolites at 24 h in DLD1 cells. The data are presented as the means ± SD. **P< 0.01; ##P< 0.01.
Fig. 6
Fig. 6
ILF3 promotes tumor growth in vivo. a Tumor growth curves of DLD1 (1 × 106) or HCT-116 (1 × 106) colon cancer cells with or without ILF3 overexpression. Cells were subcutaneously injected into nude mice (n = 6). The tumors were isolated at the end of the experiments. b Serine pathway gene expression in the tumor tissues of (a). qRT-PCR analysis was performed to measure the mRNA levels of serine biosynthesis pathway genes. c Measurement of the subcutaneous tumor growth of ILF3-KD DLD1 cells (1 × 107). n= 9/group. The data are presented as the means ± SD. d Immunoblot analysis of protein levels of ILF3, p-Erk, Erk, PHGDH and PSAT1 in the subcutaneous tumor tissues generated in (c). e Representative IHC images of ILF3, PHGDH, Ki-67 and cleaved-Caspase-3 staining in the subcutaneous tumor tissues generated in (c). Scale bars represent 50 μm. f SGOC pathway gene expression after ILF3 KD in subcutaneous tumor tissues generated in (c). The data are presented as the means ± SD. g Measurement of SGOC pathway metabolites in subcutaneous tumor tissues obtained from (c). The data are presented as the means ± SD. *P < 0.05; **P < 0.01. h Relative ratios of reduced to oxidized glutathione (GSH/GSSG) in subcutaneous tumor tissues from (c) determined by LC–MS/MS. i Tumor growth curves of tumors derived from DLD-1 cells that were subcutaneously injected into nude mice (n = 6). Mice were treated with or without indicated amount of selumetinib. Tumor growth curves are shown. The data are presented as the means ± SD. j Representative IHC staining for ILF3, PHGDH, Ki-67 and cleaved-Caspase-3 in tumor tissues from (h). Scale bars represent 50 μm.
Fig. 7
Fig. 7
Impeding the ILF3–SGOC axis suppresses CRC malignant progression in PDO and PDXs. a Bright-field images and quantification of organoids after 14 days of siRNA transfection. Scale bar, 50 μm. b, c Expression level of ILF3 in indicated patient-derived xenografts (PDXs) (b), and treatment schedule of SGOC inhibitor NCT-503 is indicated (c). The mice were treated with NCT-503 (40 mg/kg/day) for 10 days. d Impact of NCT-503 on tumor growth in mice (n = 7/group) bearing indicated PDXs. The data are presented as the means ± SD. e Representative images of PDX growth monitored by PET-CT. The circles indicate PDXs. f Representative immunofluorescent images for TUNEL+ apoptotic signals in PDX tumors and quantitation of apoptotic TUNEL+ tumor cells in PDXs after NCT-503 treatment. Scale bars, 50 μm. TUNEL+ cells were counted and presented as a bar graph. The data are presented as the means ± SD. g Impact of indicated treatments on tumor growth of PDXs. The data are presented as the means ± SD. Treatment schedule of cetuximab and/or NCT-503 is indicated.

References

    1. Siegel RL, Miller KD, Jemal A. Cancer statistics, 2016. CA: Cancer J. Clin. 2016;66:7–30. - PubMed
    1. Kocarnik JM, Shiovitz S, Phipps AI. Molecular phenotypes of colorectal cancer and potential clinical applications. Gastroenterol. Rep. 2015;3:269–276. - PMC - PubMed
    1. Segelov E, et al. Response to cetuximab with or without irinotecan in patients with refractory metastatic colorectal cancer harboring the KRAS G13D mutation: Australasian Gastro-Intestinal Trials Group ICECREAM Study. J. Clin. Oncol. 2016;34:2258–2264. doi: 10.1200/JCO.2015.65.6843. - DOI - PubMed
    1. Fang L, et al. ERK2-dependent phosphorylation of CSN6 is critical in colorectal cancer development. Cancer Cell. 2015;28:183–197. doi: 10.1016/j.ccell.2015.07.004. - DOI - PMC - PubMed
    1. Pavlova NN, Thompson CB. The emerging hallmarks of cancer metabolism. Cell Metab. 2016;23:27–47. doi: 10.1016/j.cmet.2015.12.006. - DOI - PMC - PubMed

Publication types

MeSH terms