

Genomes, expression profiles, and diversity of mitochondria of the White-footed Deermouse Peromyscus leucopus, reservoir of Lyme disease and other zoonoses
- PMID: 31772306
- PMCID: PMC6879569
- DOI: 10.1038/s41598-019-54389-3
Genomes, expression profiles, and diversity of mitochondria of the White-footed Deermouse Peromyscus leucopus, reservoir of Lyme disease and other zoonoses
Abstract
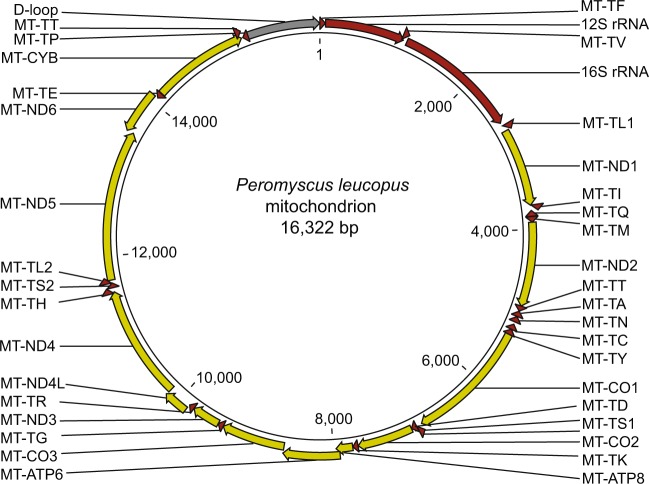
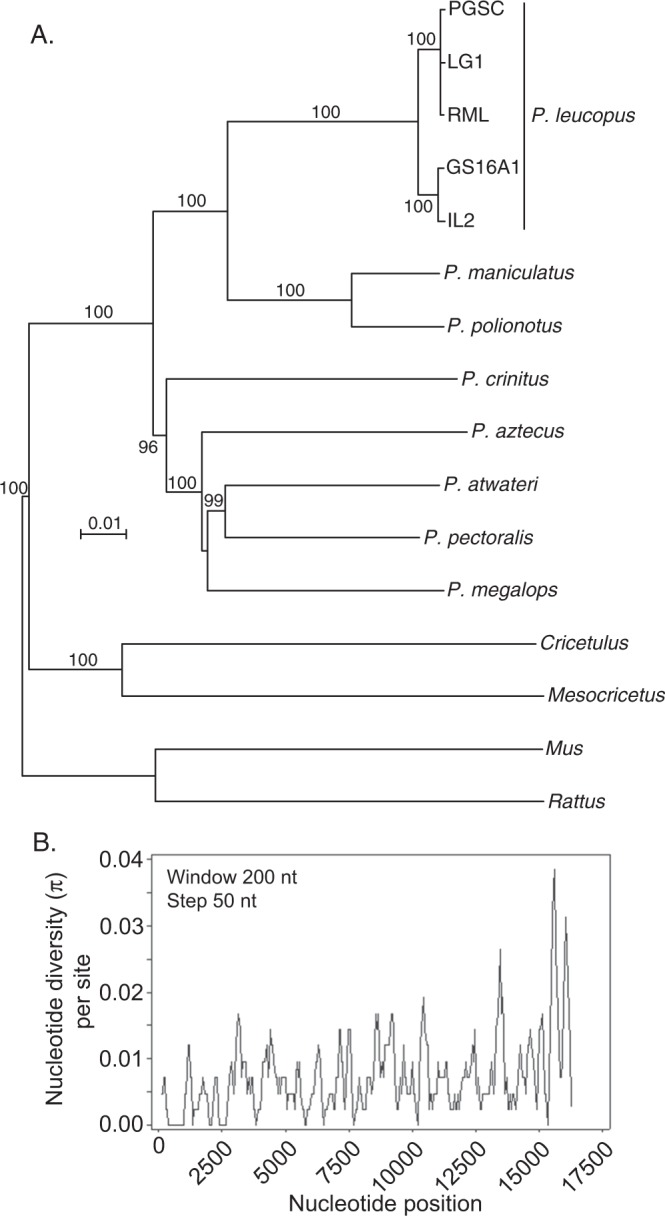
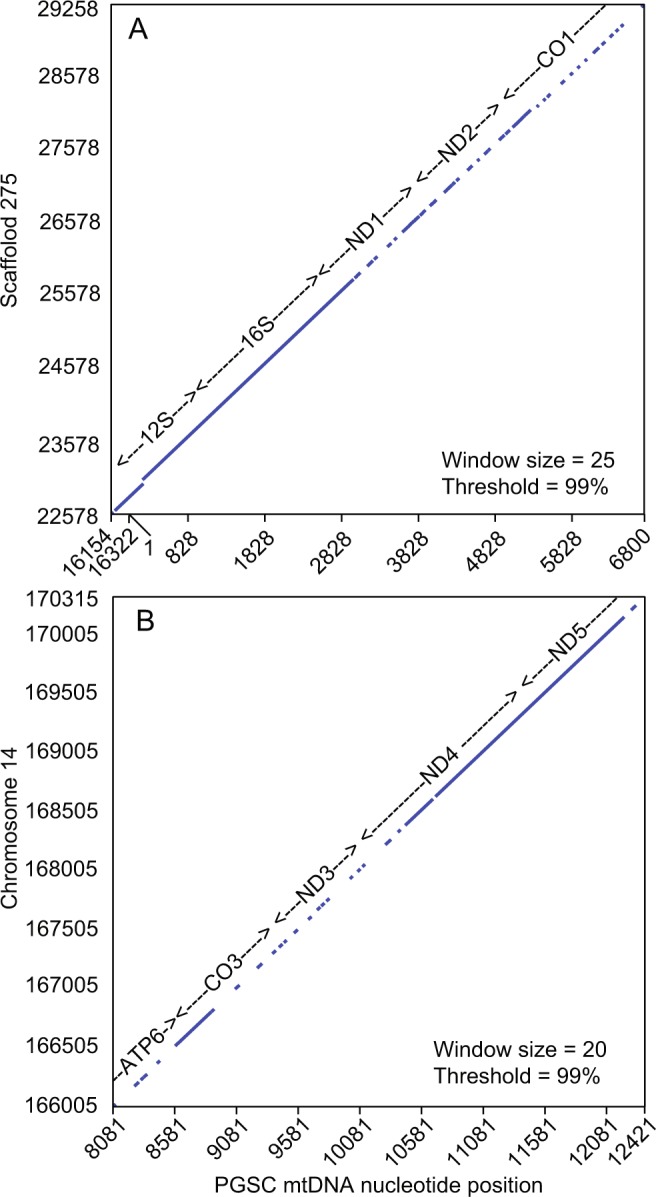
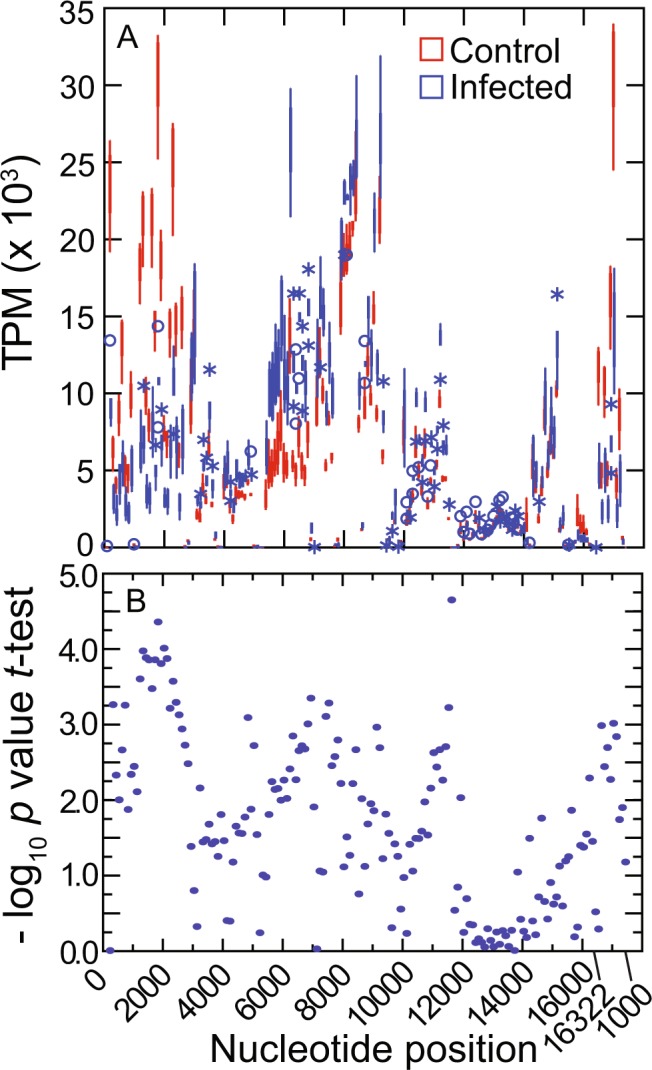
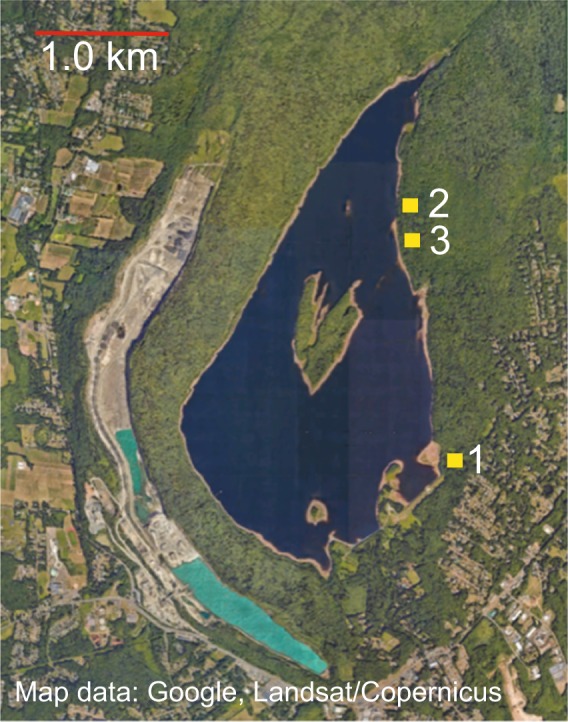
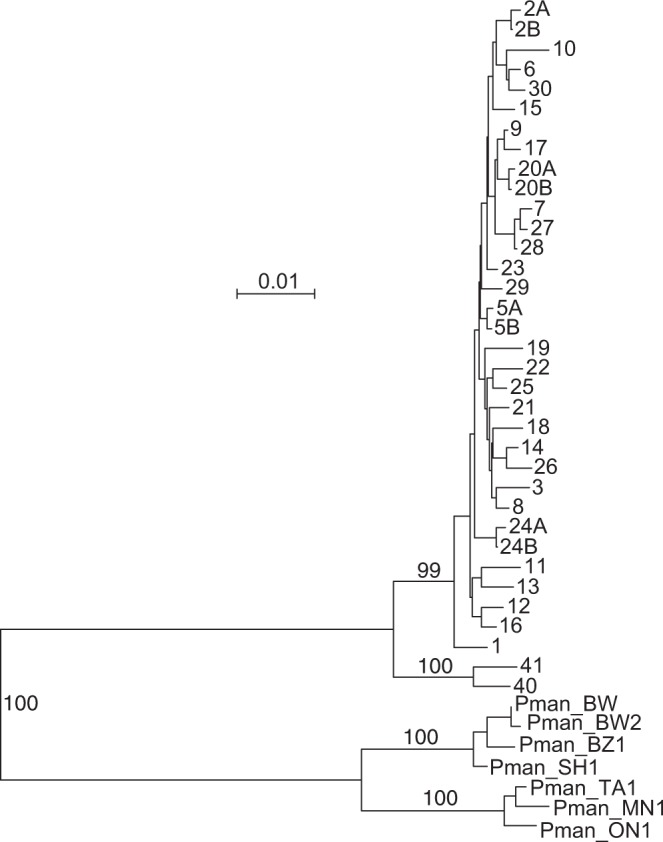
The cricetine rodents Peromyscus leucopus and P. maniculatus are key reservoirs for several zoonotic diseases in North America. We determined the complete circular mitochondrial genome sequences of representatives of 3 different stock colonies of P. leucopus, one stock colony of P. maniculatus and two wild populations of P. leucopus. The genomes were syntenic with that of the murids Mus musculus and Rattus norvegicus. Phylogenetic analysis confirmed that these two Peromyscus species are sister taxa in a clade with P. polionotus and also uncovered a distinction between P. leucopus populations in the eastern and the central United States. In one P. leucopus lineage four extended regions of mitochondrial pseudogenes were identified in the nuclear genome. RNA-seq analysis revealed transcription of the entire genome and differences from controls in the expression profiles of mitochondrial genes in the blood, but not in liver or brain, of animals infected with the zoonotic pathogen Borrelia hermsii. PCR and sequencing of the D-loop of the mitochondrion identified 32 different haplotypes among 118 wild P. leucopus at a Connecticut field site. These findings help to further establish P. leucopus as a model organism for studies of emerging infectious diseases, ecology, and in other disciplines.
Conflict of interest statement
The authors declare no competing interests.
Figures
Similar articles
-
Comparative reservoir competence of Peromyscus leucopus, C57BL/6J, and C3H/HeN for Borrelia burgdorferi B31.Appl Environ Microbiol. 2024 Jul 24;90(7):e0082224. doi: 10.1128/aem.00822-24. Epub 2024 Jun 20. Appl Environ Microbiol. 2024. PMID: 38899883 Free PMC article.
-
Experimental Demonstration of Reservoir Competence of the White-Footed Mouse, Peromyscus leucopus (Rodentia: Cricetidae), for the Lyme Disease Spirochete, Borrelia mayonii (Spirochaetales: Spirochaetaceae).J Med Entomol. 2020 May 4;57(3):927-932. doi: 10.1093/jme/tjz242. J Med Entomol. 2020. PMID: 31819966 Free PMC article.
-
Mammal diversity and infection prevalence in the maintenance of enzootic Borrelia burgdorferi along the western Coastal Plains of Maryland.Vector Borne Zoonotic Dis. 2006 Winter;6(4):411-22. doi: 10.1089/vbz.2006.6.411. Vector Borne Zoonotic Dis. 2006. PMID: 17187577 Free PMC article.
-
The role of Ixodes scapularis, Borrelia burgdorferi and wildlife hosts in Lyme disease prevalence: A quantitative review.Ticks Tick Borne Dis. 2018 Jul;9(5):1103-1114. doi: 10.1016/j.ttbdis.2018.04.006. Epub 2018 Apr 16. Ticks Tick Borne Dis. 2018. PMID: 29680260 Review.
-
Practical Guide to Trapping Peromyscus leucopus (Rodentia: Cricetidae) and Peromyscus maniculatus for Vector and Vector-Borne Pathogen Surveillance and Ecology.J Insect Sci. 2020 Nov 1;20(6):5. doi: 10.1093/jisesa/ieaa028. J Insect Sci. 2020. PMID: 33135755 Free PMC article. Review.
Cited by
-
The utility of a closed breeding colony of Peromyscus leucopus for dissecting complex traits.Genetics. 2022 May 5;221(1):iyac026. doi: 10.1093/genetics/iyac026. Genetics. 2022. PMID: 35143664 Free PMC article.
-
Peromyscus spp. Deer Mice as Rodent Model of Acute Leptospirosis.Emerg Infect Dis. 2025 Jul;31(7):1365-1376. doi: 10.3201/eid3107.241579. Emerg Infect Dis. 2025. PMID: 40562727 Free PMC article.
-
Lactobacilli and other gastrointestinal microbiota of Peromyscus leucopus, reservoir host for agents of Lyme disease and other zoonoses in North America.PLoS One. 2020 Aug 20;15(8):e0231801. doi: 10.1371/journal.pone.0231801. eCollection 2020. PLoS One. 2020. PMID: 32817657 Free PMC article.
-
Lyme Disease Agent Reservoirs Peromyscus leucopus and P. maniculatus Have Natively Inactivated Genes for the High-Affinity Immunoglobulin Gamma Fc Receptor I (CD64).Pathogens. 2023 Aug 18;12(8):1056. doi: 10.3390/pathogens12081056. Pathogens. 2023. PMID: 37624016 Free PMC article.
-
Host-specific functional compartmentalization within the oligopeptide transporter during the Borrelia burgdorferi enzootic cycle.PLoS Pathog. 2021 Jan 11;17(1):e1009180. doi: 10.1371/journal.ppat.1009180. eCollection 2021 Jan. PLoS Pathog. 2021. PMID: 33428666 Free PMC article.
References
-
- Hall, E. R. Mammals of North America. Vol. 2 (John Wiley and Sons, 1979).
-
- Musser, G. G. & Carleton, M. D. In Mammal Species of the World: A Taxonomic and Geographic Reference (eds Wilson, D. E. & Reeder, D. M.) 894–1531 (Johns Hopkins University Press, 2005).
