. 2019 Dec;18(6):4368-4378.
doi: 10.3892/etm.2019.8102. Epub 2019 Oct 14.

Altered pulmonary capillary permeability in immunosuppressed guinea pigs infected with Legionella pneumophila serogroup 1

Affiliations

Altered pulmonary capillary permeability in immunosuppressed guinea pigs infected with Legionella pneumophila serogroup 1

Xu Cai et al. Exp Ther Med. 2019 Dec.

Abstract

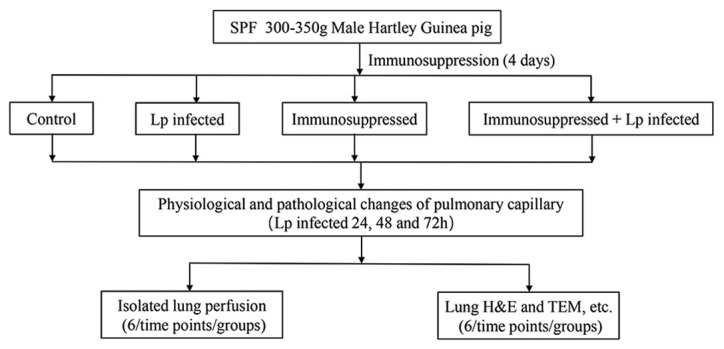
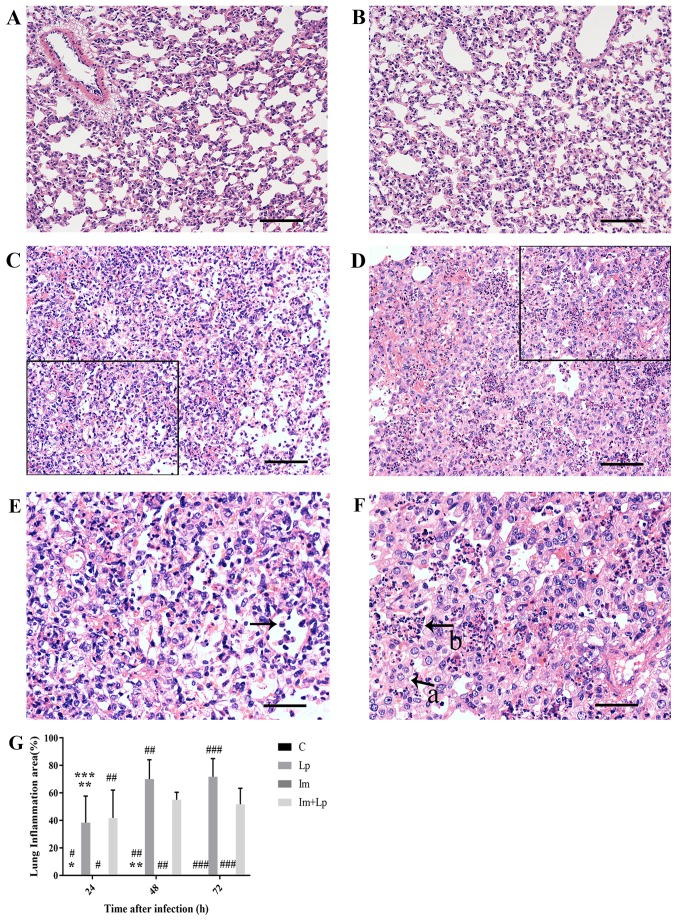
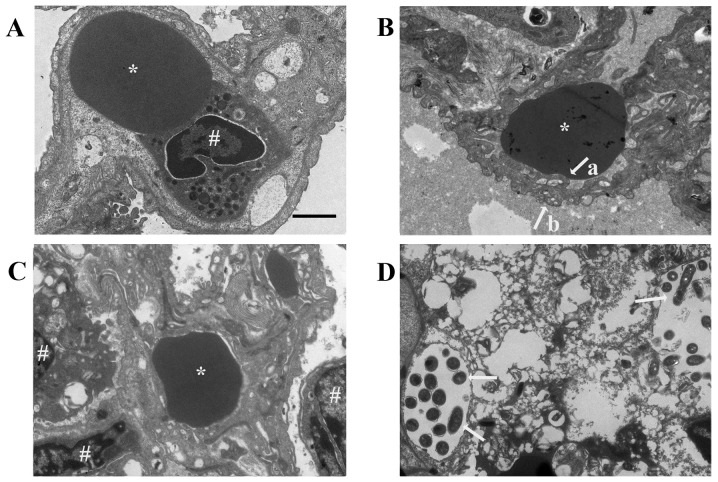
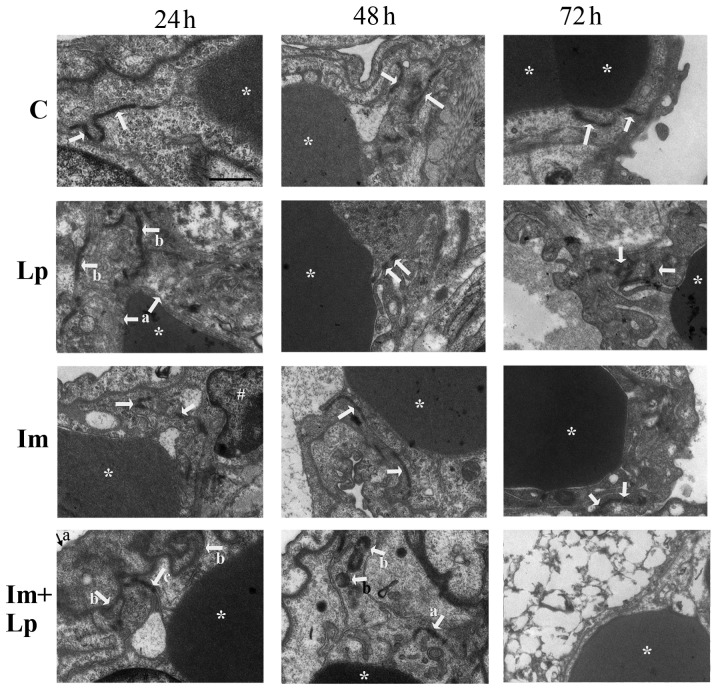
In immunosuppressed hosts, Legionella pneumophila (Lp) infection usually develops into severe pneumonia, which is pathologically characterized by increased vascular permeability and pulmonary edema. At present, mechanisms associated with changes in pulmonary capillary permeability (PCP) and the pathogenesis of pulmonary edema in immunosuppressed hosts with Lp infection are unclear. Therefore, in the present study an animal model of normal and immunosuppressed guinea pigs infected with Lp was established. An isolated perfused lung system was used to investigate the extent of changes in PCP. Pathological and immunofluorescence examinations were performed to explore the mechanism underlying these changes. The results indicated that PCP increased with the highest magnitude in immunosuppressed guinea pigs infected with Lp, with repeated ANOVA indicating synergism between infection and immunosuppression (P=0.0444). Hematoxylin and eosin staining and electron microscopy revealed more severe morphological damages in the lung tissues and pulmonary capillaries of the immunosuppressed animals infected with Lp compared with normal animals infected with Lp. Immunofluorescence analysis showed that immunosuppression reduced the expression of the vascular endothelial cell junction protein VE-cadherin (P=0.027). Following Lp infection, VE-cadherin expression was significantly lower in the immunosuppressed guinea pigs compared with their immunocompetent counterparts (P=0.001). These results suggest that immunosuppression combined with Lp infection induces more significant damage to pulmonary capillaries compared with Lp infection alone, resulting in a significantly increased PCP.

Keywords: Legionella pneumophila serogroup 1; immunosuppression; isolated lung perfusion; pulmonary artery pressure; pulmonary capillary permeability.


Figures

Figure 1.
Figure 1.
Flow chart of experiment. Immunosuppression: Triamcinolone acetonide 20 mg/kg 1–4 days, cyclophosphamide 300 mg/kg day 4.
Figure 2.
Figure 2.
H&E staining of lung tissue sections 72 h after Lp infection. (A) In the control group, the tissue structure was normal. (B) In the immunosuppressed group, the tissue structure was normal. (C and E) In the Lp-infected group, the tissue structure was more disordered with the alveoli and alveolar walls unclear and a large number of inflammatory cells were visible (indicated by arrow). (E) is enlargement of the black box of (C). (D and F) In the immunosuppressed Lp-infected group, the alveolar walls were extensively thickened with the total number of alveoli was reduced (indicated by arrow a), extensive structural disorder was observed and a large number of alveoli were filled with inflammatory exudate (indicated by arrow b). (F) is enlargement of the black box of (D). (G) Quantified lung inflammation area (%). Scale bar, 100 µm (A-D) and 50 µm (E and F) *P<0.05 vs. Lp 24 h; **P<0.05 vs. Lp 48 h; ***P<0.05 vs. Lp 72 h; #P<0.05 vs. Im + Lp 24 h; ##P<0.05 vs. Im + Lp 48 h; and ###P<0.05, vs. Im + Lp 72 h. Lp, Legionella pneumophila; Im, immunosuppressed.
Figure 3.
Figure 3.
Electron micrographs of Lp-infected guinea pig lung tissues 72 h after infection. (A) Ultrastructure in the lung tissues from the control group was normal. (B) In the Lp-infected group, the lung tissue was disordered. The surfaces of pulmonary capillary endothelial cells (indicated by arrow a) and alveolar epithelial cells (indicated by arrow b) were uneven, and the basement membrane between the two was blurred. (C) In the immunosuppressed group, the ultrastructure was close to normal. (D) In the lung tissues from the immunosuppressed Lp-infected group, destruction to the tissue structure was extensive and severe, with larger quantities of Lp infiltration (indicated by arrows). * denotes red blood cell and # denotes nucleus. Scale-bar, 2 µm. Lp, Legionella pneumophila.
Figure 4.
Figure 4.
Actual lung weight in vivo and changes of lung weights in vitro following Lp infection. (A) Weights of lungs from each experimental group at 24, 48 and 72 h following Lp infection. (B) Changes in the weights of lungs from each experimental group at 24 h during 30 min of isolated lung perfusion. (C) Changes in the weights of lungs from each experimental group at 48 h during 30 min of isolated lung perfusion. (D) Changes in the weights of lungs from each experimental group at 72 h during 30 min of isolated lung perfusion. (E) Final changes in the weights of lungs from each experimental group at 24, 48 and 72 h after 30 min of isolated lung perfusion. *P<0.05 vs. Lp 24 h; **P<0.05 vs. Lp 48 h; ***P<0.05 vs. Lp 72 h; ^^P<0.05 vs. Im 48 h; ^^^P<0.05 vs. Im 72 h; #P<0.05 vs. Im + Lp 24 h; ##P<0.05 vs. Im + Lp 48 h; and ###P<0.05 vs. Im + Lp 72 h. C, control; Lp, Legionella pneumophila; Im, immunosuppressed.
Figure 5.
Figure 5.
Transmission electron microscopy images of pulmonary capillary endothelial cell junctions in lung tissues isolated from guinea pigs from the experimental groups. Pulmonary capillary endothelial cell junctions in the control group were normal (indicated by arrows). In the Lp-infected group, at 24 h, abnormal changes that could be observed included swollen vascular endothelial cells (indicated by arrows a) and partially opened cell junctions (indicated by arrows b); at 48 h, the endothelial cell junctions were completely opened (indicated by arrows); at 72 h, the cell junctions were obscure and partially opened (indicated by arrows). In the immunosuppressed group, at 24 h, the endothelial cell junctions were partially opened (indicated by arrows); at 48 h, the density of the cell junctions was reduced and the cell junctions were intermittently opened (indicated by arrows); at 72 h, the endothelial cell junctions had recovered to normal (indicated by arrows). In the immunosuppressed Lp-infected group, at 24 h, the alveolar epithelial cells were swollen (indicated by arrow a), the basement membrane was shrunken (indicated by arrows b), the density and number of cell junctions were reduced and the junctions were partially opened (indicated by arrow c); at 48 h, the number and densities of cell junctions were reduced and partially opened (indicated by arrow a), Lp bacteria were visible (indicated by arrows b); at 72 h, destruction of tissue structure was evident, the cell membrane was unclear, the nuclei were swollen, and the cell junctions had disappeared. *Denotes red blood cells and #denotes the nucleus. Scale-bars, 1 µm. C, control; Lp, Legionella pneumophila; Im, immunosuppressed.
Figure 6.
Figure 6.
Expression of VE-cadherin detected in lung tissues isolated from guinea pigs from the experimental groups using immunofluorescence staining. (A) Representative images of VE-cadherin staining in lung tissues isolated from guinea pigs from the four experimental groups 72 h after infection. (B) IOD of VE-cadherin fluorescence as calculated from the images demonstrates that VE-cadherin expression in the immunosuppressed Lp-infected group was the lowest compared with all other groups. *P<0.05 vs. Im 24 h; #P<0.05 vs. Im + Lp 24 h; ##P<0.05 vs. Im + Lp 48 h; and ###P<0.05 vs. Im + Lp 72 h. Scale-bar, 100 µm. C, control; Lp, Legionella pneumophila; Im, immunosuppressed; VE-cadherin, vascular-endothelial cadherin; IOD, integral optical density.

References

    1. Stout JE, Yu VL. Legionellosis. New Eng J Med. 1997;337:682–687. doi: 10.1056/NEJM199709043371006. - DOI - PubMed
    1. Helms CM, Viner JP, Weisenburger DD, Chiu LC, Renner ED, Johnson W. Sporadic legionnaires' disease: Clinical observations on 87 nosocomial and community-acquired cases. Am J Med Sci. 1984;288:2–12. doi: 10.1097/00000441-198407000-00001. - DOI - PubMed
    1. Pedro-Botet ML, Sabria-Leal M, Sopena N, Manterola JM, Morera J, Blavia R, Padilla E, Matas L, Gimeno JM. Role of immunosuppression in the evolution of Legionnaires' disease. Clin Infect Dis. 1998;26:14–19. doi: 10.1086/516258. - DOI - PubMed
    1. Beaute J, Zucs P, de Jong B, European Legionnaires' Disease Surveillance Network Legionnaires disease in Europe, 2009–2010. Euro Surveill. 2013;18:20417. doi: 10.2807/ese.18.10.20417-en. - DOI - PubMed
    1. Clark SB, Soos MP. StatPearls. StatPearls Publishing LLC.; Treasure Island (FL): 2019. Noncardiogenic Pulmonary Edema. - PubMed