. 2019 Oct 24:2019:5797512.
doi: 10.1155/2019/5797512. eCollection 2019.

Cicadidae Periostracum, the Cast-Off Skin of Cicada, Protects Dopaminergic Neurons in a Model of Parkinson's Disease

Affiliations

Cicadidae Periostracum, the Cast-Off Skin of Cicada, Protects Dopaminergic Neurons in a Model of Parkinson's Disease

Hye-Sun Lim et al. Oxid Med Cell Longev. .

Abstract

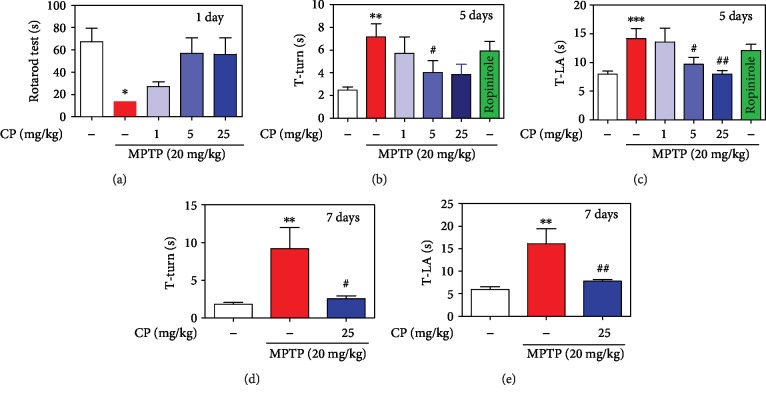
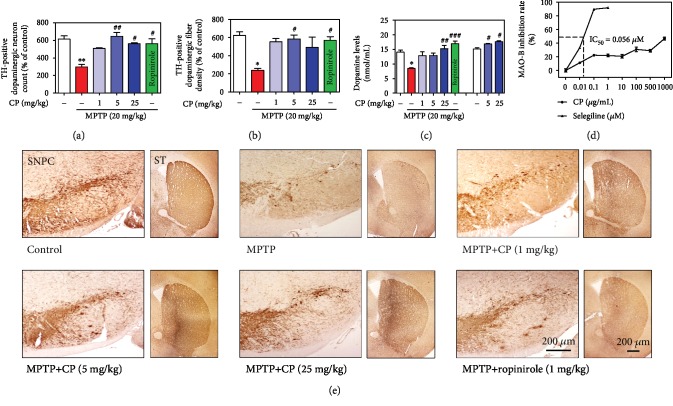
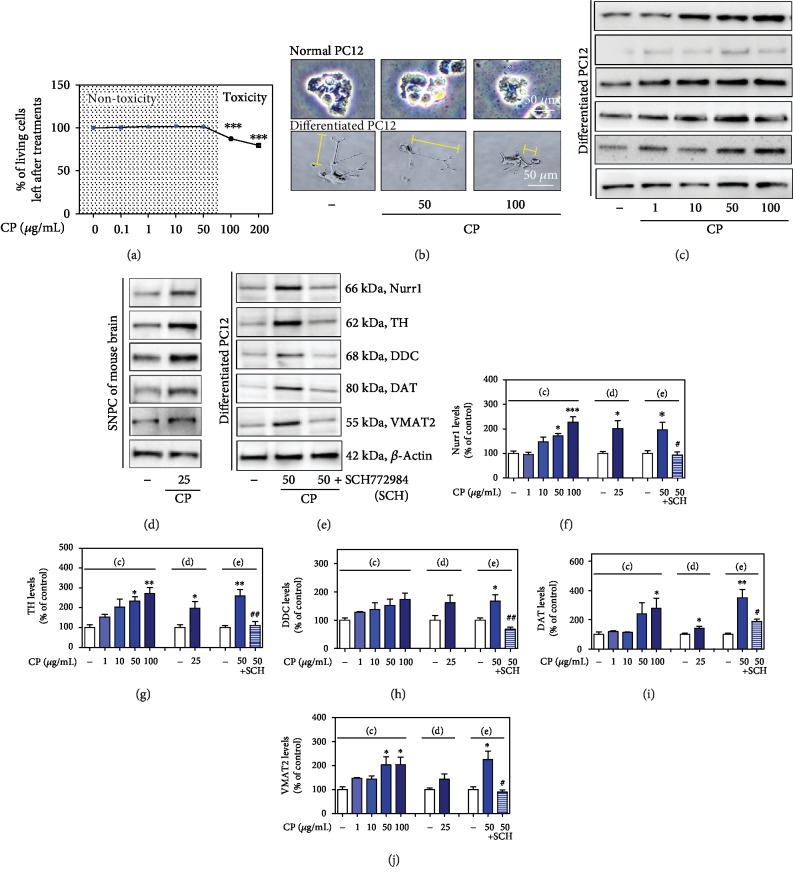
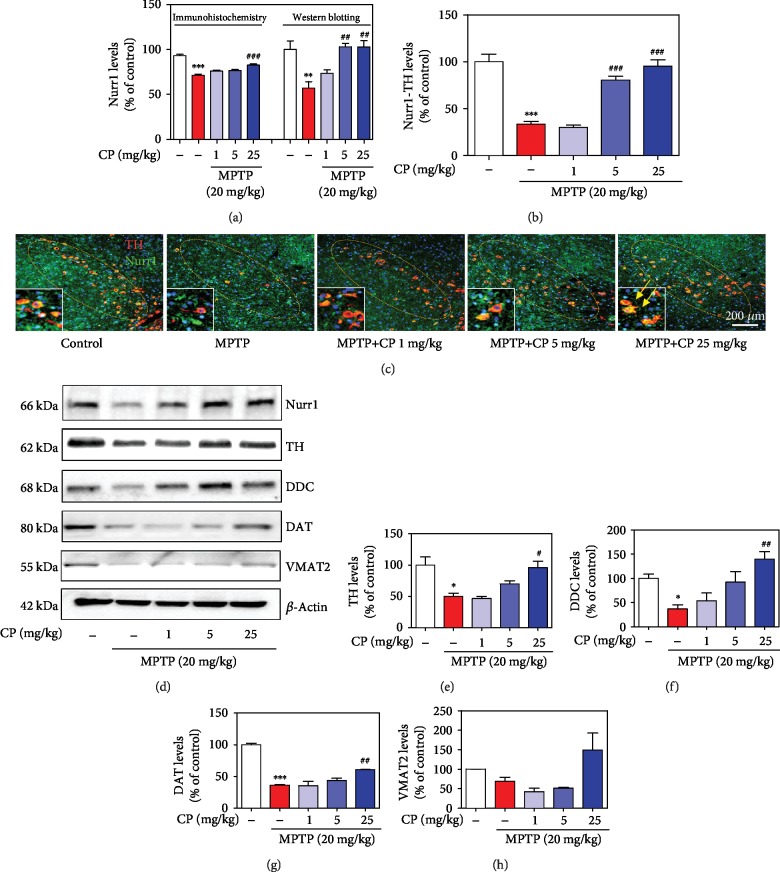
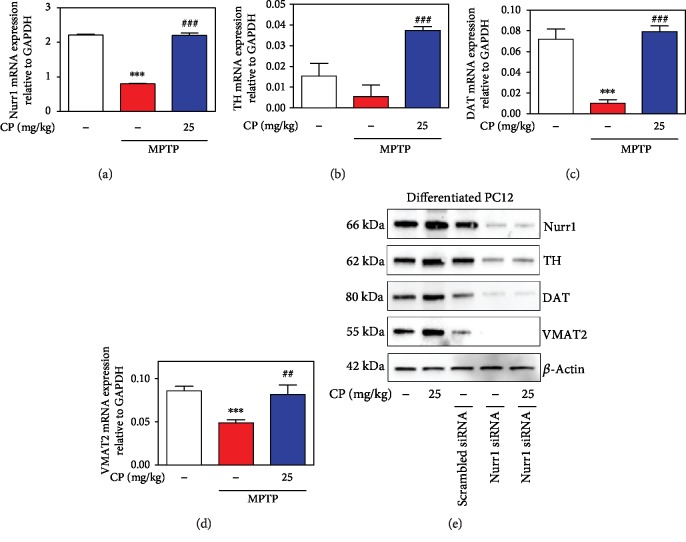
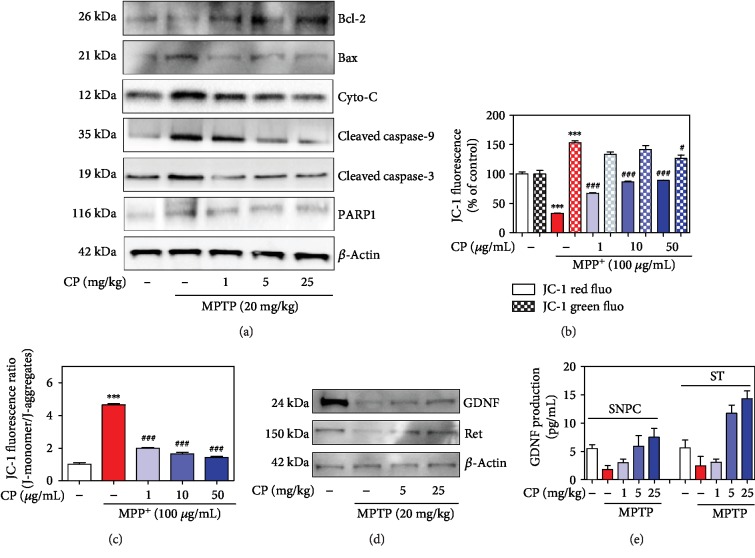
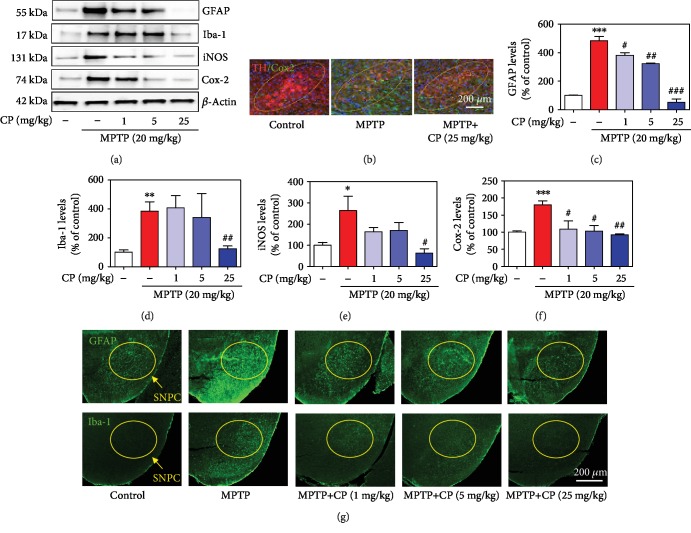
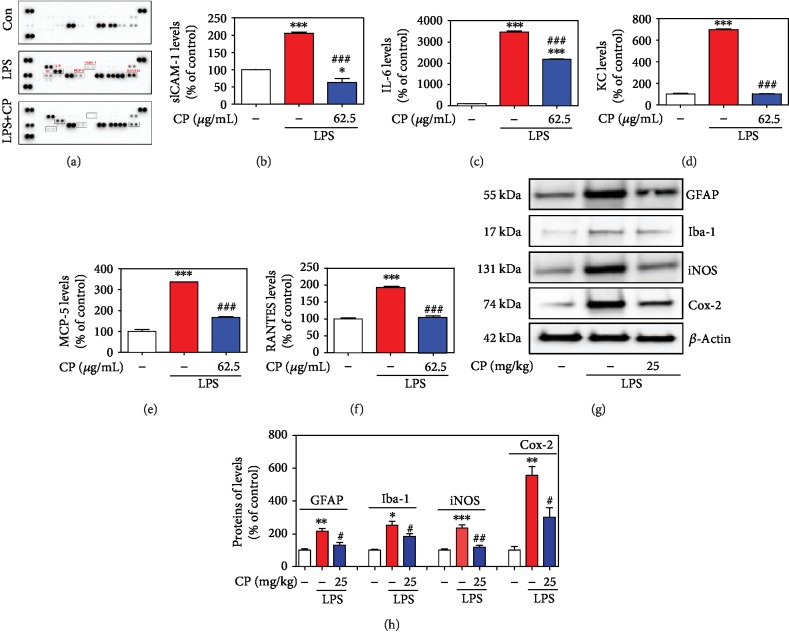
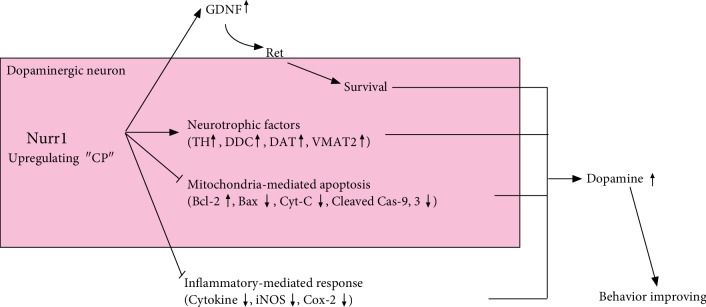
Parkinson's disease (PD) is characterized by dopaminergic neuronal loss in the substantia nigra pars compacta (SNPC) and the striatum. Nuclear receptor-related 1 protein (Nurr1) is a nuclear hormone receptor implicated in limiting mitochondrial dysfunction, apoptosis, and inflammation in the central nervous system and protecting dopaminergic neurons and a promising therapeutic target for PD. Cicadidae Periostracum (CP), the cast-off skin of Cryptotympana pustulata Fabricius, has been used in traditional medicine for its many clinical pharmacological effects, including the treatment of psychological symptoms in PD. However, scientific evidence for the use of CP in neurodegenerative diseases, including PD, is lacking. Here, we investigated the protective effects of CP on 1-methyl-4-phenyl-1,2,3,6-tetrahydropyridine- (MPTP-) induced PD in mice and explored the underlying mechanisms of action, focusing on Nurr1. CP increased the expression levels of Nurr1, tyrosine hydroxylase, DOPA decarboxylase, dopamine transporter, and vesicular monoamine transporter 2 via extracellular signal-regulated kinase phosphorylation in differentiated PC12 cells and the mouse SNPC. In MPTP-induced PD, CP promoted recovery from movement impairments. CP prevented dopamine depletion and protected against dopaminergic neuronal degradation via mitochondria-mediated apoptotic proteins such as B-cell lymphoma 2 (Bcl-2), Bcl-2-associated X, cytochrome c, and cleaved caspase-9 and caspase-3 by inhibiting MPTP-induced neuroinflammatory cytokines, inducible nitric oxide synthase, cyclooxygenase 2, and glial/microglial activation. Moreover, CP inhibited lipopolysaccharide-induced neuroinflammatory cytokines and response levels and glial/microglial activation in BV2 microglia and the mouse brain. Our findings suggest that CP might contribute to neuroprotective signaling by regulating neurotrophic factors primarily via Nurr1 signaling, neuroinflammation, and mitochondria-mediated apoptosis.


Conflict of interest statement

The authors declare no competing financial interests.

Figures

Figure 1
Figure 1
Summary of the experimental design.
Figure 2
Figure 2
Effects of CP on MPTP-induced movement impairment in mice. CP was administered for 5 days. On day 3, at 2 h after CP administration, MPTP was injected four times. One day after MPTP injection, latency time on the rotating rod was recorded with a 300 s cut-off limit (a). At days 5 and 7 after MPTP injection, time to turn completely downward (b, d) and time to fall off the rod onto the floor (c, e) were recorded with a 60 s cut-off limit. Values shown represent means ± S.E.M. p < 0.05, ∗∗p < 0.01, and ∗∗∗p < 0.001 compared with the control group and #p < 0.05 and ##p < 0.01 compared with the MPTP-treated group.
Figure 3
Figure 3
Effects of CP on MPTP-induced dopaminergic neuronal death. Dopaminergic neurons were visualized by TH-specific immunostaining. The number of TH-immunopositive neurons in the SNPC (a) was counted, and the optical density in the ST (b) was measured. Dopamine levels in the ST were measured using ELISA (c). MAO-B inhibition rate in a cell-free system was measured using ELISA (d). Representative photomicrographs of the SNPC and ST were taken (e). Values are presented as means ± S.E.M. p < 0.05, ∗∗p < 0.01, and ∗∗∗p < 0.001 compared with the control group and #p < 0.05, ##p < 0.01, and ###p < 0.001 compared with the MPTP-treated group (a, b, or c) or control group (c in the cell-free system).
Figure 4
Figure 4
Effects of CP on cell viability and Nurr1 and its regulating neurotrophic factors. Effects of CP on PC12 and differentiated PC12 cell neuronal damage (a, b). The protein levels of Nurr1 and its regulating neurotrophic factors were measured by western blotting in differentiated PC12 cells (c) and the mouse SNPC (d). Differentiated PC12 cells were pretreated with CP and an ERK inhibitor (SCH) for 10 h, and the protein levels of Nurr1 and its regulating neurotrophic factors were measured by western blotting (e). β-Actin protein was used as an internal control. Bar graphs represent the relative expression of Nurr1 (f), TH (g), DDC (h), DAT (i), and VMAT2 (j) for (c)–(e). Values are presented as means ± S.E.M. p < 0.05, ∗∗p < 0.01, and ∗∗∗p < 0.001 compared with the control group and #p < 0.05 and ##p < 0.01 compared with the CP-treated group.
Figure 5
Figure 5
Effects of CP on MPTP-induced Nurr1 and neurotrophic proteins. Seven days after the last MPTP treatment, Nurr1 levels were measured by IHC in dopaminergic neurons (a, b) and western blotting in the SNPC (a). Representative photomicrographs of the SNPC were taken (c). The expressions of Nurr1, TH, DDC, DAT, and VMAT2 were detected by western blotting using specific antibodies in the SNPC (d). β-Actin protein was used as an internal control. Bar graphs represent the relative expression of Nurr1 (a), TH (e), DDC (f), DAT (g), and VMAT2 (h) for (d). Values shown represent means ± S.E.M. p < 0.05 and ∗∗∗p < 0.001 compared with the control group and #p < 0.05 and ##p < 0.01 compared with the MPTP-treated group.
Figure 6
Figure 6
Effects of CP on MPTP-induced mRNA levels of Nurr1 and its regulating neurotrophic factors. Real-time RT-PCR was performed to see the effects of CP on mRNA expression of Nurr1 (a), TH (b), DAT (c), and VMAT2 (d). Then, effects of Nurr1 on upregulating neurotrophic factors (TH, DAT, and VMAT2) in Nurr1 siRNA-transfected differentiated PC12 cells (e). Values shown represent means ± S.E.M. ∗∗∗p < 0.001 compared with the control group and ##p < 0.01 and ###p < 0.001 compared with the MPTP-treated group.
Figure 7
Figure 7
Effects of CP on MPTP-induced mitochondria-mediated apoptosis. Seven days after the last MPTP treatment, mitochondria-induced apoptotic factors (Bcl-2, Bax, Cyt-c, cleaved caspase-9, cleaved caspase-3, and PARP1) were measured by western blotting (a). Differentiated PC12 cells were treated with CP and exposed to MPP+ for 48 h. Moreover, red and green (b) and the ratio (c) of these fluoresces of mitochondrial membrane potential were expressed as a percentage of control. Effects of CP on MPTP-induced survival-related GDNF signaling. Its factors (GDNF and Ret) were measured by western blotting (d) and ELISA kit (e). Values are presented as means ± S.E.M. ∗∗∗p < 0.001 compared with the control group and #p < 0.05 or ###p < 0.001 compared with the MPP+- or MPTP-treated group.
Figure 8
Figure 8
Effects of CP on MPTP-induced neuroinflammatory signaling factors. One day after the last MPTP treatment, glial activation proteins (GFAP and Iba-1) and neuroinflammatory signaling factors (iNOS and Cox-2) were measured by western blotting or IHC (a, b). Levels of neuroinflammatory signaling factors were normalized to β-actin (c–f). Moreover, representative photomicrographs of the SNPC were taken (g). Values shown represent means ± S.E.M. p < 0.05, ∗∗p < 0.01, and ∗∗∗p < 0.001 compared with the control group and #p < 0.05, ##p < 0.01, and ###p < 0.001 compared with the MPTP-treated group.
Figure 9
Figure 9
Effects of CP on LPS-induced neuroinflammatory signaling factors. Microglial BV2 cells were treated with CP for 2 h and with LPS for an additional 22 h. After 24 h incubation, the cultures were subjected to a cytokine antibody array assay (h). Densitometric ratios of the arrays showed differences in the cytokine markers (ICAM-1, KC, IL-6, MCP-5, and RANTES) (i–m). The glial activation markers (GFAP and Iba-1) and neuroinflammatory signaling factors (iNOS and Cox-2) were measured using western blotting (n). Bar graphs represent the relative expression of GFAP, Iba-1, iNOS, and Cox-2 (o) for (n). Values shown represent means ± S.E.M. p < 0.05, ∗∗p < 0.01, and ∗∗∗p < 0.001 compared with the control group and #p < 0.05, ##p < 0.01, and ###p < 0.001 compared with the LPS-treated group.
Figure 10
Figure 10
Schematic of the mechanism proposed for the effects of CP on Nurr1 activation and Parkinson's disease pathogenesis.

References

    1. Poewe W., Seppi K., Tanner C. M., et al. Parkinson disease. Nature Reviews Disease Primers. 2017;3(1, article 17013) doi: 10.1038/nrdp.2017.13. - DOI - PubMed
    1. Sveinbjornsdottir S. The clinical symptoms of Parkinson’s disease. Journal of Neurochemistry. 2017;139:318–324. doi: 10.1111/jnc.13691. - DOI - PubMed
    1. Ruonala V., Pekkonen E., Airaksinen O., Kankaanpää M., Karjalainen P. A., Rissanen S. M. Levodopa-induced changes in electromyographic patterns in patients with advanced Parkinson’s disease. Frontiers in Neurology. 2018;9(35) doi: 10.3389/fneur.2018.00035. - DOI - PMC - PubMed
    1. Kim C.-H., Han B.-S., Moon J., et al. Nuclear receptor Nurr1 agonists enhance its dual functions and improve behavioral deficits in an animal model of Parkinson’s disease. Proceedings of the National Academy of Sciences of the United States of America. 2015;112(28):8756–8761. doi: 10.1073/pnas.1509742112. - DOI - PMC - PubMed
    1. Dong J., Wang Y., Liu X., Le W. Nurr1 deficiency-mediated inflammatory injury to nigral dopamine neurons in Parkinson’s disease. Parkinsonism & Related Disorders. 2018;46, article e66 doi: 10.1016/j.parkreldis.2017.11.226. - DOI