. 2019 Jan-Dec:23:2331216519887615.
doi: 10.1177/2331216519887615.

Perception of Auditory Distance in Normal-Hearing and Moderate-to-Profound Hearing-Impaired Listeners

Affiliations

Perception of Auditory Distance in Normal-Hearing and Moderate-to-Profound Hearing-Impaired Listeners

Gilles Courtois et al. Trends Hear. 2019 Jan-Dec.

Abstract

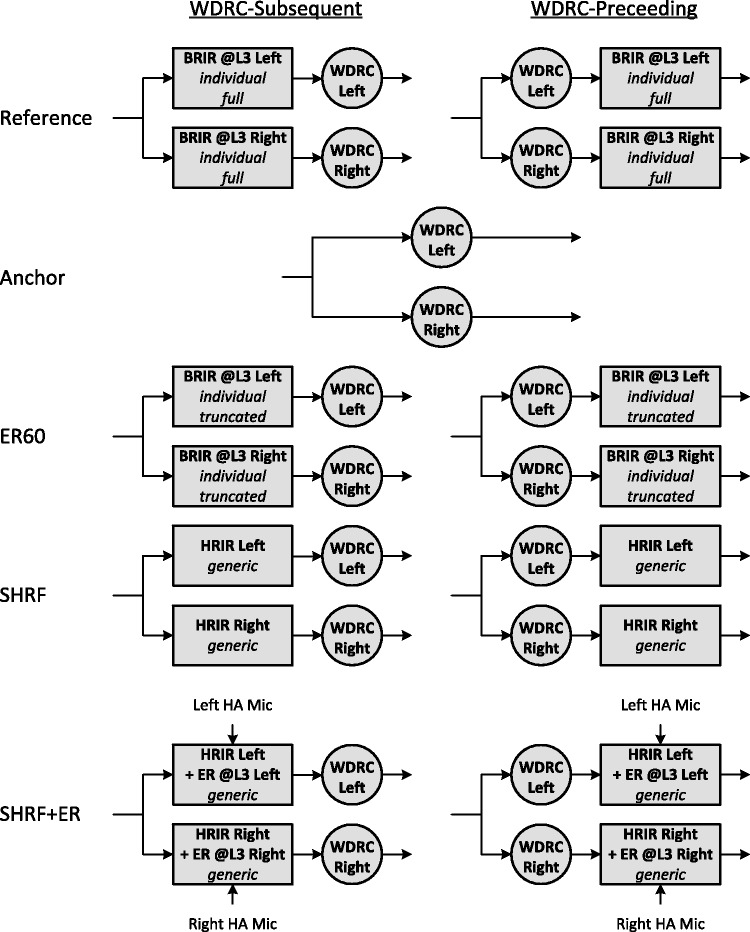
The auditory system allows the estimation of the distance to sound-emitting objects using multiple spatial cues. In virtual acoustics over headphones, a prerequisite to render auditory distance impression is sound externalization, which denotes the perception of synthesized stimuli outside of the head. Prior studies have found that listeners with mild-to-moderate hearing loss are able to perceive auditory distance and are sensitive to externalization. However, this ability may be degraded by certain factors, such as non-linear amplification in hearing aids or the use of a remote wireless microphone. In this study, 10 normal-hearing and 20 moderate-to-profound hearing-impaired listeners were instructed to estimate the distance of stimuli processed with different methods yielding various perceived auditory distances in the vicinity of the listeners. Two different configurations of non-linear amplification were implemented, and a novel feature aiming to restore a sense of distance in wireless microphone systems was tested. The results showed that the hearing-impaired listeners, even those with a profound hearing loss, were able to discriminate nearby and far sounds that were equalized in level. Their perception of auditory distance was however more contracted than in normal-hearing listeners. Non-linear amplification was found to distort the original spatial cues, but no adverse effect on the ratings of auditory distance was evident. Finally, it was shown that the novel feature was successful in allowing the hearing-impaired participants to perceive externalized sounds with wireless microphone systems.

Trial registration: ClinicalTrials.gov NCT03512951.

Keywords: WDRC; auditory distance perception; externalization; hearing aids; remote microphone systems; spatial hearing.


Figures

Figure 1.
Figure 1.
Setup of the experiments in a reverberant classroom. The loudspeakers were arranged in slightly increasing heights so that all of them were visible by the listeners.
Figure 2.
Figure 2.
Block diagrams of the five stimuli in the WDRC-Subsequent (left panel) and WDRC-Preceding (right panel) conditions. The diotic stimulus was identical in both conditions. The Reference and ER60 stimuli were spatialized with the individual BRIRs of the participants corresponding to Loudspeaker 3. The SHRF and SHRF+ER stimuli were processed with generic anechoic HRIRs measured on a KEMAR. The left and right audio signals simulating the HA microphone signals and used as inputs of the SHRF+ER algorithm were generated with prior generic BRIRs measured in the classroom on a KEMAR wearing a pair of behind-the-ear HAs, when the sound was played through Loudspeaker 3. ER60 = first 60-ms early reflections; BRIR = binaural room impulse response; HA = hearing aid; HRIR = head-related impulse response; L3 = Loudspeaker 3; SHRF = spatial hearing restoration feature; SHRF+ER = SHRF plus early reflections; WDRC = wide dynamic range compression.
Figure 3.
Figure 3.
Audiograms (best ear) of the NH (blue lines) and HI (orange-to-red lines) listeners. The thick blue dotted line represents the average audiogram in the NH group, while the thick red dotted line is the average audiogram in the HI group. The black thick dotted line corresponds to the maximum output level of the audiometer. The error bars represent the standard error.
Figure 4.
Figure 4.
Distribution of the reported auditory distance of the five stimuli by the NH (blue boxes) and HI listeners in the WDRC-Subsequent (green boxes) and WDRC-Preceding (orange boxes) conditions. The dark line in the middle of the boxes represents the median, while the bottom and top lines correspond to the 25th and 75th percentiles, respectively. The T-bars are the whiskers (correspond to the min and max values within 1.5 times the interquartile range). The points are outliers and the stars indicate extreme outliers (values more than three times the height of the box). ER60 = first 60-ms early reflections; HI = hearing-impaired; NH = normal-hearing; SHRF = spatial hearing restoration feature; SHRF + ER = SHRF plus early reflections.
Figure 5.
Figure 5.
ADP of the Reference (left panel) and Anchor (right panel) stimuli as reported by the HI listeners in the WDRC-Subsequent condition, as a function of their PTA. BE = best ear; PTA = pure-tone average.
Figure 6.
Figure 6.
Distribution of the ILD (left panel) and IC (right panel) of the five stimuli experienced by the NH (blue boxes) and HI listeners in the WDRC-Subsequent (green boxes) and WDRC-Preceding (orange boxes) conditions. The ILD and IC are obtained for each stimulus by averaging their short-term observations on frames of 46 ms. ER60 = first 60-ms early reflections; HI = hearing-impaired; IC = interaural coherence; ILD = interaural level difference; NH = normal-hearing; SHRF = spatial hearing restoration feature; SHRF+ER = SHRF plus early reflections.
Figure 7.
Figure 7.
Compression ratios of the fitted WDRC as a function of the PTA at the best (left panel) and worst (right panel) ears of every HI participants. PTA = pure-tone average.

References

    1. Akeroyd M. A. (2010). The effect of hearing-aid compression on judgments of relative distance. The Journal of the Acoustical Society of America, 127(1), 9–12. doi:10.1121/1.3268505 - PMC - PubMed
    1. Akeroyd M. A. (2014). An overview of the major phenomena of the localization of sound sources by normal-hearing, hearing-impaired, and aided listeners. Trends in Hearing, 18, 1–7. doi:10.1177/2331216514560442 - PMC - PubMed
    1. Akeroyd M. A., Gatehouse S., Blaschke J. (2007). The detection of differences in the cues to distance by elderly hearing-impaired listeners. The Journal of the Acoustical Society of America, 121(2), 1077–1089. doi:10.1121/1.2404927 - PMC - PubMed
    1. Begault D. R., Wenzel E. M., Anderson M. R. (2001). Direct comparison of the impact of head tracking, reverberation, and individualized head-related transfer functions on the spatial perception of a virtual speech source. Journal of the Audio Engineering Society, 49(10), 904–916. Retrieved from http://www.aes.org/e-lib/browse.cfm?elib=9204 - PubMed
    1. Boyd A. W., Whitmer W. M., Soraghan J. J., Akeroyd M. A. (2012). Auditory externalization in hearing-impaired listeners: The effect of pinna cues and number of talkers. The Journal of the Acoustical Society of America, 131(3), EL268–EL274. doi:10.1121/1.3687015 - PMC - PubMed

Publication types

Associated data

LinkOut - more resources