Review
. 2020 May 1;77(5):534-540.
doi: 10.1001/jamapsychiatry.2019.3671.

Establishment of Best Practices for Evidence for Prediction: A Review

Affiliations
Review

Establishment of Best Practices for Evidence for Prediction: A Review

Russell A Poldrack et al. JAMA Psychiatry. .

Abstract

Importance: Great interest exists in identifying methods to predict neuropsychiatric disease states and treatment outcomes from high-dimensional data, including neuroimaging and genomics data. The goal of this review is to highlight several potential problems that can arise in studies that aim to establish prediction.

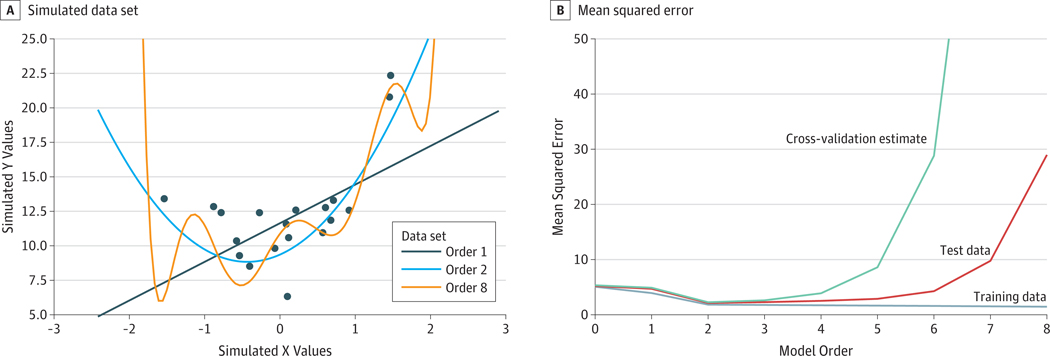
Observations: A number of neuroimaging studies have claimed to establish prediction while establishing only correlation, which is an inappropriate use of the statistical meaning of prediction. Statistical associations do not necessarily imply the ability to make predictions in a generalized manner; establishing evidence for prediction thus requires testing of the model on data separate from those used to estimate the model's parameters. This article discusses various measures of predictive performance and the limitations of some commonly used measures, with a focus on the importance of using multiple measures when assessing performance. For classification, the area under the receiver operating characteristic curve is an appropriate measure; for regression analysis, correlation should be avoided, and median absolute error is preferred.

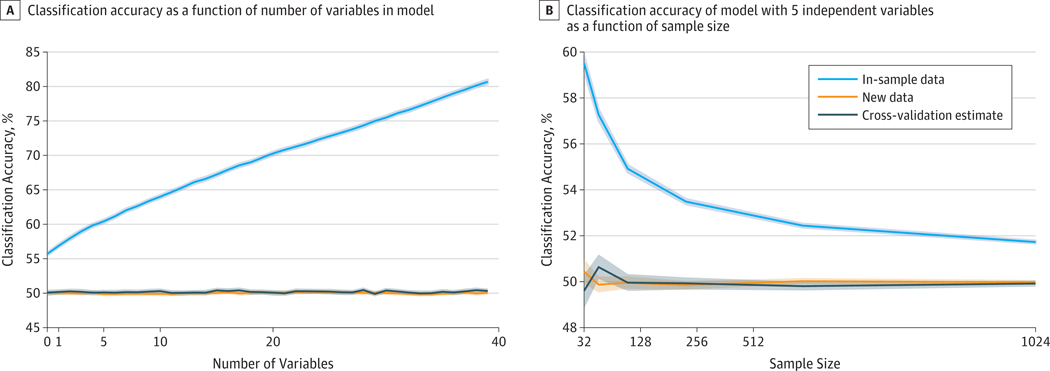
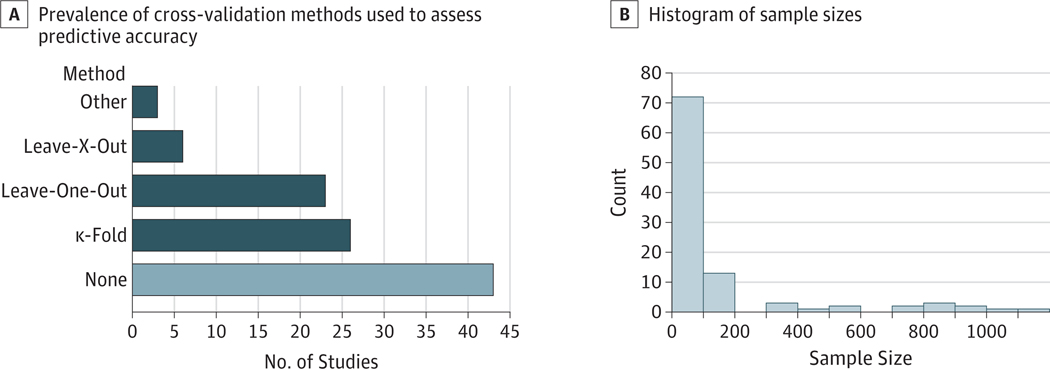
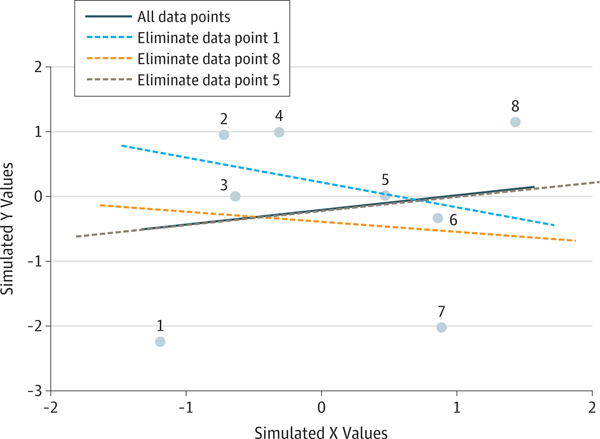
Conclusions and relevance: To ensure accurate estimates of predictive validity, the recommended best practices for predictive modeling include the following: (1) in-sample model fit indices should not be reported as evidence for predictive accuracy, (2) the cross-validation procedure should encompass all operations applied to the data, (3) prediction analyses should not be performed with samples smaller than several hundred observations, (4) multiple measures of prediction accuracy should be examined and reported, (5) the coefficient of determination should be computed using the sums of squares formulation and not the correlation coefficient, and (6) k-fold cross-validation rather than leave-one-out cross-validation should be used.


Conflict of interest statement

Conflict of Interest Disclosures: None reported.

Figures

Figure 1.
Figure 1.. Depiction of Overfitting
A, Simulated data set. The data set was generated from a quadratic model (ie, polynomial order 2). The best-fitting models are depicted: polynomial order 1 (linear), polynomial order 2 (quadratic), and polynomial order 8 (complex). The complex model overfits the data set, adapting itself to the noise evident in specific data points, with its predictions oscillating at the extremes of the x-axis. B, Mean squared error. Mean squared error for the model was assessed against the data set used to train the model and against a separate test data set sampled from the same generative process with different random measurement error. Results reflect the median over 1000 simulation runs. Order 0 indicates no model complexity, and order 8 indicates maximum model complexity. The mean squared error decreases for the training data set as the complexity of the model increases. The mean squared error estimated using 4-fold cross-validation (green) is also lowest for the true model.
Figure 2.
Figure 2.. Classification Accuracy
A, Classification accuracy as a function of number of variables in model. For each of 1000 simulation runs, a completely random data set (comprising a set of normally distributed independent variables and a random binary dependent variable) was generated, and logistic regression was fitted to both the data as a whole and the data estimated using 4-fold cross-validation. In addition, a second data set was generated using the same mechanism to serve as an unseen test data set. The orange and gray lines show that cross-validation is a good proxy for testing the model on new data, with both showing chance accuracy. The blue line shows that in-sample classification accuracy is inflated compared with the true value of 50% because of the fitting of noise in those variables. B, Classification accuracy of model with 5 independent variables as a function of sample size. Optimism (the difference in accuracy between in-sample and cross-validated or new data) is substantially higher for smaller sample sizes. Shaded areas indicate 95%CIs estimated with the bootstrapping method.
Figure 3.
Figure 3.. Results From Review of 100 Most Recent Studies (2017–2019) Claiming Prediction on the Basis of fMRI Data
A, Prevalence of cross-validation methods used to assess predictive accuracy. B, Histogram of sample sizes.
Figure 4.
Figure 4.. Example of Anticorrelated Regression Predictions Using Leave-One-Out Cross-validation
The regression line fit to the full data set (solid gray line) has a slightly positive slope. Dropping data points near the overall regression line has little effect on the resulting slope (eg, dashed gray line showing slope after dropping data point 5), but dropping high-leverage data points at the extremes of the X distribution has major effect on the resulting regression lines (eg, dashed blue and orange lines showing effect of dropping points 1 and 8, respectively), changing the slope from positive to negative. In the context of leave-one-out cross-validation, this instability implies that a regression fit on the train set is negatively correlated with the value of the testing set, even for purely random data.

References

    1. Woo CW, Chang LJ, Lindquist MA, Wager TD. Building better biomarkers: brain models in translational neuroimaging. Nat Neurosci. 2017;20 (3):365–377. doi:10.1038/nn.4478 - DOI - PMC - PubMed
    1. Aharoni E, Vincent GM, Harenski CL, et al. Neuroprediction of future rearrest. Proc Natl Acad Sci U S A. 2013;110(15):6223–6228. doi:10.1073/pnas.1219302110 - DOI - PMC - PubMed
    1. Koutsouleris N, Meisenzahl EM, Davatzikos C, et al. Use of neuroanatomical pattern classification to identify subjects in at-risk mental states of psychosis and predict disease transition. Arch Gen Psychiatry. 2009;66(7):700–712. doi:10.1001/archgenpsychiatry.2009.62 - DOI - PMC - PubMed
    1. Chekroud AM, Zotti RJ, Shehzad Z, et al. Cross-trial prediction of treatment outcome in depression: a machine learning approach. Lancet Psychiatry. 2016;3(3):243–250. doi:10.1016/S2215-0366 - DOI - PubMed
    1. Copas JB. Regression, prediction and shrinkage. J R Stat Soc Series B Stat Methodol. 1983;45(3):311354.