. 2019 Nov 26;29(9):2901-2916.e6.
doi: 10.1016/j.celrep.2019.10.079.

Trans-omics Impact of Thymoproteasome in Cortical Thymic Epithelial Cells

Affiliations

Trans-omics Impact of Thymoproteasome in Cortical Thymic Epithelial Cells

Izumi Ohigashi et al. Cell Rep. .

Abstract

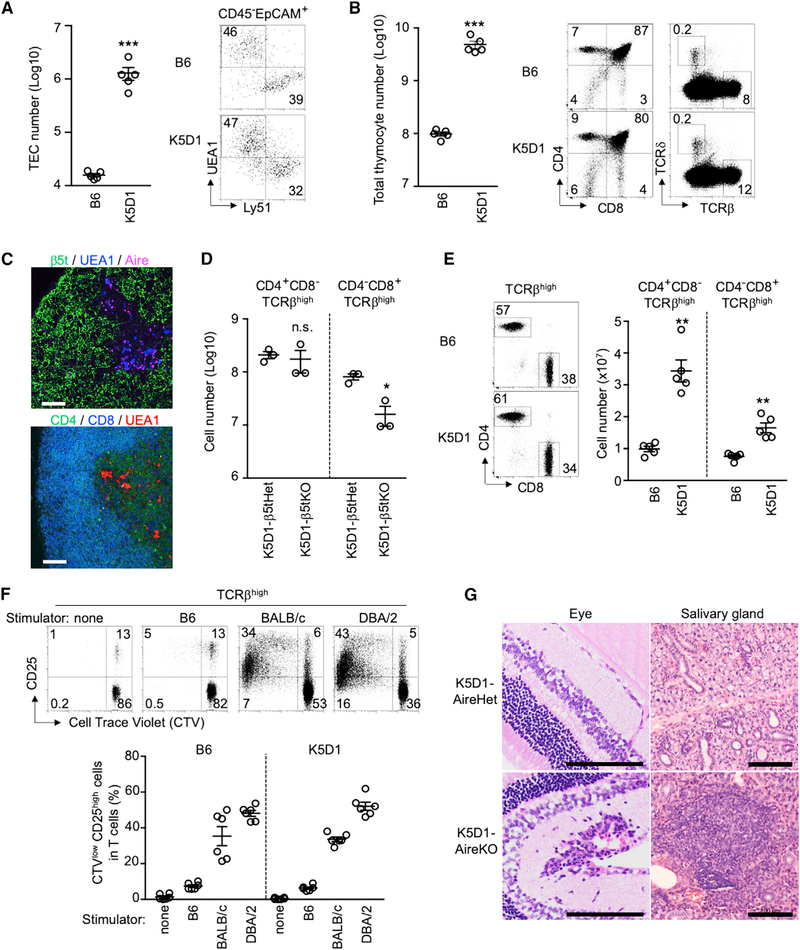
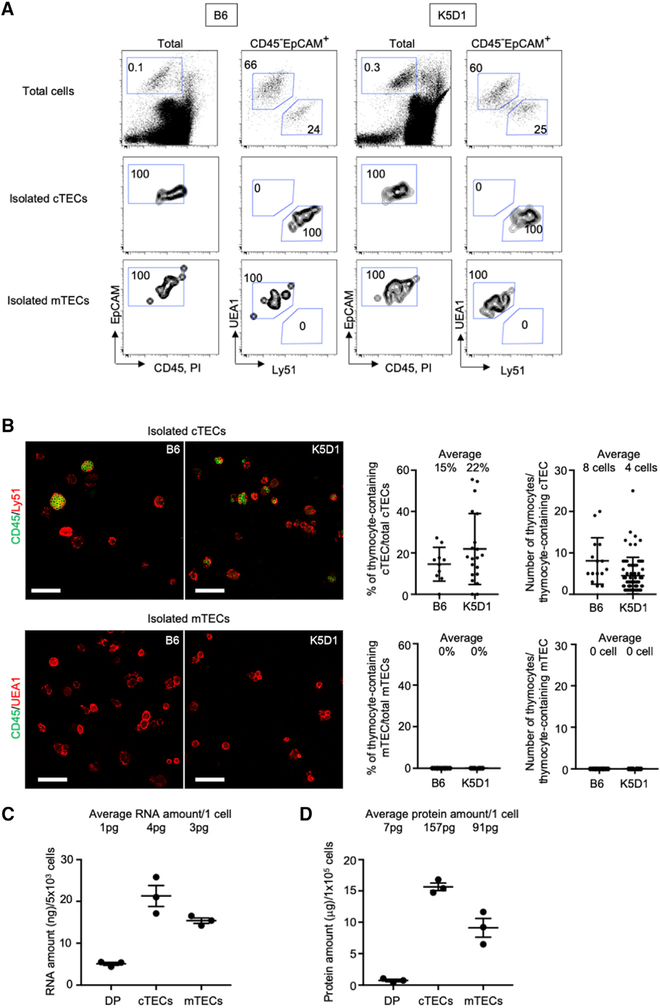
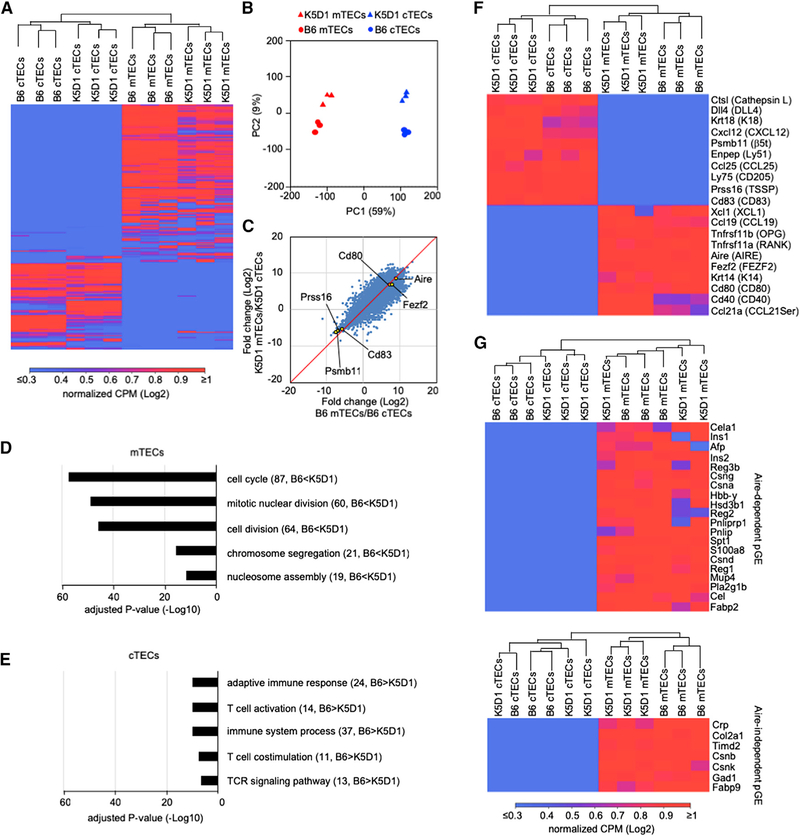
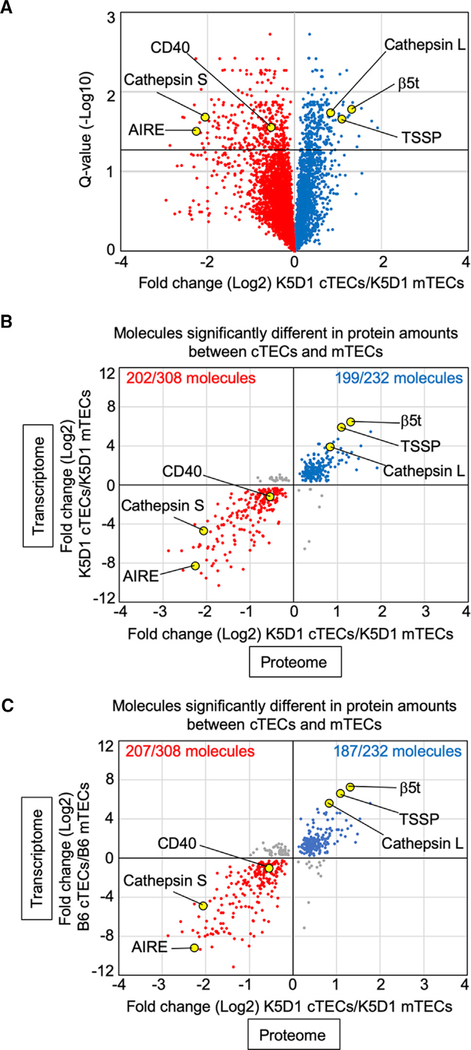
The thymic function to produce self-protective and self-tolerant T cells is chiefly mediated by cortical thymic epithelial cells (cTECs) and medullary TECs (mTECs). Recent studies including single-cell transcriptomic analyses have highlighted a rich diversity in functional mTEC subpopulations. Because of their limited cellularity, however, the biochemical characterization of TECs, including the proteomic profiling of cTECs and mTECs, has remained unestablished. Utilizing genetically modified mice that carry enlarged but functional thymuses, here we show a combination of proteomic and transcriptomic profiles for cTECs and mTECs, which identified signature molecules that characterize a developmental and functional contrast between cTECs and mTECs. Our results reveal a highly specific impact of the thymoproteasome on proteasome subunit composition in cTECs and provide an integrated trans-omics platform for further exploration of thymus biology.

Keywords: Psmb11; cortical thymic epithelial cells; cyclin D1; medullary thymic epithelial cells; proteome; thymoproteasome; trans-omics.


Conflict of interest statement

DECLARATION OF INTERESTS

The authors declare no conflicting interests.

Figures

Figure 1.
Figure 1.. K5D1 Thymus Produces Functionally Competent and Self-Tolerant T Cells
(A) Flow cytometric analysis of TECs from B6 and K5D1 mice. Plots on the left show the number (means and SEMs, n = 5) of CD45EpCAM+PI viable TECs. Dot plots on the right show UEA1 and Ly51 expression profiles of CD45EpCAM+PI viable TECs. (B) Flow cytometric analysis of thymocytes from B6 and K5D1 mice. Plots on the left show the number (means and SEMs, n = 5) of total thymocytes. Dot plots on the right show CD4 and CD8 expression (left) and TCRβ and TCRδ expression (right) in PI viable thymocytes. (C) Immunofluorescence analysis of thymic sections from K5D1 mice. Top: β5t (green), UEA1 reactivity (blue), and Aire (magenta). Bottom: CD4 (green), CD8 (blue), and UEA1 reactivity (red). Representative data from three independent experiments are shown. Scale bars, 100 μm. (D) Flow cytometric analysis of thymocytes from K5D1-β5t+/− heterozygous (Het) and K5D1-β5t−/− knockout (KO) mice. Plots show cell number (means and SEMs, n = 3) of CD4+CD8TCRβhigh and CD4CD8+TCRβhigh thymocytes. (E) Flow cytometric analysis of spleen cells from B6 and K5D1 mice. Dot plots on the left show CD4 and CD8 expression in TCRβhigh PI viable cells. Plots on the right show cell number (means and SEMs, n = 5) of CD4+CD8TCRβhigh and CD4CD8+ TCRβhigh cells. (F) Allogenic response of spleen T cells from B6 and K5D1 mice. Cell Trace Violet (CTV)-labeled splenocytes were cultured with stimulator cells for 6 days. Dot plots on the left show CTV fluorescence and CD25 expression in TCRβhigh viable cells from K5D1 mice cultured with indicated stimulator cells. Plots on the right show the frequency (means and SEMs, n = 6) of CTVlow CD25high cells in TCRβhigh viable cells from B6 mice (left) and K5D1 mice (right). Numbers in dot plots indicate frequency of cells within indicated area. (G) Hematoxylin- and eosin-stained sections of eyes and salivary glands from indicated mice. Bars, 100 μm. Mice were analyzed at 10 to 20 weeks old in an age-matched manner. *p < 0.05; **p < 0.01; ***p < 0.001; n.s., not significant.
Figure 2.
Figure 2.. Isolated cTECs but not mTECs Contain Thymic Nurse Cells
(A) Flow cytometric analysis of enzyme-digested total thymic cells (top), CD45EpCAM+UEA1Ly51+ isolated cTECs (middle), and CD45EpCAM+ UEA1+Ly51 isolated mTECs (bottom) from B6 and K5D1 mice. Shown are profiles of EpCAM and CD45+PI expression in total cells (left) and UEA1 reactivity and Ly51 expression in PICD45EpCAM+ viable cells (right). Numbers in dot plots indicate frequency of cells within indicated area. (B) Confocal microscopic analysis of isolated cTECs and mTECs. Cells were fixed, permeabilized, and stained for CD45. Shown on the left are representative images of CD45+ thymocytes (green) in Ly51+ cTECs (top) and UEA1+ mTECs (bottom) isolated from B6 mice (left) and K5D1 mice (right). Left plots show the frequency of thymocyte-containing cTECs (top) and mTECs (bottom) in total cTECs and mTECs, respectively. Numbers show average frequencies. Right plots show the number of thymocytes in thymocyte-containing cTEC (top) and mTEC (bottom). Numbers show average thymocyte numbers. Means and SEMs from 10 to 20 images in two independent experiments are shown. (C) Fluorometric measurement of RNA amount (means and SEMs, n = 3) per 5 × 10³ flow-cytometry-isolated CD4+CD8+ (DP) thymocytes, cTECs, and mTECs from K5D1 mice. Numbers (pg) show deduced average RNA amount per cell. (D) Fluorometric measurement of protein amount (means and SEMs, n = 3) per 1 × 10⁵ flow-cytometry-isolated CD4+CD8+ (DP) thymocytes, cTECs, and mTECs from K5D1 mice. Numbers (pg) show deduced average protein amount per cell.
Figure 3.
Figure 3.. RNA Sequencing Analysis of cTECs and mTECs
(A) Unsupervised hierarchical cluster analysis and heatmap for detected genes in cTECs and mTECs (n = 3) isolated from B6 mice and K5D1 mice. (B) Principal component (PC) analysis of RNA sequencing data of indicated cell populations. (C) Correlation plot analysis of the transcriptome according to log2 fold change (mTECs/cTECs) between B6 and K5D1 TECs. (D and E) Enrichment analysis of the ontology for genes that are differently expressed (RPKM > 1, log2 fold change > 1 or < 1, Q < 0.05) between B6 and K5D1 TECs. Bars show the adjusted p values of top 5 categories enriched in mTECs (D) and cTECs (E). Numbers in parentheses indicate the number of categorized genes. (F) Unsupervised hierarchical cluster analysis and heatmap of genes that are associated with the unique functions of cTECs and mTECs. (G) Unsupervised hierarchical cluster analysis and heatmap of Aire-dependent (top) and Aire-independent (bottom) promiscuously expressed genes. pGE, promiscuous gene expression.
Figure 4.
Figure 4.. Proteomic and Trans-omics Analyses of cTECs and mTECs
(A) Volcano plot analysis of TMT-based quantitative proteomes for cTECs and mTECs. Detected proteins are plotted as log2 fold changes (K5D1 cTECs/K5D1 mTECs) versus −log10 Q values. Black horizontal line in the plot shows the Q value of 0.05. (B and C) Correlation plot analysis of trans-omics profiles for cTECs and mTECs. Log2 fold changes of proteins differently (Q < 0.05) expressed between K5D1 cTECs and K5D1 mTECs are plotted against transcriptomic log2 fold changes between K5D1 cTECs and K5D1 mTECs (B) and B6 cTECs and B6 mTECs (C). Among the 308 molecules that are significantly (Q < 0.05) more abundant in mTECs than in cTECs in proteomic analysis, 202 (B) and 207 (C) molecules (red symbols) are more highly detected in mTECs than in cTECs in transcriptomic data. Among the 232 molecules that are significantly (Q < 0.05) more abundant in cTECs than mTECs in proteomic analysis, 199 (B) and 187 (C) molecules (blue symbols) are more highly detected in cTECs than in mTECs in transcriptomic data.
Figure 5.
Figure 5.. RNA Sequencing Analysis of cTECs Isolated from β5t-Deficient Mice
(A) Principal component (PC) analysis of RNA sequencing data of indicated cell populations. β5tKO, β5t-knockout. (B) Correlation plot analysis of transcriptome according to log2 fold change (β5tKO cTECs/control cTECs) between B6 and K5D1 TECs. Red lines indicate −5 and 5 of log2 fold change. (C) qPCR analysis of mRNA expression levels (means and SEMs, n = 3) of indicated genes relative to Gapdh levels in cTECs isolated from B6 and B6-β5tKO mice. Numbers at the bottom of the plots show average RPKM values and log2 fold change values (B6 cTECs/B6-β5tKO cTECs) of RNA sequencing data. (D) qPCR analysis of mRNA expression levels (means and SEMs, n = 5 to 7) of indicated genes relative to Gapdh levels in B6 and B6-β5tKO cTECs. Numbers at the bottom of the plots show average RPKM values of RNA sequencing data. (E) Flow cytometric analysis of β-catenin expression in cTECs. Histograms show β-catenin expression in B6-β5tHet cTECs (blue line) and B6-β5tKO cTECs (red line). Shaded area and black line represent the fluorescence in the absence of anti-β-catenin antibody in B6-β5tHet cTECs and B6-β5tKO cTECs, respectively. Plots on the right show relative fluorescence intensity index (means and SEMs, n = 3) of the fluorescence histograms. (F) Flow cytometric analysis of semi-mature and mature thymocytes from B6-β5tHet and B6-β5tKO mice. Plots show cell numbers (means and SEMs, n = 4) of MHC class Ilow CD69high TCRβhigh CCR7high (semi-mature, SM), MHC class Ihigh CD69high TCRβhigh CCR7high (mature 1, M1), and MHC class Ihigh CD69low TCRβhigh CCR7high (mature 2, M2) subpopulations within CD4+CD8 thymocytes (left; 4SM, 4M1, and 4M2) and CD4CD8+ thymocytes (right; 8SM, 8M1, and 8M2). *p < 0.05; ***p < 0.001; n.s., not significant; n.d., not detected.
Figure 6.
Figure 6.. Alteration in Proteasome Components in cTECs in β5t-Deficient Mice
(A) Volcano plot analysis of proteomes for K5D1-β5tKO cTECs and K5D1 cTECs. Detected proteins are plotted as log2 fold changes (K5D1-β5tKO cTECs/K5D1 cTECs) versus −log10 Q values. Black horizontal line in the plot shows the Q value of 0.05. (B) Enrichment analysis of the ontology for proteins differently (Q < 0.4) expressed between K5D1 cTECs and K5D1-β5tKO cTECs. Bars show the adjusted p values of top 5 categories. Numbers in parentheses indicate the number of categorized proteins. (C and D) Volcano plots for 20S proteasome components (C) and regulatory particle proteasome components (D). Plotted are log2 fold changes (K5D1-β5tKO cTECs/K5D1 cTECs) versus −log10 Q values for individual components. (E) Label-free proteomic analysis of protein abundance of cTECs isolated from K5D1 and K5D1-β5tKO mice. Plotted are log2 fold changes (K5D1-β5tKO cTECs/K5D1 cTECs) of 20S proteasome components (left) and regulatory particle proteasome components (right) in two independent measurements. (F) Immunoblot analysis of β5t, α6, α7, β3, Rpn1, and Rpn13 proteins in cTECs and mTECs isolated from K5D1 mice and K5D1-β5tKO mice. β-actin was examined as loading control. (G) Immunoblot analysis of β5t, β5i, β5, β2i, β1i, β2, and β1 proteins in cTECs and mTECs isolated from K5D1 mice and K5D1-β5tKO mice. β-actin was examined as loading control. Numbers show relative amounts of the signals normalized with those of actin. (H) Histograms show the flow cytometric detection of β5t (top) and α6 (middle) along with the background signals detected by isotype control reagents (bottom) in cTECs and mTECs from B6 mice (black line) and B6-β5tKO mice (red line). Numbers in histograms show the mean fluorescence intensity (MFI). Plots on the right show the relative fluorescence intensity indexes (RFI; means and SEMs, n = 4) of β5t (top) and α6 (bottom) expression. ***p < 0.001; n.s. not significant (comparison between B6 and KO groups). (I) Coomassie Brilliant Blue stained SDS-PAGE gels showing the production and purification of β5t-His, β5i-His, and β5-His proteins (top). The absolute amounts of purified proteins were determined by a fluorometer and normalized to protein purity. Immunoblot analysis of indicated amounts of β5t-His, β5i-His, and β5-His proteins (middle). Standard curves between the amounts of purified β5t-His, β5i-His, and β5-His proteins on the x axis and the integrated density of the immunoblot signals on the y axis (bottom). (J) Immunoblot analysis of β5t, β5i, and β5 proteins in indicated amounts (μg) of the lysates of cTECs and mTECs isolated from K5D1 mice and K5D1-β5tKO mice. The amounts of indicated proteins (n = 3) were deduced according to the standard curves shown in (I).
Figure 7.
Figure 7.. No Constitutive Stress Response in cTECs in β5t-Deficient Mice
(A) Proteasome activity in β5t-deficient and control cTECs. Histograms show the detection of proteasome activity by cell-permeable triple-leucine substrate-based fluorescent probe in cTECs and mTECs of B6 mice (blue line) and B6-β5tKO mice (red line). Shaded area and black line represent background fluorescence profiles without the addition of proteasome probe in B6 TECs and B6-β5tKO TECs, respectively. Plots on the right show relative fluorescence intensity index (means and SEMs, n = 10–11). B6-ctrl indicates B6 and B6-β5tHet mice. n.s., not significant. (B) Immunoblot analysis of ubiquitin in cTECs and mTECs isolated from K5D1 and K5D1-β5tKO mice. NIH 3T3 cells with or without proteasome inhibitor MG132 treatment were also examined. (C and D) qPCR analysis of mRNA expression levels (means and SEMs, n = 10) of p62/Sqstm1 (C) and Nrf1 (D) relative to Gapdh in cTECs and mTECs isolated from B6 and B6-β5tKO mice. n.s., not significant. (E) Volcano plot analysis of TMT-based quantitative proteomes for K5D1-β5tKO cTECs and K5D1 cTECs, highlighting proteins with the ontology of ER stress response (yellow symbols). Detected proteins are plotted as log2 fold changes (K5D1-β5tKO cTECs/K5D1 cTECs) versus −log10 Q values. Black horizontal line in the plot shows the Q value of 0.05. (F) Immunofluorescence analysis of LC3 (red) and β5t-venus (green) in the thymic sections of B6-β5tHet (β5tVenus/+) and B6-β5tKO (β5tVenus/Venus) mice. Representative data from two independent experiments are shown. Scale bars, 5 μm. (G) Volcano plot analysis of TMT-based quantitative proteomes for K5D1-β5tKO cTECs and K5D1 cTECs, highlighting proteins with the ontology of autophagy (yellow symbols). Detected proteins are plotted as log2 fold changes (K5D1-β5tKO cTECs/K5D1 cTECs) versus −log10 Q values. Black horizontal line in the plot shows the Q value of 0.05.

Comment in

References

    1. Anderson G, and Takahama Y (2012). Thymic epithelial cells: working class heroes for T cell development and repertoire selection. Trends Immunol. 33, 256–263. - PubMed
    1. Anderson G, Jenkinson EJ, Moore NC, and Owen JJ (1993). MHC class II-positive epithelium and mesenchyme cells are both required for T-cell development in the thymus. Nature 362, 70–73. - PubMed
    1. Anderson MS, Venanzi ES, Klein L, Chen Z, Berzins SP, Turley SJ, von Boehmer H, Bronson R, Dierich A, Benoist C, and Mathis D (2002). Projection of an immunological self shadow within the thymus by the aire protein. Science 298, 1395–1401. - PubMed
    1. Apavaloaei A, Brochu S, Dong M, Rouette A, Hardy MP, Villafano G, Murata S, Melichar HJ, and Perreault C (2019). PSMB11 orchestrates the development of CD4 and CD8 thymocytes via regulation of gene expression in cortical thymic epithelial cells. J. Immunol 202, 966–978. - PubMed
    1. Benjamini Y, and Hochberg Y (1995). Controlling the false discovery rate: a practical and powerful approach to multiple testing. J. R. Stat. Soc. B 57, 289–300.

Publication types