. 2020 Aug;16(8):1436-1452.
doi: 10.1080/15548627.2019.1687213. Epub 2019 Nov 27.

Hypoxia-induced autophagy drives colorectal cancer initiation and progression by activating the PRKC/PKC-EZR (ezrin) pathway

Affiliations

Hypoxia-induced autophagy drives colorectal cancer initiation and progression by activating the PRKC/PKC-EZR (ezrin) pathway

Komal Qureshi-Baig et al. Autophagy. 2020 Aug.

Abstract

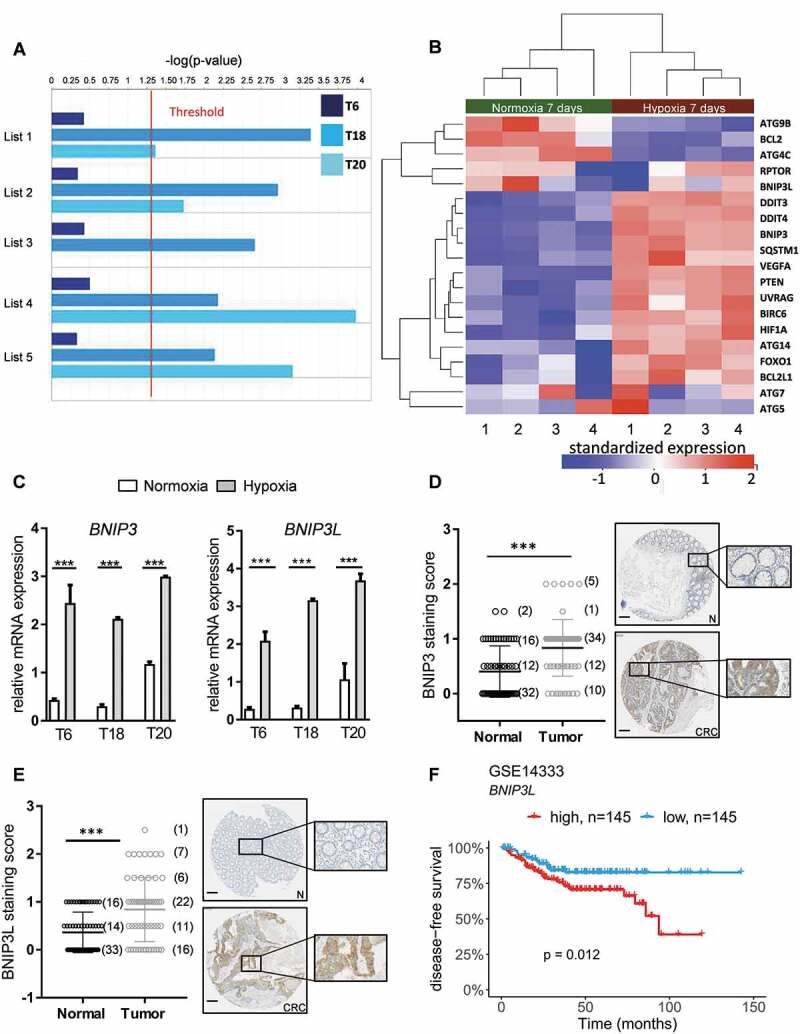
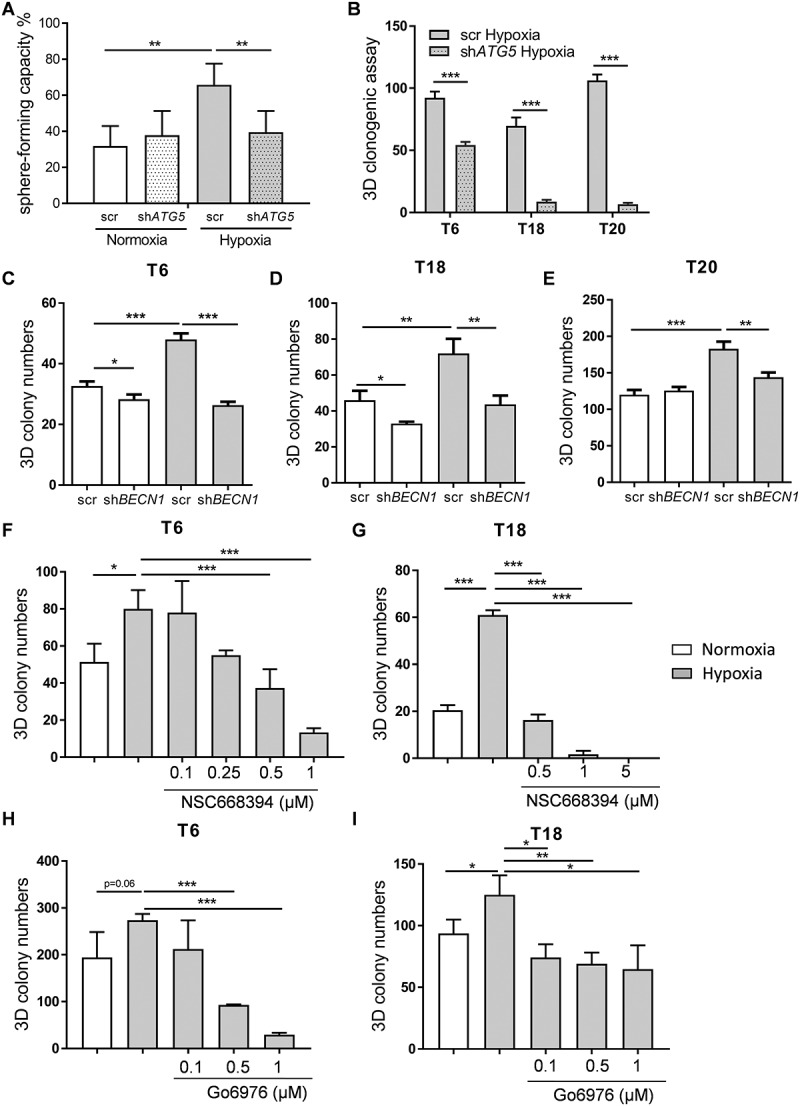
In solid tumors, cancer stem cells (CSCs) or tumor-initiating cells (TICs) are often found in hypoxic niches. Nevertheless, the influence of hypoxia on TICs is poorly understood. Using previously established, TIC-enrichedpatient-derived colorectal cancer (CRC) cultures, we show that hypoxia increases the self-renewal capacity of TICs while inducing proliferation arrest in their more differentiated counterpart cultures. Gene expression data revealed macroautophagy/autophagy as one of the major pathways induced by hypoxia in TICs. Interestingly, hypoxia-induced autophagy was found to induce phosphorylation of EZR (ezrin) at Thr567 residue, which could be reversed by knocking down ATG5, BNIP3, BNIP3L, or BECN1. Furthermore, we identified PRKCA/PKCα as a potential kinase involved in hypoxia-induced autophagy-mediated TIC self-renewal. Genetic targeting of autophagy or pharmacological inhibition of PRKC/PKC and EZR resulted in decreased tumor-initiating potential of TICs. In addition, we observed significantly reduced in vivo tumor initiation and growth after a stable knockdown of ATG5. Analysis of human CRC samples showed that p-EZR is often present in TICs located in the hypoxic and autophagic regions of the tumor. Altogether, our results establish the hypoxia-autophagy-PKC-EZR signaling axis as a novel regulatory mechanism of TIC self-renewal and CRC progression. Autophagy inhibition might thus represent a promising therapeutic strategy for cancer patients.

Abbreviations: ATG: autophagy related; BECN1: beclin 1; BNIP3: BCL2 interacting protein 3; BNIP3L: BCL2 interacting protein 3 like; CQ: chloroquine; CSC: cancer stem cells; CRC: colorectal cancer; HIF1A/HIF-1α: hypoxia inducible factor 1 subunit alpha; MAP1LC3/LC3: microtubule associated protein 1 light chain 3; PRKC/PKC: protein kinase C; SQSTM1/p62: sequestosome 1; TICs: tumor-initiating cells.

Keywords: Autophagy; cancer stem cell; colorectal cancer; ezrin; hypoxia; protein kinase C; self-renewal capacity; tumor-initiating cell.


Conflict of interest statement

No potential conflict of interest was reported by the authors.

Figures

Figure 1.
Figure 1.
Hypoxia increases the self-renewal capacity of patient-derived TIC cultures. (A) HIF1A protein expression under normoxic (N) and hypoxic (H) culturing conditions over 3 d (72 h) and 7 d in T6 TICs. TUBA staining was used as a loading control and HepG2 cells exposed to hypoxia for 24 h were used as a positive control (+). (B) Representative image of patient T6-derived TICs, cultured under normoxia (N) and hypoxia (H). Scale: 100 µm. (C-H) Self-renewal capacity as determined by the 1000 cell sphere formation assay (C-E) in T6 (C), T18 (D) and T20 (E) cultures and by the single cell assay (F-G) in T6 (F) and T18 (G) cultures. Sphere formation was observed over several passages (P). (H) Self-renewal capacity was determined by a limiting dilution assay at multiple cell doses under normoxia and hypoxia. Results from one experiment using T6 TICs are shown and ELDA was used to assess significance. C-G; Data are representative of at least three independent experiments. (I-J) Hypoxia induces the expression of stem cell markers. (I) Flow cytometry staining of POU5F1 in T18 TICs under normoxic and hypoxic conditions and quantification of mean fluorescence intensity (MFI) of POU5F1 in two independent experiments (data normalized to normoxia). (J) Flow cytometry staining of ALDH1A1 in T18 TICs under normoxic and hypoxic conditions and quantification of mean fluorescence intensity (MFI) of ALDH1A1 in two independent experiments (data normalized to normoxia). Data are presented as mean ± SD except for F, G, and H, which are presented as a mean with 95% confidence interval, *p < 0.05, **p < 0.01, ***p < 0.001, ns = not significant.
Figure 2.
Figure 2.
Autophagy is enriched in patient-derived TIC cultures exposed to hypoxia. (A) Bar plots showing the statistical significance (-log[p-value]) of autophagy in TICs derived from patients T6, T18 & T20 after 7 d of hypoxic treatment, as determined by IPA functional analysis using a combination of five different autophagy databases (see Material and Methods). Statistical threshold (red line) is set at -log(p-value) = 1.3. (B) Standardized expression of key autophagy genes in patient T18-derived TICs. Heat map of up- or downregulation of selected key autophagy genes in T18 TICs after 7 d treatment with hypoxia (H) and normoxia (N). Gene expression levels of BNIP3 and BNIP3L, targets of HIF1A, and key genes involved in the initiation of autophagy in hypoxia. Red indicates upregulation and blue downregulation. Significance is based on adjusted p-values (or FDR) of hypoxia-normoxia comparison after 7 d (C) Gene expression levels of BNIP3 and BNIP3L in T6-, T18-, and T20-derived TICs after 72 h of hypoxia (H) and normoxia (N). Representative figure of at least three independent experiments per TIC culture. Data are presented as mean ± SD, ***p < 0.001. (D-E) Immunohistochemical staining of BNIP3 (D) and BNIP3L (E) on paired CRC tissue microarrays. Matched tumor (CRC) and control mucosa (N) samples were scored for the intensity of BNIP3 (n = 62 matched samples) and BNIP3L (n = 63 matched samples) positive cells, ranging from 0 (= no signal) to 2 (= strong signal). Scale bar: 200 μm. Data are presented as mean ± SD, ***p < 0.001. Paired t-tests were used to assess the significance between tumor and normal counterpart tissues in D and E. (F) Relapse-free CRC patient survival, according to BNIP3L expression in the publicly available dataset GSE14333, *p < 0.05.
Figure 3.
Figure 3.
Hypoxia induces the formation of autophagosomes and autophagy inhibition via ATG5 knockdown decreases the number of autophagosomes in hypoxic TICs. (A-B) Control (scr) and ATG5-defective (shATG5) T6, T18 and T20-derived TICs were transfected with GFP-LC3 and cultivated in (A) normoxic and (B) hypoxic environments (overnight, at 0.1% oxygen level, see Material and Methods). Autophagosomes (green dot-like structures) were visualized by confocal microscopy. Images represent three independent experiments, scale bar: 5 µm. (C-E) Quantification of the number of autophagosomes in control (scr) and ATG5-defective (shATG5) patient-derived (C) T6, (D) T18 and (E) T20 TICs cultured under normoxia or hypoxia. (F) SQSTM1 protein expression in normoxic (N) and hypoxic (H) TICs after the addition of chloroquine. Western blot images are representative of two independent experiments. (G) SQSTM1 protein expression in ATG5-defective (+) and scramble (-) TICs under normoxia (N) or hypoxia (H). Western blot images are representative of two independent experiments. (H) Detection and quantification of autophagosomes in TICs after BECN1, BNIP3, and BNIP3L knockdown. For the quantification of autophagosomes (C-E and H), ten cells were counted for each condition and the average number of autophagosomes was reported. Statistically significant differences are shown as *p < 0.05, **p < 0.01, ***p < 0.001. Figures displayed are representative figure of at least two independent experiments per TIC culture for C-E and H. In H, * represents statistical analysis between normoxia and hypoxia, whereas # represents the statistical analysis between the hypoxic scramble condition and the shBNIP3, shBNIP3L, and shBECN1 conditions.
Figure 4.
Figure 4.
Hypoxia induces EZR phosphorylation in an ATG5-dependent manner. (A-B) Phosphorylation of EZR at Thr567 under normoxic (N) and hypoxic (H) culturing conditions in (A) T18 and (B) T6 TICs. Data are representative of at least four independent experiments. (C-D) Activation of EZR after ATG5 knockdown in (C) T18 and (D) T6 TIC cultures after 16 h of hypoxia. Quantification was performed based on four independent experiments (mean ± SD) and is shown on the right side of the respective graph. *p < 0.05. (E-G) Activation of EZR following silencing of (E) BNIP3 (F) BNIP3L and (G) BECN1 after 16 h of hypoxia in T18 TIC cultures. Data are representative of three independent experiments and similar results were obtained for T6 TICs. (H-I) Effect of PRKCA siRNA on EZR phosphorylation under normoxia and hypoxia (16 h) in (H) T6 and (I) T18 TICs. Data are representative of two independent experiments per TIC culture. (J-K) Effect of NSC305787 and NSC668394, two chemical inhibitors of PKC-mediated EZR phosphorylation in hypoxic (16 h) T6 TICs. Data are representative of at least two independent experiments. (L) Effect of Go6976, a chemical inhibitor of PRKC, on the phosphorylation of EZR in hypoxic (16 h) T6 TICs. Data are representative of three independent experiments.
Figure 5.
Figure 5.
Inhibition of autophagy reverses hypoxia-mediated phenotype in patient-derived TICs. (A) Sphere-forming capacity (%) was determined by carrying out single cell assays in ATG5-defective (shATG5) and control (scr) T18 TICs under 10 d of normoxia (N) and hypoxia (H). Representative figure of 4 independent experiments. Data are presented as mean with a confidence interval of 0.95, p-value calculated using a chi-square test. (B) Colony numbers under hypoxia (H) for control (scr) and ATG5-defective (shATG5) TICs derived from patients T6, T18, and T20. Data are presented as a representative figure of at least 2 independent experiments per TIC culture, mean ± SD, ***p < 0.001. (C-E) Colony numbers after 10–14 d under normoxia (N) and hypoxia (H) for control (scr) and BECN1-defective (shBECN1) TICs derived from patients (C) T6, (D) T18 and (E) T20. (F-G) Colony numbers after 10–14 d of hypoxia for small inhibitor of EZR (NSC668394) treated (F) T6 and (G) T18 TICs. (H-I) Colony numbers after 10–14 d of hypoxia and Go6976 treatment for (H) T6 and (I) T18 TICs. For 3D clonogenic assays of C-I, data are representative of at least 3 independent experiments, mean ± SD, *p < 0.05, **p < 0.01, ***p < 0.001.
Figure 6.
Figure 6.
ATG5 deficiency limits tumor initiation and progression in vivo. (A) In vivo tumor growth after subcutaneous injection of 10,000 T18-derived TIC cells and subsequent intraperitoneal treatment with either CQ or PBS (n = 12 tumors per group). Data are presented as means tumor volumes (mm3) ± SEM. (B) T18 tumor weight after treatment with CQ or PBS, respectively. Data are presented as mean tumor weights (mg) ± SEM. (C) In vivo tumor growth after subcutaneous injection of 10,000 T20-derived TIC cells with/without stable knockdown of ATG5, n = 5 mice/group. (D-E) Tumor (D) growth and (E) weight in immune-deficient mice (NSG mice), 8 weeks after subcutaneous injection of 10,000 cells derived from primary T18 TICs, following a stable knockdown of ATG5 or respective control vector; n = 6/group. A representative ATG5 protein expression of extracted T18-derived xenografts is shown. All data are shown as mean ± SEM. Two-way ANOVA followed by the Tukey post-hoc test was used to test for statistical significance in A, C and D. Paired t-tests were used to assess significance in B, and E. *p < 0.05, ***p < 0.001 (F) p-EZR immunofluorescence staining in extracted xenograft tumors from (D). Scale bar: 100 µm. Representative images are shown (left panel) as well as the quantification of p-EZR-positive area (right panel). Four mice out of the six from (D) were used, as the remaining two were used in (G). Data are presented as mean ± SD, *p < 0.05. (G) Serial in vivo limiting dilution experiment with T18 TICs, following stable knockdown of ATG5 or the corresponding control vector. After an initial round of xenotransplantation, two extracted tumors (from mice appearing in [D]) were dissociated and different cell doses (100, 250 and 500 cells) were subcutaneously injected into secondary recipient NSG mice. Secondary tumor incidence was evaluated after 12 weeks. Statistical significance was assessed with a Chi-square test ** p < 0.01. (H) Potential mechanism of action. Hypoxia within a solid tumor leads to activation of autophagy, especially in TICs. Kinases, such as PRKCA, are activated and further induce phosphorylation of EZR on Thr567 in TICs. EZR, most likely through MAPK14/p38 activation, leads to increased self-renewal capacity of TICs in vitro and in vivo.
Figure 7.
Figure 7.
The relevance of the hypoxia/autophagy/EZR pathway in human TICs. (A) Immunofluorescence staining and colocalization in human tumor tissues (from six patients) for CA9 (a downstream target of HIF1A), BNIP3L, MAP1LC3A, p-EZR, and POU5F1 (refer to Fig. S7 for patient characteristics including TNM staging and HE stainings). The specificity of all used antibodies was carefully validated (please see Material and Methods and Supplementary data). Scale bar: 100 µm. (B) Staining correlation in human CRC tissues. Measures were standardized (z-score) for each patient. Dot colors indicate different patients. A repeated measure correlation test was performed in order to account for the within-individual association of paired measures (using the rmcorr package in R; see Material and Methods). The rmcorr r coefficient and the Holm adjusted p-values are reported on each plot.

References

    1. Siegel RL, Miller KD, Jemal A.. Cancer statistics, 2016. CA Cancer J Clin [Internet]. 2016. [cited 2016 September16]; 66:7–30. Available from: http://www.ncbi.nlm.nih.gov/pubmed/26742998 - PubMed
    1. Qureshi-Baig K, Ullmann P, Haan S, et al. Tumor-initiating cells: a criTICal review of isolation approaches and new challenges in targeting strategies. Mol Cancer [Internet]. 2017. [cited 2017 April27]; 16:40. Available from: http://molecular-cancer.biomedcentral.com/articles/10.1186/s12943-017-06... - DOI - PMC - PubMed
    1. Schito L, Semenza GL.. Hypoxia-inducible factors: master regulators of cancer progression. Trends Cancer [Internet]. 2016. [cited 2018 August22]; 2:758–770. Available from: http://www.ncbi.nlm.nih.gov/pubmed/28741521 - PubMed
    1. Carnero A, Lleonart M. The hypoxic microenvironment: a determinant of cancer stem cell evolution. BioEssays [Internet]. 2016. [cited 2016 November2]; 38:S65–74. - PubMed
    1. Bellot G, Garcia-Medina R, Gounon P, et al. Hypoxia-induced autophagy is mediated through hypoxia-inducible factor induction of BNIP3 and BNIP3L via their BH3 domains. Mol Cell Biol. 2009;29:2570–2581. - PMC - PubMed

Publication types

MeSH terms