. 2019 Nov 27;16(1):237.
doi: 10.1186/s12974-019-1615-0.

The effects of n-6 polyunsaturated fatty acid deprivation on the inflammatory gene response to lipopolysaccharide in the mouse hippocampus

Affiliations

The effects of n-6 polyunsaturated fatty acid deprivation on the inflammatory gene response to lipopolysaccharide in the mouse hippocampus

Shoug M Alashmali et al. J Neuroinflammation. .

Abstract

Background: Neuroinflammation is thought to contribute to psychiatric and neurological disorders such as major depression and Alzheimer's disease (AD). N-6 polyunsaturated fatty acids (PUFA) and molecules derived from them, including linoleic acid- and arachidonic acid-derived lipid mediators, are known to have pro-inflammatory properties in the periphery; however, this has yet to be tested in the brain. Lowering the consumption of n-6 PUFA is associated with a decreased risk of depression and AD in human observational studies. The purpose of this study was to investigate the inflammation-modulating effects of lowering dietary n-6 PUFA in the mouse hippocampus.

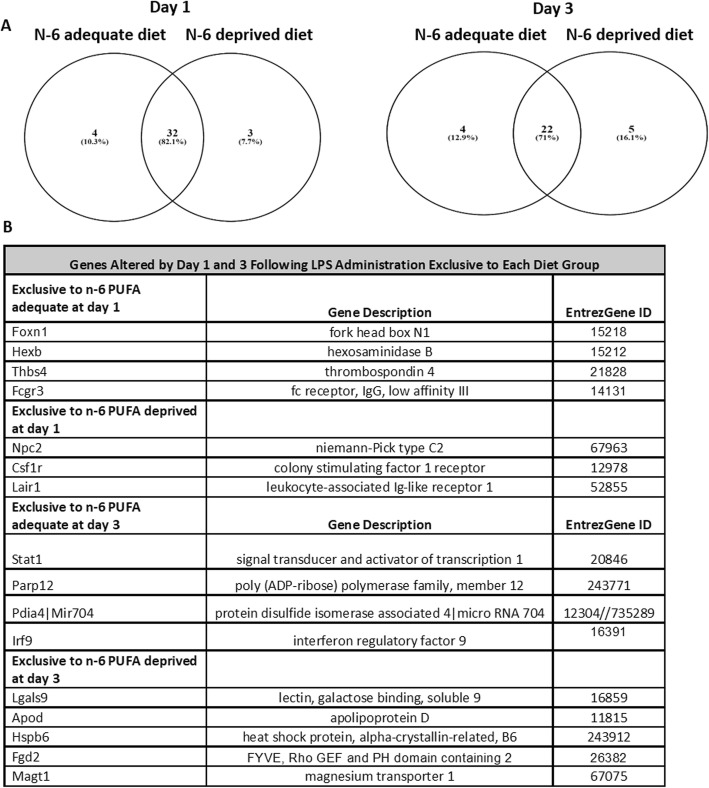
Methods: C57BL/6 male mice were fed either an n-6 PUFA deprived (2% of total fatty acids) or an n-6 PUFA adequate (23% of total fatty acids) diet from weaning to 12 weeks of age. Animals then underwent intracerebroventricular surgery, in which lipopolysaccharide (LPS) was injected into the left lateral ventricle of the brain. Hippocampi were collected at baseline and following LPS administration (1, 3, 7, and 14 days). A microarray (n = 3 per group) was used to identify candidate genes and results were validated by real-time PCR in a separate cohort of animals (n = 5-8 per group).

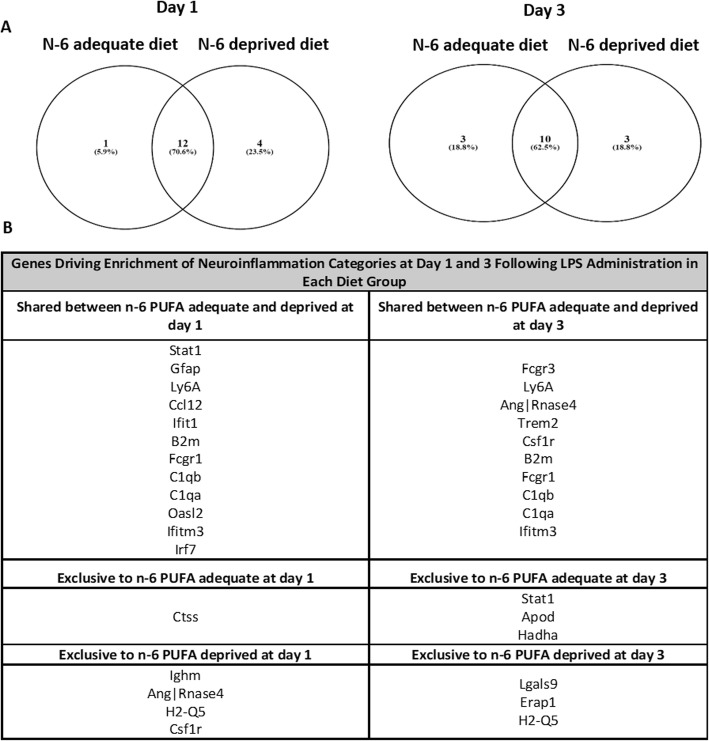
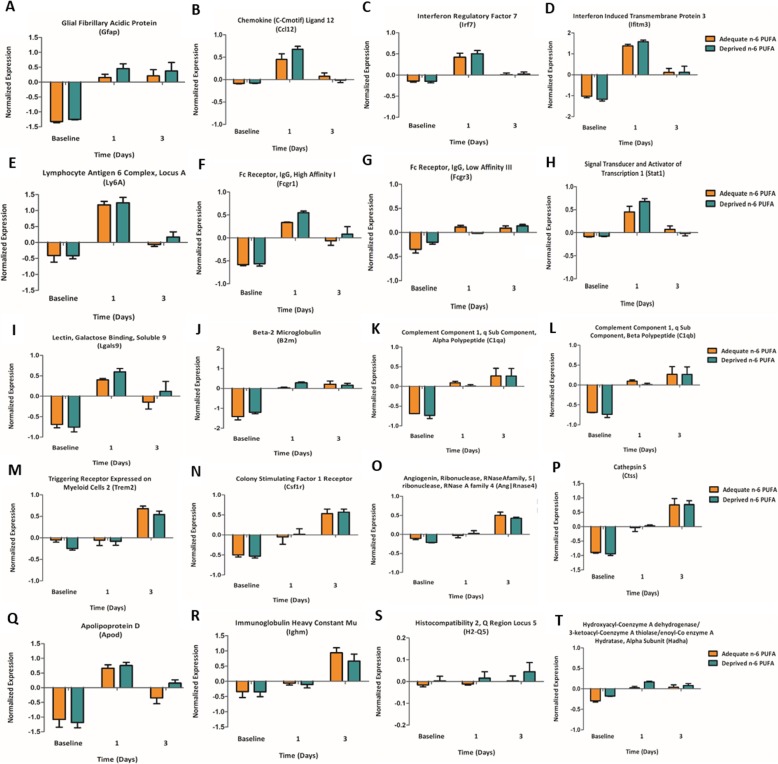
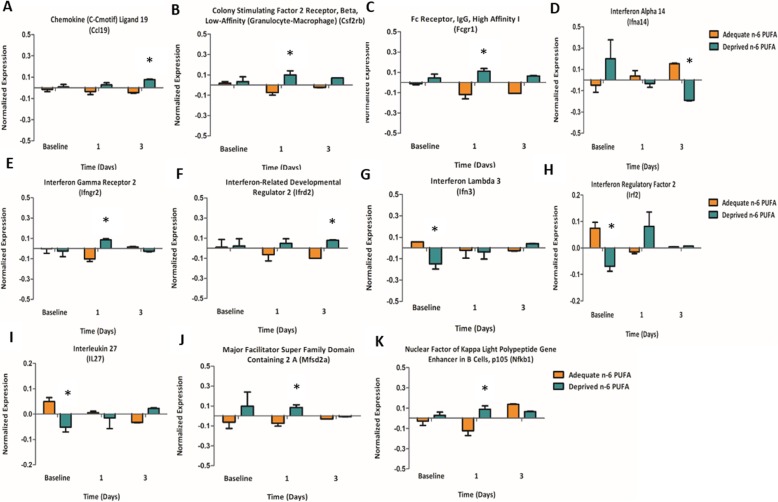
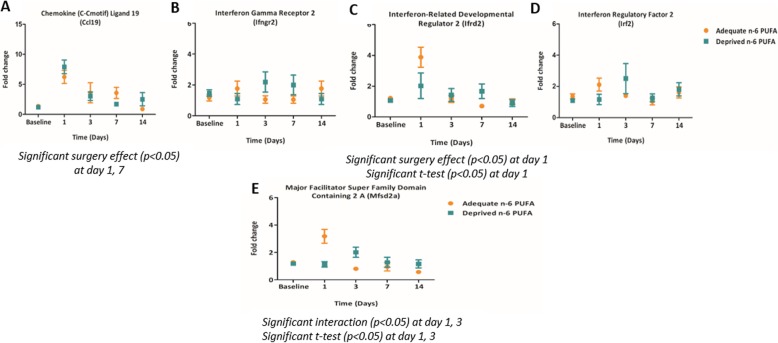
Results: Mice administered with LPS had significantly increased Gene Ontology categories associated with inflammation and immune responses. These effects were independent of changes in gene expression in any diet group. Results were validated for the effect of LPS treatment on astrocyte, cytokine, and chemokine markers, as well as some results of the diets on Ifrd2 and Mfsd2a expression.

Conclusions: LPS administration increases pro-inflammatory and lipid-metabolizing gene expression in the mouse hippocampus. An n-6 PUFA deprived diet modulated inflammatory gene expression by both increasing and decreasing inflammatory gene expression, without impairing the resolution of neuroinflammation following LPS administration.

Keywords: Arachidonic acid; Hippocampus; Linoleic acid; Lipopolysaccharide; N-6 polyunsaturated fatty acids; Neuroinflammation; mRNA.


Conflict of interest statement

RPB has received research grants from Bunge Ltd., Arctic Nutrition, the Dairy Farmers of Canada, and Nestle Inc., as well as travel support from Mead Johnson and mass spectrometry equipment and support from Sciex. RPB is on the executive of the International Society for the Study of Fatty acids and Lipids and held a meeting on behalf of Fatty Acids and Cell Signalling, both of which rely on corporate sponsorship. RPB has given expert testimony in relation to supplements and the brain. RPB also provides complimentary fatty acid analysis for farmers, food producers, and others involved in the food industry, some of whom provide free food samples.

Figures

Fig. 1
Fig. 1
Hierarchical cluster of genes significantly increased in the one-way ANOVA (uncorrected p < 0.05, corrected p < 0.1). This clustering is zoomed in on key regions of clustering with labeled branches corresponding to individual samples; a clear separation is seen between baseline (non-surgery) and days after LPS administration. We scaled the expression intensities on rows (probe sets/genes) to make them weigh equally in the clustering. The colors of the heatmap are mapped linearly low expression in green and high expression in red. Adequate: n-6 PUFA adequate diet, deprived: n-6 PUFA deprived diet. n = 3 mice per group
Fig. 2
Fig. 2
Analysis of the microarray data. a Venn diagram of genes increased by day 1 and day 3 post-LPS administration in each diet group. b List of genes increased by icv LPS administration in each diet group. n = 3 mice per group
Fig. 3
Fig. 3
Analysis of Gene Ontology. a Venn diagram of genes driving enrichment of inflammation categories. b List of genes driving enrichment of inflammation-associated gene expression categories at day 1 and day 3 post-LPS administration in each diet group. n = 3 mice per group
Fig. 4
Fig. 4
Genes driving enrichment of inflammation-associated gene expression categories at day 1 and day 3 post-LPS administration in the n-6 PUFA deprived and adequate fed mice. a Gfap, glial fibrillary acidic protein. b Ccl 12, chemokine(C-Cmotif) ligand 12. c Irf7, interferon regulatory factor 7. d Ifitm3, interferon-induced transmembrane protein 3. e Ly6a, lymphocytic antigen 6 complex, locus A. f Fcgr1, Fc receptor IgG high affinity 1 gamma polypeptide. g Fcgr3, Fc receptor IgG, low affinity III. h Stat1, signal transducer and activator of transcription 1. i Lgals9, lectin, galactose binding, soluble 9. j B2m, beta-2 microglobulin. k C1qa, complement component 1 q sub component, alpha polypeptide. l C1qb, complement component 1 q sub component, beta polypeptide. m Trem2, triggering receptor expressed on myeloid cells 2. n Csf1r, colony stimulating factor 1 receptor. o Ang|Rnase4, angiogenin, 5|ribonuclease, RNase A family 4. p Ctss, cathepsin S. q Apod, apolipoprotein D. r Ighm, immunoglobulin heavy constant mu. s MHC l: H2-Q5, histocompatibility 2, Q region locus 5. t Hadha, hydroxyacyl-Coenzyme A dehydrogenase/3-ketoacyl-Coenzyme A thiolase/enoyl-Coenzyme A hydratase (tri functional protein), alpha subunit. Gene names are provided with common name and abbreviated gene name in brackets. Bars represent means ± standard error of the mean, n = 3 mice per group. Major histocompatibility complex (MHC). Baseline refers to non-surgery; 1 and 3 refers to day 1 and day 3 post-LPS administration
Fig. 5
Fig. 5
Genes involved in inflammation in response to n-6 PUFA deprived versus adequate diet using t test data (p < 0.01) of the microarray. a Cc19, chemokine (C-Cmotif) ligand 19. b Csf2rb, colony stimulating factor 2 receptor, beta, low affinity (granulocyte-macrophage). c Fcgr1, Fc receptor IgG high affinity 1 gamma polypeptide. d Ifna14, interferon alpha 14. e Ifngr2, interferon gamma receptor 2. f Ifrd2, interferon-related developmental regulator 2. g Ifnl3, interferon lambda 3. h Irf2, interferon regulatory factor 2. i IL27, interleukin 27. j Mfsd2a, major facilitator super family domain containing 2 A. k Nfkb1, nuclear factor of kappa light polypeptide gene enhancer in B cells, p105. Asterisks indicate significant effect of n-6 PUFA deprived diet compared to n-6 PUFA adequate diet
Fig. 6
Fig. 6
Validation of a subset of genes driving the enrichment of inflammation-associated gene expression categories as well as n-6 PUFA metabolism in the microarray. a Gfap, glial fibrillary acidic protein. b Ccl 12, chemokine(C-Cmotif) ligand 12. c Irf7, interferon regulatory factor 7. d Ly6a, lymphocytic antigen 6 complex, locus A. e Fcgr1, Fc receptor IgG high affinity 1 gamma polypeptide. f cPLA2 group IVA (Pla2g4a), cytosolic phospholipase A2. Graphs represent mean ± standard error of the mean, n = 5–8 mice per group
Fig. 7
Fig. 7
Validation of a subset of genes involved in inflammation in response to n-6 PUFA deprived versus adequate diet in the microarray. a Cc19, chemokine (C-Cmotif) ligand 19. b Ifngr2, interferon gamma receptor 2. c Ifrd2, interferon-related developmental regulator 2. d Irf2, interferon regulatory factor 2. e Mfsd2a, major facilitator super family domain containing 2 A. Graphs represent mean ± standard error of the mean, n = 5–8 mice per group

References

    1. Glass CK, Saijo K, Winner B, Marchetto MC, Gage FH. Mechanisms underlying inflammation in neurodegeneration. Cell. 2010;140:918–934. doi: 10.1016/j.cell.2010.02.016. - DOI - PMC - PubMed
    1. Heneka MT, Carson MJ, Khoury JE, Landreth GE, Brosseron F, Feinstein DL, Jacobs AH, Wyss-Coray T, Vitorica J, Ransohoff RM, Herrup K, Frautschy SA, Finsen B, Brown GC, Verkhratsky A, Yamanaka K, Koistinaho J, Latz E, Halle A, Petzold GC, Town T, Morgan D, Shinohara ML, Perry VH, Holmes C, Bazan NG, Brooks DJ, Hunot S, Joseph B, Deigendesch N, Garaschuk O, Boddeke E, Dinarello CA, Breitner JC, Cole GM, Golenbock DT, Kummer MP. Neuroinflammation in Alzheimer’s disease. Lancet Neurol. 2015;14:388–405. doi: 10.1016/S1474-4422(15)70016-5. - DOI - PMC - PubMed
    1. Miller AH, Raison CL. The role of inflammation in depression: from evolutionary imperative to modern treatment target. Nat Rev Immunol. 2016;16:22–34. doi: 10.1038/nri.2015.5. - DOI - PMC - PubMed
    1. Li Q, Barres BA. Microglia and macrophages in brain homeostasis and disease. Nat Rev Immunol. 2018;18:225–242. doi: 10.1038/nri.2017.125. - DOI - PubMed
    1. Ransohoff RM, Engelhardt B. The anatomical and cellular basis of immune surveillance in the central nervous system. Nat Rev Immunol. 2012;12:623–635. doi: 10.1038/nri3265. - DOI - PubMed

LinkOut - more resources