. 2019 Nov 27;18(1):207.
doi: 10.1186/s12944-019-1145-x.

Angiotensin-converting enzyme 2 regulates endoplasmic reticulum stress and mitochondrial function to preserve skeletal muscle lipid metabolism

Affiliations

Angiotensin-converting enzyme 2 regulates endoplasmic reticulum stress and mitochondrial function to preserve skeletal muscle lipid metabolism

Xi Cao et al. Lipids Health Dis. .

Abstract

Objective: Endoplasmic reticulum (ER) stress and mitochondrial function affected intramuscular fat accumulation. However, there is no clear evident on the effect of the regulation of ER stress and mitochondrial function by Angiotensin-converting enzyme 2 (ACE2) on the prevention of intramuscular fat metabolism. We investigated the effects of ACE2 on ER stress and mitochondrial function in skeletal muscle lipid metabolism.

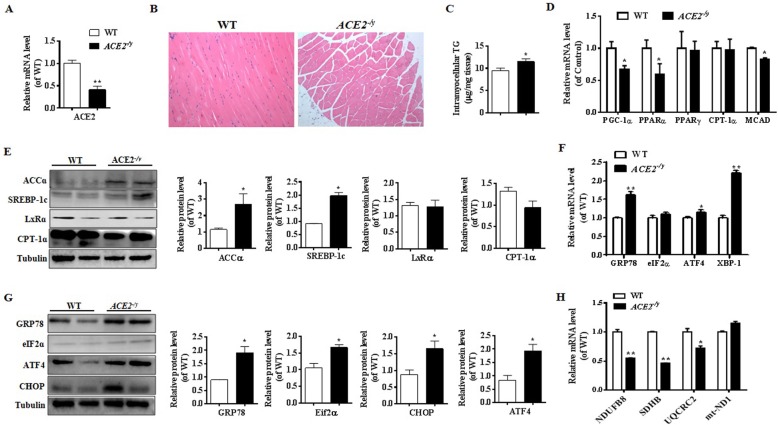
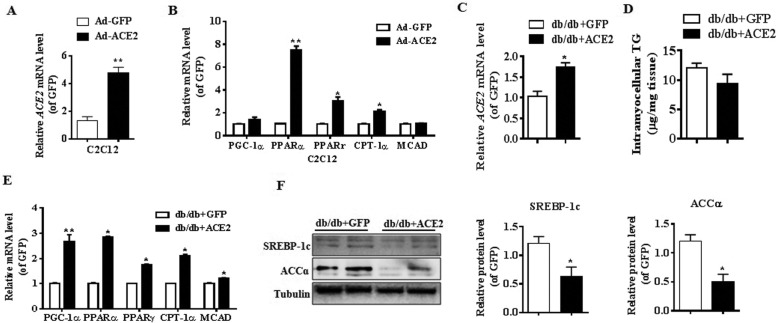
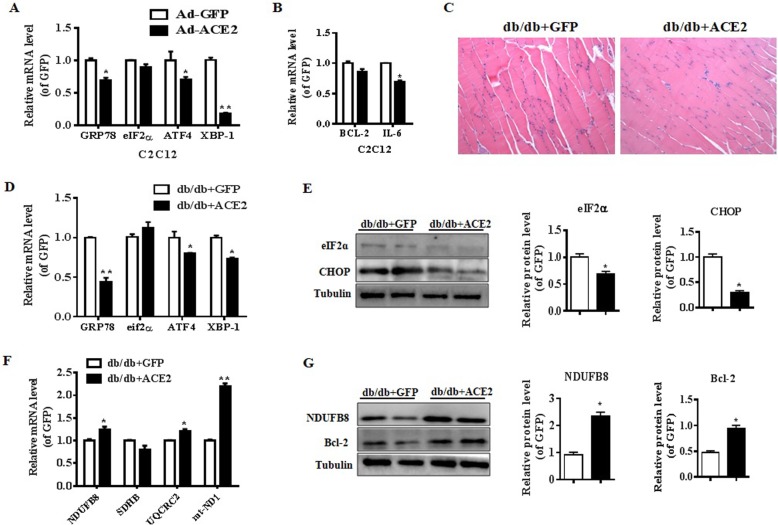
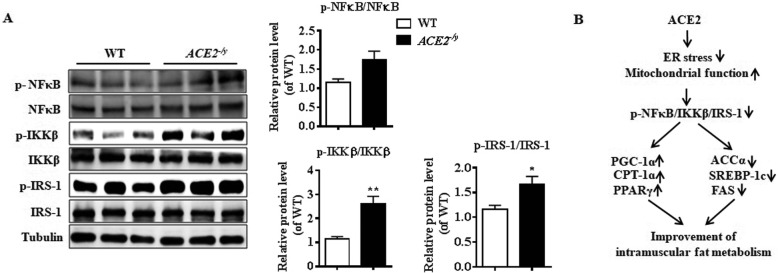
Methods: The triglyceride (TG) content in skeletal muscle of ACE2 knockout mice and Ad-ACE2-treated db/db mice were detected by assay kits. Meanwhile, the expression of lipogenic genes (ACCα, SREBP-1c, LXRα, CPT-1α, PGC-1α and PPARα), ER stress and mitochondrial function related genes (GRP78, eIF2α, ATF4, BCL-2, and SDH6) were analyzed by RT-PCR. Lipid metabolism, ER stress and mitochondrial function related genes were analyzed by RT-PCR in ACE2-overexpression C2C12 cell. Moreover, the IKKβ/NFκB/IRS-1 pathway was determined using lysate sample from skeletal muscle of ACE2 knockout mice.

Results: ACE2 deficiency in vivo is associated with increased lipid accumulation in skeletal muscle. The ACE2 knockout mice displayed an elevated level of ER stress and mitochondrial dysfunctions in skeletal muscle. In contrast, activation of ACE2 can ameliorate ER stress and mitochondrial function, which slightly accompanied by reduced TG content and down-regulated the expression of skeletal muscle lipogenic proteins in the db/db mice. Additionally, ACE2 improved skeletal muscle lipid metabolism and ER stress genes in the C2C12 cells. Mechanistically, endogenous ACE2 improved lipid metabolism through the IKKβ/NFκB/IRS-1 pathway in skeletal muscle.

Conclusions: ACE2 was first reported to play a notable role on intramuscular fat regulation by improving endoplasmic reticulum and mitochondrial function. This study may provide a strategy for treating insulin resistance in skeletal muscle.

Keywords: ACE2; Endoplasmic reticulum; Intramuscular fat; Mitochondrial function.


Conflict of interest statement

The authors have no conflicts of interest to disclose.

Figures

Fig. 1
Fig. 1
Analysis of lipid metabolism, ER stress and mitochondrial function in skeletal muscle of ACE2−/y mice. a: Relative ACE2 expression level in skeletal muscle of ACE2−/y mice. b: H&E-stained histology of gastrocnemius muscle in the ACE2−/y and WT mice (100× H&E). c: Analysis of intramuscular triglyceride concentration in skeletal muscle of ACE2−/y mice. d: Relative gene expression levels of fatty acid oxidation-related genes (PGC-1α, PPARα, PPARγ, CPT-1α, and MCAD). e: Relative protein levels of lipid-metabolizing (ACCα, SREBP-1c, LXRα and CPT-1α). f: Relative gene expression levels of ER stress-related genes (GRP78, Eif2α, ATF4 and XBP-1). g: Relative protein levels of GRP78, Eif2α, ATF4 and CHOP in the skeletal muscle of ACE2−/y mice. h: Relative gene expression levels of NDUFB8, SDHB, UQCRC2 and mt-ND1 in the skeletal muscle of ACE2−/y mice. The data are presented as the mean ± SD of n = 4 independent experiments in ACE2−/y mice. *P < 0.05 and **P < 0.01 versus WT mice by Student’s t test
Fig. 2
Fig. 2
Analysis of lipid metabolism in ACE2-overexpressing C2C12 cells and Ad-ACE2-treated db/db mice. a: Relative ACE2 expression level in ACE2-overexpressing C2C12 cells. b: Relative gene expression levels of fatty acid oxidation-related genes (PGC-1α, PPARα, PPARγ, CPT-1α, and MCAD). c: Relative ACE2 expression level in skeletal muscle of Ad-ACE2-treated db/db mice. d: Analysis of intramuscular triglyceride concentration in skeletal muscle of Ad-ACE2-treated db/db mice. e: Relative gene expression levels of fatty acid oxidation-related genes (PGC-1α, PPARα, PPARγ, CPT-1α, and MCAD). f: Relative protein levels of lipid-metabolizing (SREBP-1c and ACCα). The data are presented as the mean ± SD of n = 3 independent experiments in C2C12 cells, n = 3 in Ad-ACE2-treated db/db mice. *P < 0.05 and **P < 0.01 versus Ad-GFP cell or Ad-GFP-treated mice by Student’s t test
Fig. 3
Fig. 3
ACE2 regulated ER stress and mitochondrial function in ACE2-overexpressing C2C12 cells and Ad-ACE2-treated db/db mice. a: Relative gene expression levels of ER stress-related genes (GRP78, Eif2α, ATF4 and XBP-1) in ACE2-overexpressing C2C12 cells. b: Relative gene expression levels of BCL-2 and IL-6 in ACE2-overexpressing C2C12 cells. c: H&E-stained histology of gastrocnemius muscle in the Ad-ACE2-treated and Ad-GFP-treated db/db mice (100× H&E). d: Relative gene expression levels of ER stress-related genes (GRP78, Eif2α, ATF4 and XBP-1). e: Relative protein levels of eIF2α and CHOP in the skeletal muscle of Ad-ACE2-treated db/db mice. f: Relative gene expression levels of NDUFB8, SDHB, UQCRC2 and mt-ND1 in the skeletal muscle of Ad-ACE2-treated db/db mice. g: Relative protein levels of NDUFB8 and Bcl-2 in the skeletal muscle of Ad-ACE2-treated db/db mice. The data are presented as the mean ± SD of n = 3 independent experiments in C2C12 cells, n = 3 in Ad-ACE2-treated db/db mice. *P < 0.05 and **P < 0.01 versus Ad-GFP cell or Ad-GFP-treated mice by Student’s t test
Fig. 4
Fig. 4
Analysis of IKKβ/NFκB/IRS-1 pathway in skeletal muscle of ACE2−/y mice. a: Relative protein levels of NFκB (p-NFκB), IKKβ (p-IKKβ), and IRS-1 (Ser307) in skeletal muscle of ACE2−/y mice. b: Proposed model of intramuscular fat metabolism amelioration by the ACE2. The up- or down-regulation of metabolic pathways is indicated by arrows. (↑ for up-regulation and ↓ for down-regulation). The data are presented as the mean ± SD of n = 3 in ACE2−/y mice. *P < 0.05 versus WT by Student’s t test

References

    1. Glimcher LH, Lee AH. From sugar to fat: how the transcription factor XBP1 regulates hepatic lipogenesis. Ann N Y Acad Sci. 2009;1173(Suppl 1):E2–E9. doi: 10.1111/j.1749-6632.2009.04956.x. - DOI - PMC - PubMed
    1. Hotamisligil GS. Endoplasmic reticulum stress and the inflammatory basis of metabolic disease. Cell. 2010;140(6):900–917. doi: 10.1016/j.cell.2010.02.034. - DOI - PMC - PubMed
    1. Eaton S. Control of mitochondrial beta-oxidation flux. Prog Lipid Res. 2002;41(3):197–239. doi: 10.1016/S0163-7827(01)00024-8. - DOI - PubMed
    1. Tocchetti CG, Caceres V, Stanley BA, Xie C, Shi S, Watson WH, O'Rourke B, Spadari-Bratfisch RC, Cortassa S, Akar FG, Paolocci N, Aon MA. GSH or palmitate preserves mitochondrial energetic/redox balance, preventing mechanical dysfunction in metabolically challenged myocytes/hearts from type 2 diabetic mice. Diabetes. 2012;61(12):3094–3105. doi: 10.2337/db12-0072. - DOI - PMC - PubMed
    1. Lopaschuk GD, Ussher JR, Folmes CD, Jaswal JS, Stanley WC. Myocardial fatty acid metabolism in health and disease. Physiol Rev. 2010;90(1):207–258. doi: 10.1152/physrev.00015.2009. - DOI - PubMed

MeSH terms

Substances

LinkOut - more resources