. 2019 Nov 27:367:l6258.
doi: 10.1136/bmj.l6258.

Short term exposure to fine particulate matter and hospital admission risks and costs in the Medicare population: time stratified, case crossover study

Affiliations

Short term exposure to fine particulate matter and hospital admission risks and costs in the Medicare population: time stratified, case crossover study

Yaguang Wei et al. BMJ. .

Abstract

Objective: To assess risks and costs of hospital admission associated with short term exposure to fine particulate matter with diameter less than 2.5 µm (PM2.5) for 214 mutually exclusive disease groups.

Design: Time stratified, case crossover analyses with conditional logistic regressions adjusted for non-linear confounding effects of meteorological variables.

Setting: Medicare inpatient hospital claims in the United States, 2000-12 (n=95 277 169).

Participants: All Medicare fee-for-service beneficiaries aged 65 or older admitted to hospital.

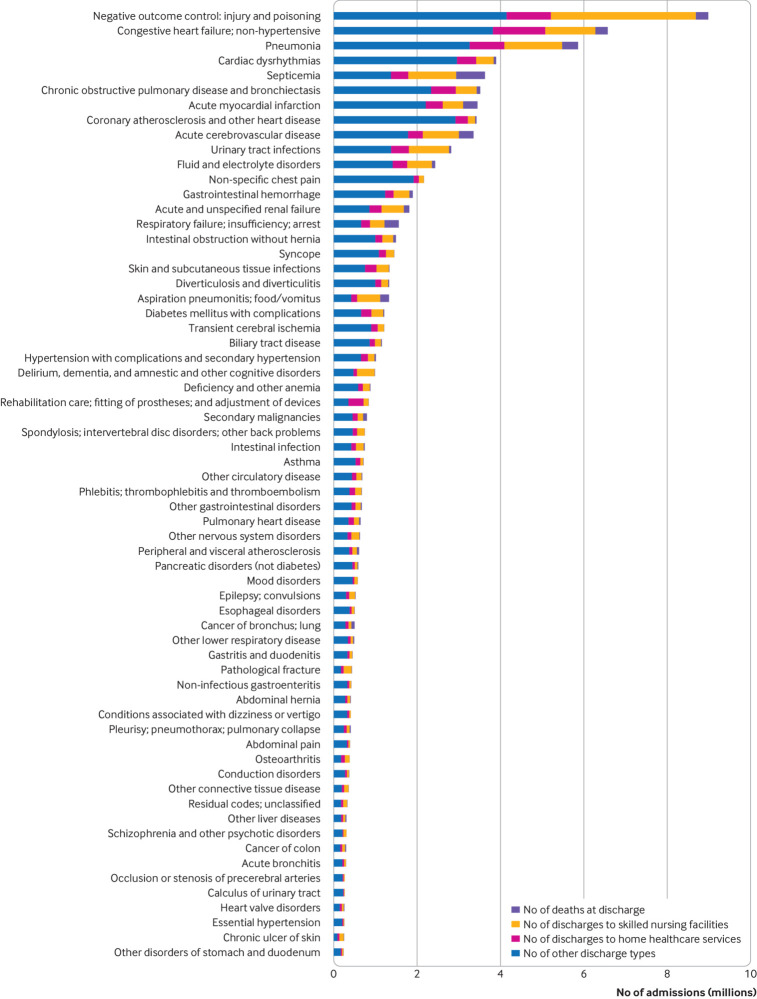
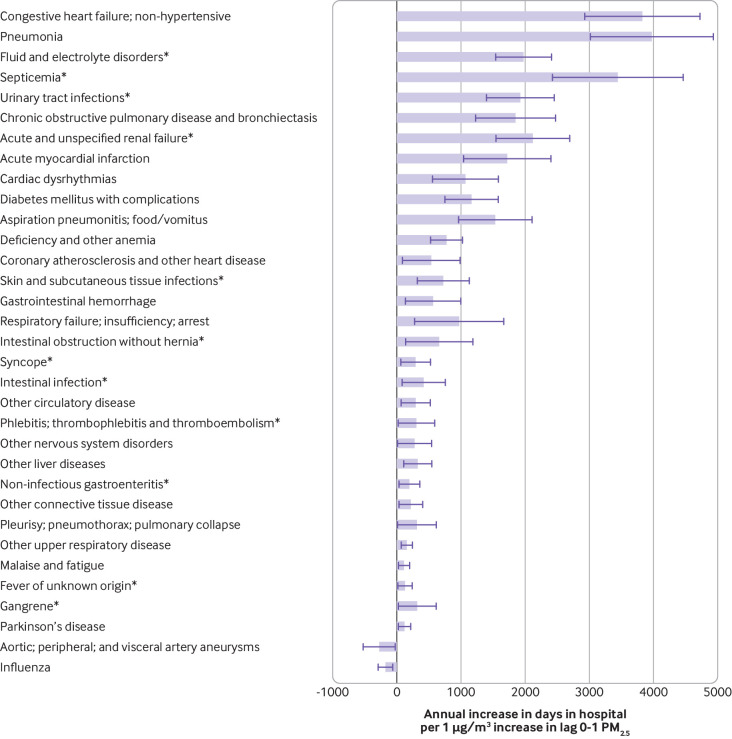
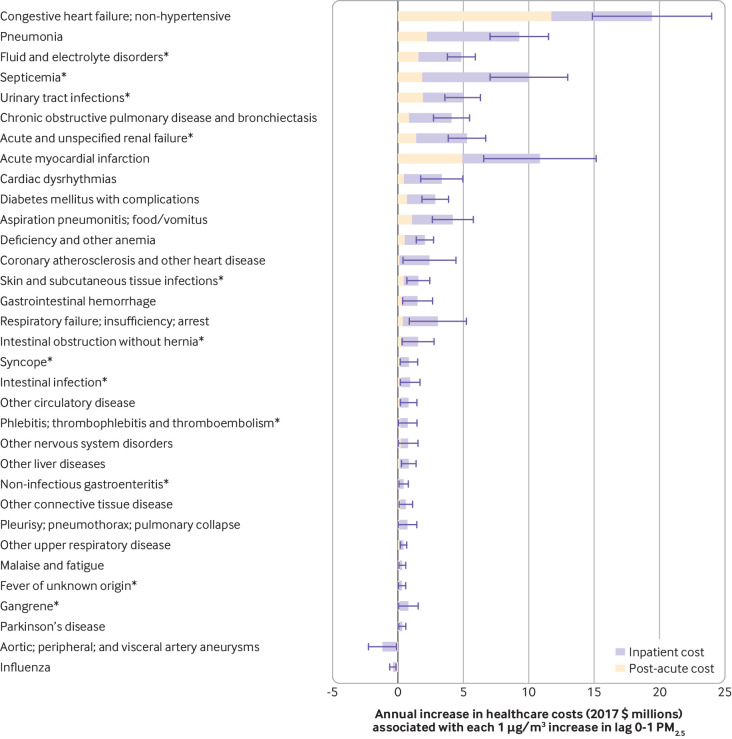
Main outcome measures: Risk of hospital admission, number of admissions, days in hospital, inpatient and post-acute care costs, and value of statistical life (that is, the economic value used to measure the cost of avoiding a death) due to the lives lost at discharge for 214 disease groups.

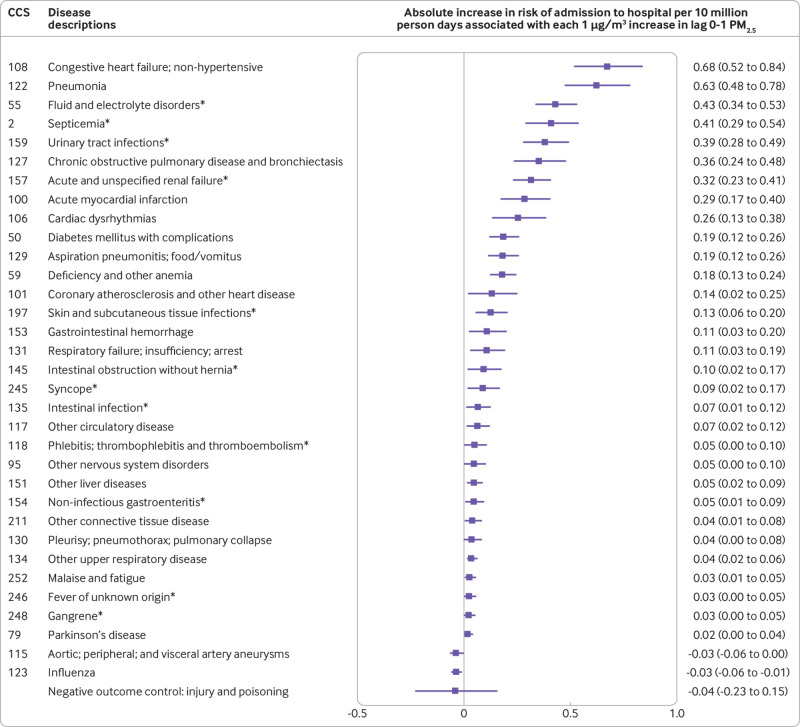
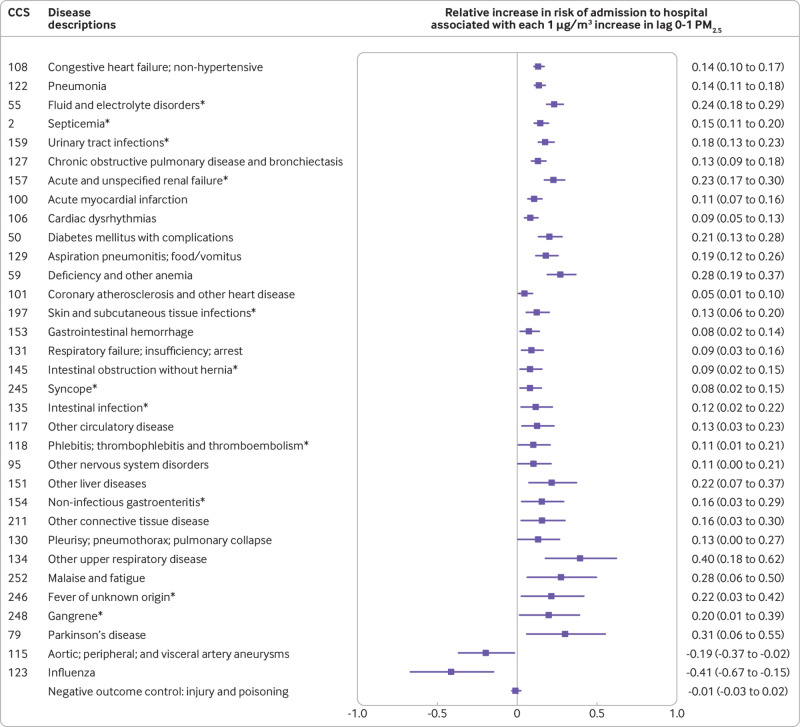
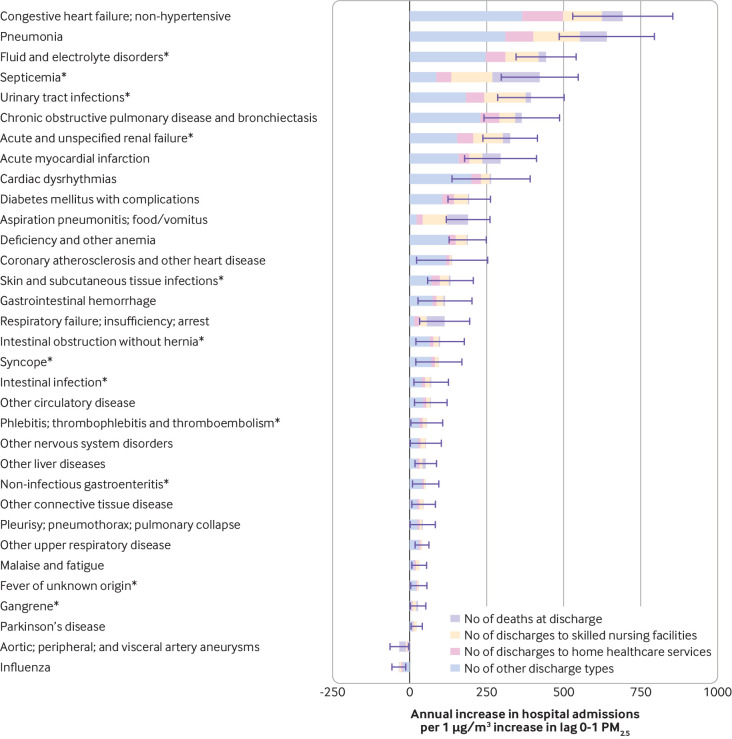
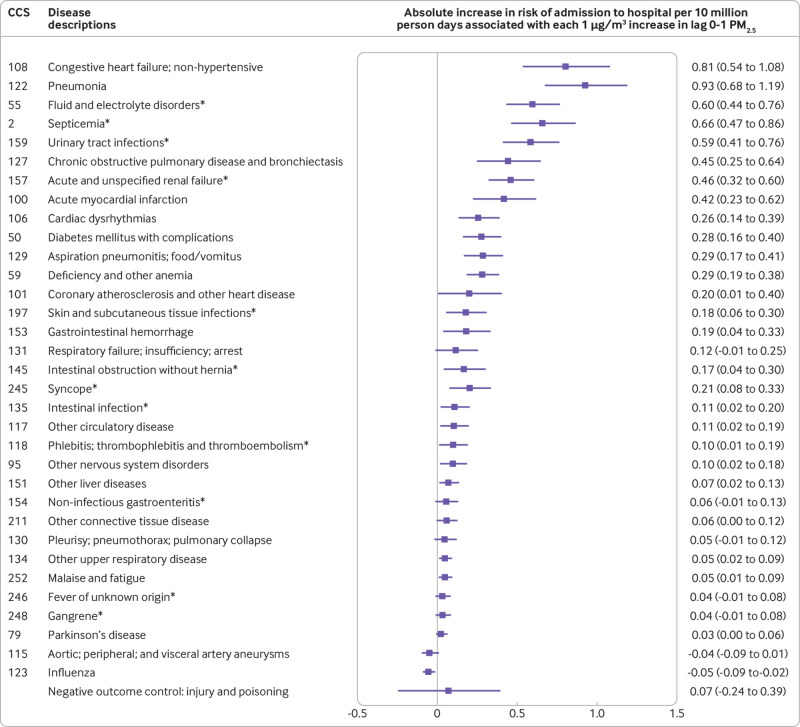
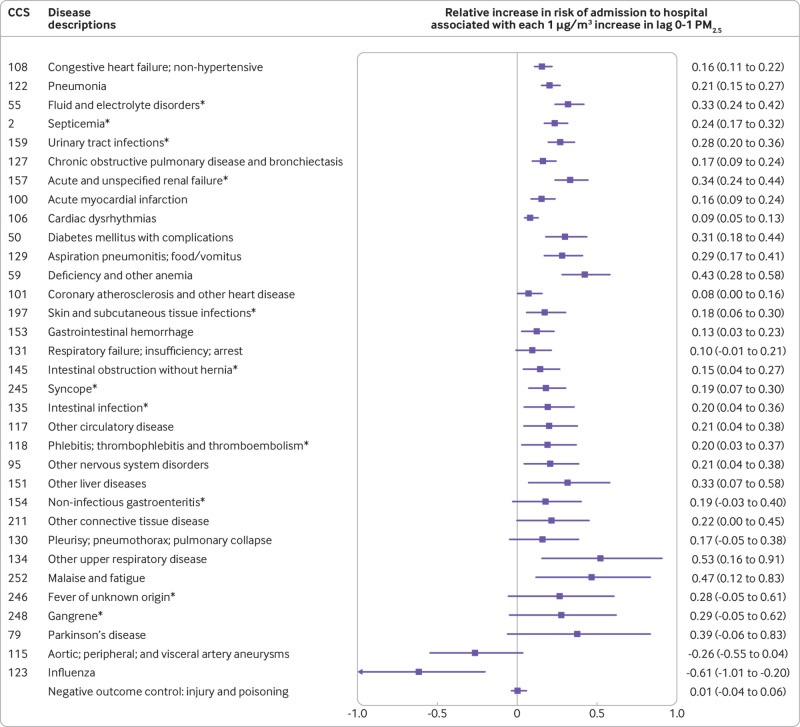
Results: Positive associations between short term exposure to PM2.5 and risk of hospital admission were found for several prevalent but rarely studied diseases, such as septicemia, fluid and electrolyte disorders, and acute and unspecified renal failure. Positive associations were also found between risk of hospital admission and cardiovascular and respiratory diseases, Parkinson's disease, diabetes, phlebitis, thrombophlebitis, and thromboembolism, confirming previously published results. These associations remained consistent when restricted to days with a daily PM2.5 concentration below the WHO air quality guideline for the 24 hour average exposure to PM2.5. For the rarely studied diseases, each 1 µg/m3 increase in short term PM2.5 was associated with an annual increase of 2050 hospital admissions (95% confidence interval 1914 to 2187 admissions), 12 216 days in hospital (11 358 to 13 075), US$31m (£24m, €28m; $29m to $34m) in inpatient and post-acute care costs, and $2.5bn ($2.0bn to $2.9bn) in value of statistical life. For diseases with a previously known association, each 1 µg/m3 increase in short term exposure to PM2.5 was associated with an annual increase of 3642 hospital admissions (3434 to 3851), 20 098 days in hospital (18 950 to 21 247), $69m ($65m to $73m) in inpatient and post-acute care costs, and $4.1bn ($3.5bn to $4.7bn) in value of statistical life.

Conclusions: New causes and previously identified causes of hospital admission associated with short term exposure to PM2.5 were found. These associations remained even at a daily PM2.5 concentration below the WHO 24 hour guideline. Substantial economic costs were linked to a small increase in short term PM2.5.


Conflict of interest statement

Competing interests: All authors have completed the ICMJE uniform disclosure form at www.icmje.org/coi_disclosure.pdf and declare: support from the NIH, NIH/NCI, HEI, and US EPA for the submitted work; no financial relationships with any organizations that might have an interest in the submitted work in the previous three years; no other relationships or activities that could appear to have influenced the submitted work.

Figures

Fig 1
Fig 1
Descriptive statistics for the top 30% prevalent disease groups during 2000-12 among Medicare fee-for-service beneficiaries in the United States. Total number of hospital admissions, according to discharge destination (deaths at discharge, discharges to skilled nursing facilities, discharges to home healthcare services, and other discharge destinations). Figure S1 in the supplementary online contents provides descriptive statistics for each of the 214 disease groups
Fig 2
Fig 2
Main analysis showing absolute increases in risk of hospital admission, ordered from highest to lowest, associated with each 1 μg/m3 increase in lag 0-1 PM2.5. The main analysis was conducted in the case crossover study setting with lag 0-1 PM2.5 as the exposure, adjusted for penalized splines of lag 0-1 air and dew point temperatures for each disease group. The Bonferroni correction was used to adjust 95% confidence intervals for disease groups associated with lag 0-1 PM2.5 and negative outcome control (injury and poisoning). CCS=Clinical Classification Software code. *Indicates newly identified disease groups. Figure S2 in the supplementary online contents provides results for each of the 214 disease groups
Fig 3
Fig 3
Main analysis showing relative percentage increases in risk of hospital admission associated with each 1 μg/m3 increase in lag 0-1 PM2.5. Disease groups are ranked from highest to lowest absolute increase in risk of hospital admission. The main analysis was conducted in the case crossover study setting with lag 0-1 PM2.5 as the exposure, adjusted for penalized splines of lag 0-1 air and dew point temperatures for each disease group. The Bonferroni correction was used to adjust 95% confidence intervals for disease groups associated with lag 0-1 PM2.5 and negative outcome control (injury and poisoning). CCS=Clinical Classification Software code. *Indicates newly identified disease groups. Figure S2 in the supplementary online contents provides results for each of the 214 disease groups
Fig 4
Fig 4
Annual increase in hospital admissions associated with each 1 μg/m3 increase in lag 0-1 PM2.5, according to discharge destination (deaths at discharge, discharges to skilled nursing facilities, discharges to home healthcare services, and other discharge destinations). Disease groups are ranked from highest to lowest absolute increase in risk of hospital admission. Error bars show 95% confidence intervals for estimates of hospital admissions. *Indicates newly identified disease groups. Results are from the main analysis using the full dataset
Fig 5
Fig 5
Annual increase in days in hospital associated with each 1 μg/m3 increase in lag 0-1 PM2.5. Disease groups are ranked from highest to lowest absolute increase in risk of hospital admission. Error bars show 95% confidence intervals for estimates of annual increase in days in hospital. *Indicates newly identified disease groups. Results are from the main analysis using the full dataset
Fig 6
Fig 6
Annual increase in healthcare costs (inpatient and post-acute care) associated with each 1 μg/m3 increase in lag 0-1 PM2.5. Disease groups are ranked from highest to lowest absolute increase in risk of hospital admission. Error bars show 95% confidence intervals for estimates of annual increase in healthcare costs. *Indicates newly identified disease groups. Results are from the main analysis using the full dataset
Fig 7
Fig 7
Below-guideline analysis showingabsolute increases in risk of hospital admission associated with each 1 μg/m3 increase in lag 0-1 PM2.5. Disease groups are ranked from highest to lowest absolute increase in risk of hospital admission. The below-guideline analysis used the same model specification as the main analysis and was restricted to days with daily PM2.5 concentrations ≤25 μg/m3 (WHO air quality guideline value for daily PM2.5). The Bonferroni correction was used to adjust 95% confidence intervals for disease groups associated with lag 0-1 PM2.5 and negative outcome control (injury and poisoning). CCS=Clinical Classification Software code. *Indicates newly identified disease groups. Figure S2 in the supplementary online contents provides results for each of the 214 disease groups
Fig 8
Fig 8
Below-guideline analysis showing relative percentage increases in risk of hospital admission associated with each 1 μg/m3 increase in lag 0-1 PM2.5. Disease groups are ranked from highest to lowest absolute increase in risk of hospital admission. The below-guideline analysis used the same model specification as the main analysis and was restricted to days with daily PM2.5 concentrations ≤25 μg/m3 (WHO air quality guideline value for daily PM2.5). The Bonferroni correction was used to adjust 95% confidence intervals for disease groups associated with lag 0-1 PM2.5 and negative outcome control (injury and poisoning). CCS=Clinical Classification Software code. *Indicates newly identified disease groups. Figure S2 in the supplementary online contents provides results for each of the 214 disease groups

Comment in

References

    1. Feng S, Gao D, Liao F, Zhou F, Wang X. The health effects of ambient PM2.5 and potential mechanisms. Ecotoxicol Environ Saf 2016;128:67-74. 10.1016/j.ecoenv.2016.01.030 - DOI - PubMed
    1. Xing YF, Xu YH, Shi MH, Lian YX. The impact of PM2.5 on the human respiratory system. J Thorac Dis 2016;8:E69-74. - PMC - PubMed
    1. Brook RD, Franklin B, Cascio W, et al. Expert Panel on Population and Prevention Science of the American Heart Association Air pollution and cardiovascular disease: a statement for healthcare professionals from the Expert Panel on Population and Prevention Science of the American Heart Association. Circulation 2004;109:2655-71. 10.1161/01.CIR.0000128587.30041.C8 - DOI - PubMed
    1. Air quality guidelines WHO. Geneva: World Health Organization. 2006.
    1. World Health Organization (WHO) WHO expert consultation: available evidence for the future update of the WHO global air quality guidelines (AQGs). WHO, 2016.

Publication types

MeSH terms