. 2020 Feb 14;94(5):e01786-19.
doi: 10.1128/JVI.01786-19. Print 2020 Feb 14.

Genetic Diversity, Compartmentalization, and Age of HIV Proviruses Persisting in CD4+ T Cell Subsets during Long-Term Combination Antiretroviral Therapy

Affiliations

Genetic Diversity, Compartmentalization, and Age of HIV Proviruses Persisting in CD4+ T Cell Subsets during Long-Term Combination Antiretroviral Therapy

Bradley R Jones et al. J Virol. .

Abstract

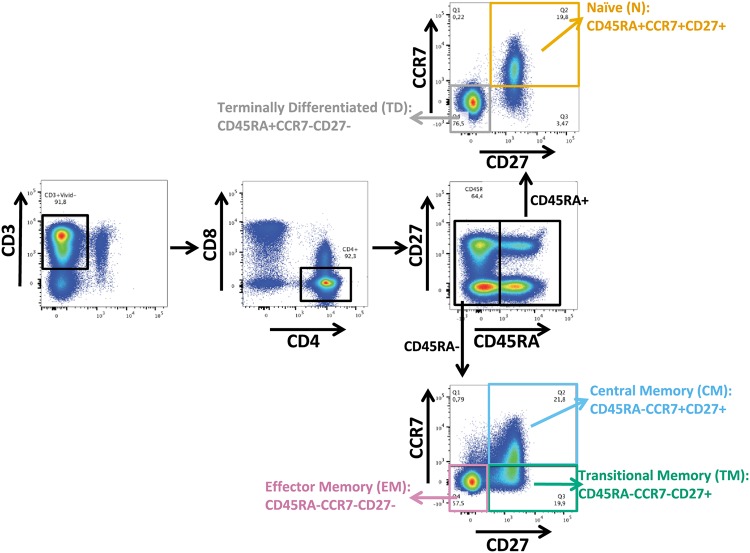
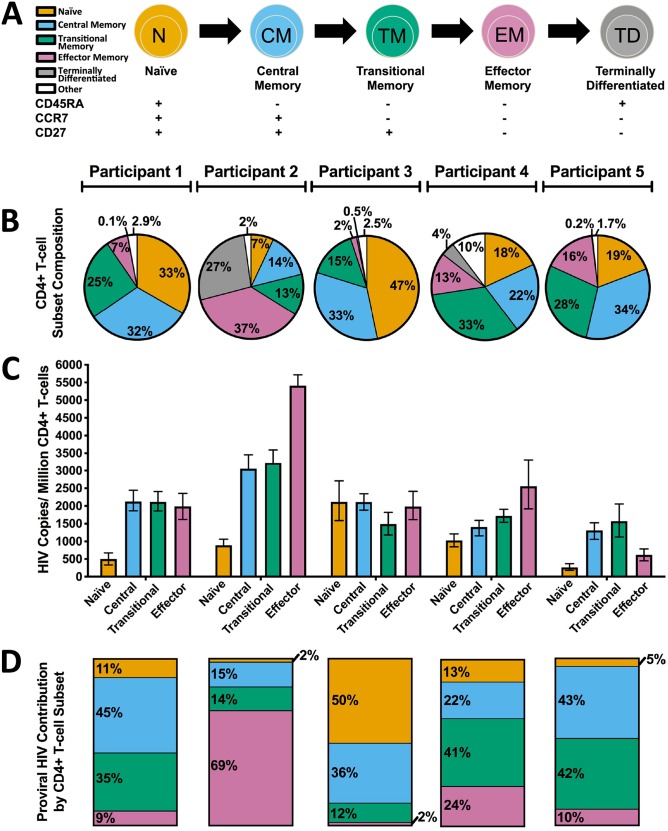
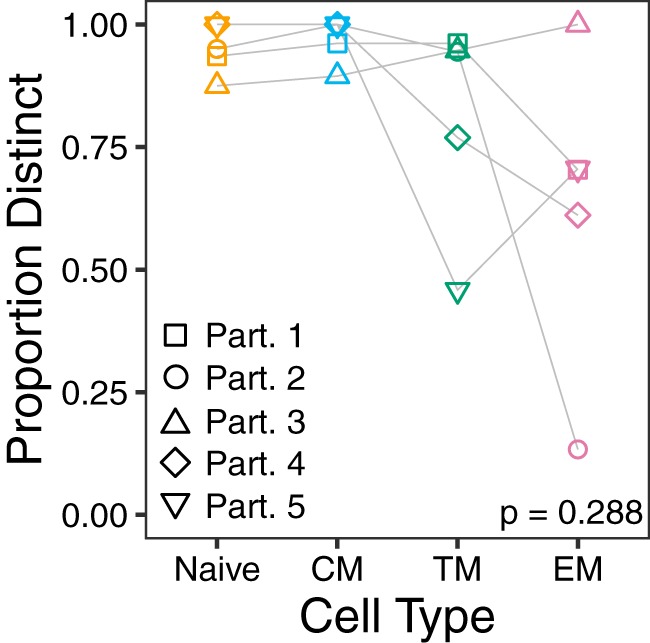
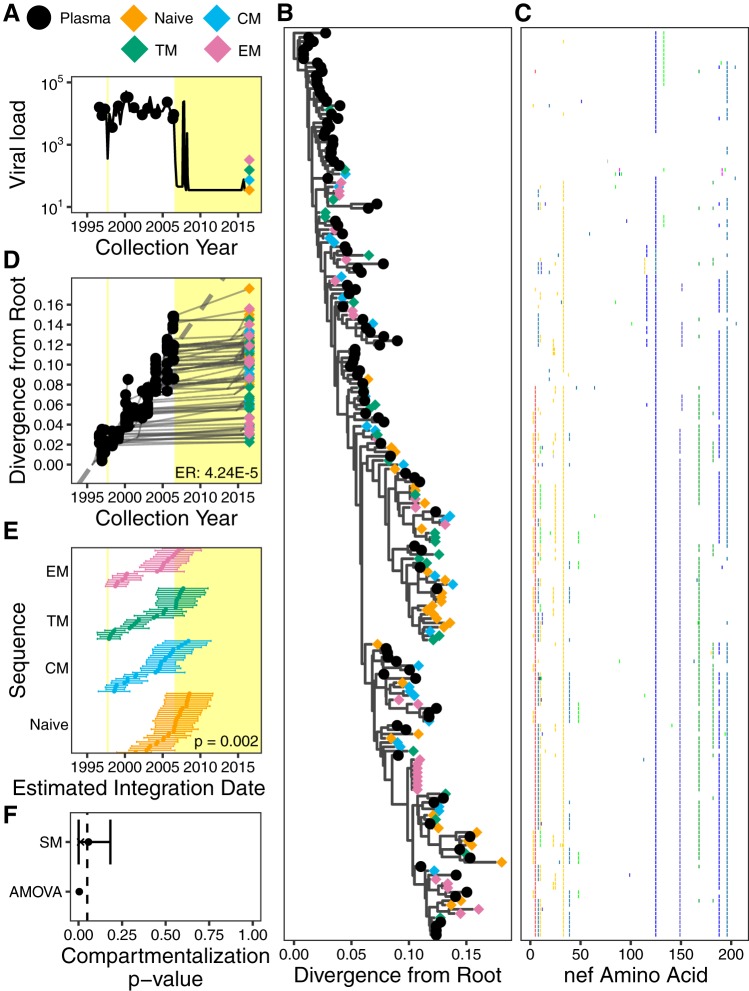
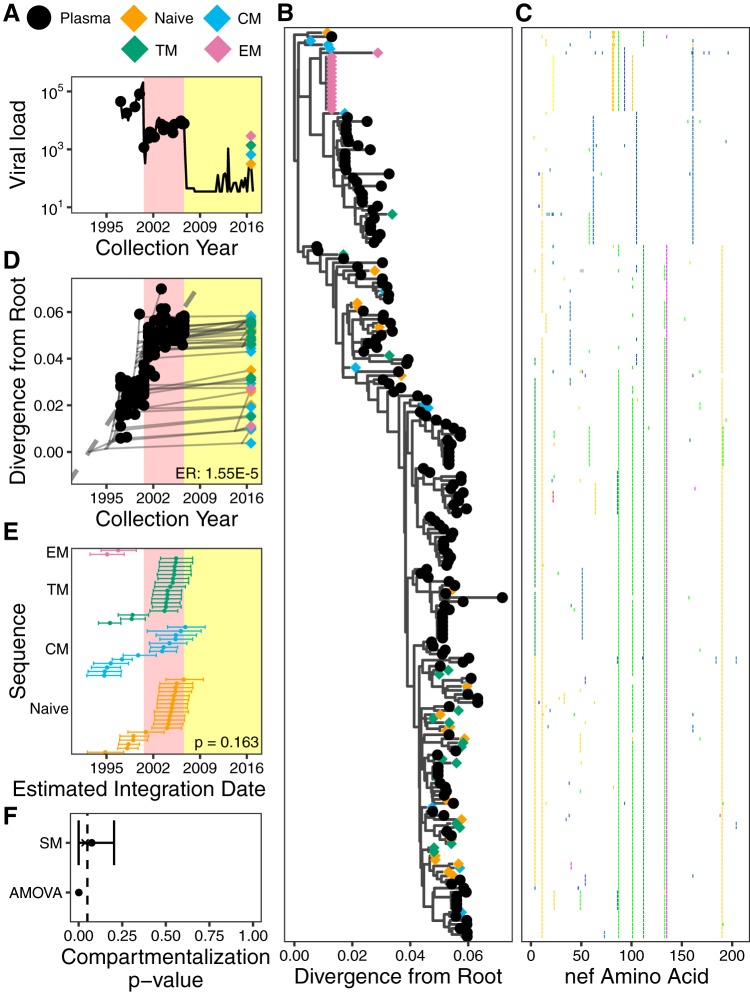
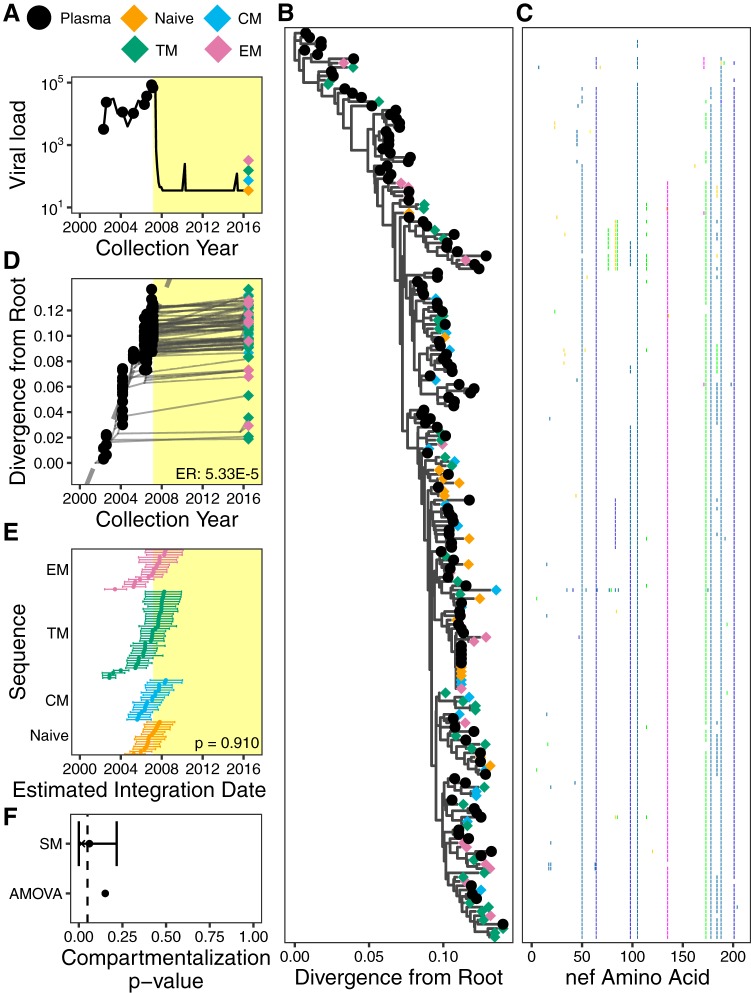
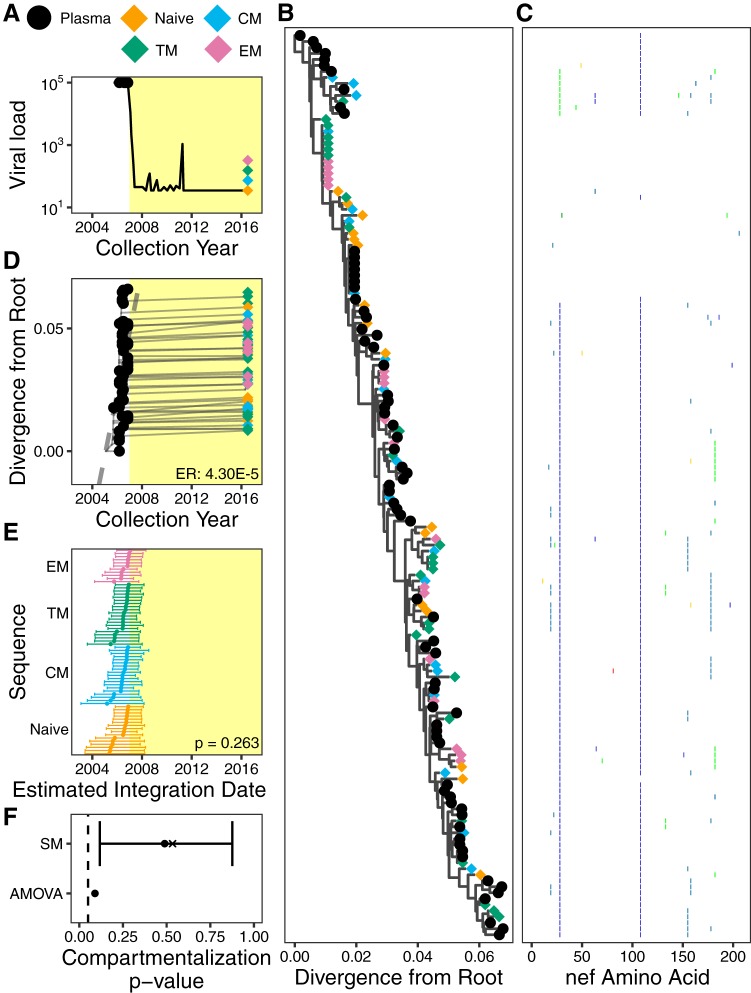
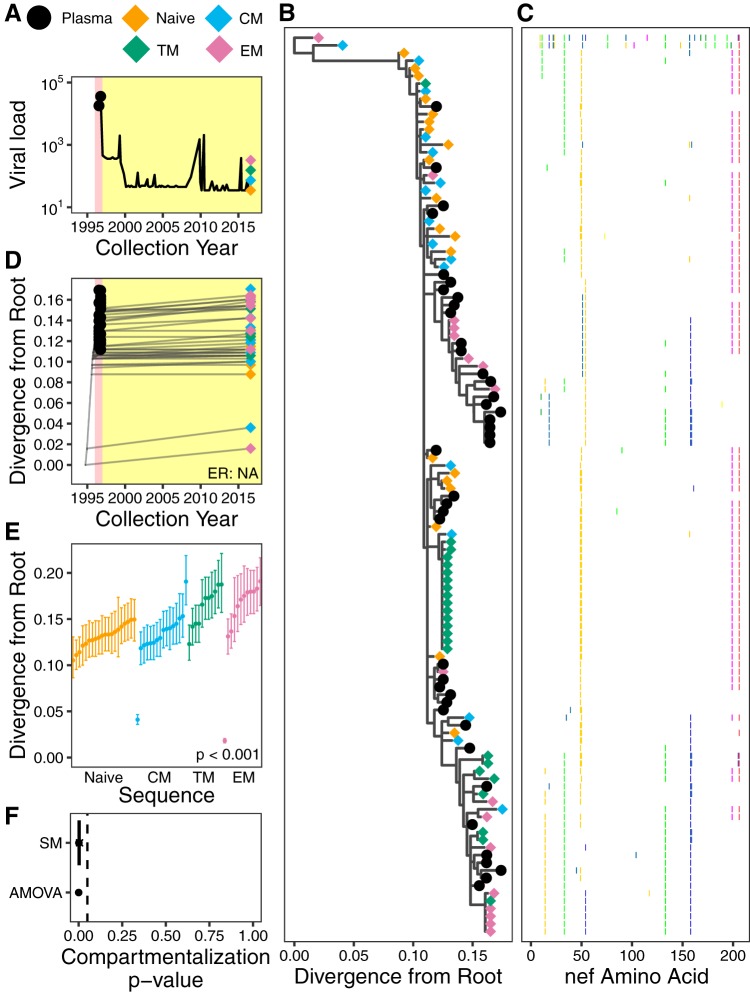
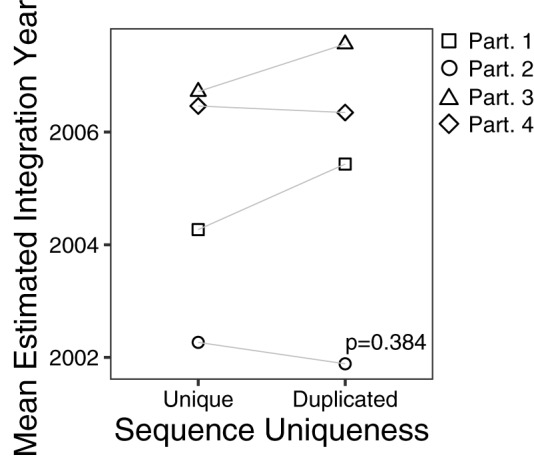
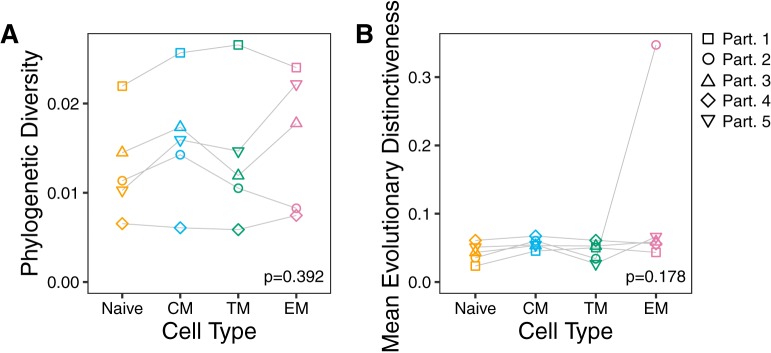
The HIV reservoir, which comprises diverse proviruses integrated into the genomes of infected, primarily CD4+ T cells, is the main barrier to developing an effective HIV cure. Our understanding of the genetics and dynamics of proviruses persisting within distinct CD4+ T cell subsets, however, remains incomplete. Using single-genome amplification, we characterized subgenomic proviral sequences (nef region) from naive, central memory, transitional memory, and effector memory CD4+ T cells from five HIV-infected individuals on long-term combination antiretroviral therapy (cART) and compared these to HIV RNA sequences isolated longitudinally from archived plasma collected prior to cART initiation, yielding HIV data sets spanning a median of 19.5 years (range, 10 to 20 years) per participant. We inferred a distribution of within-host phylogenies for each participant, from which we characterized proviral ages, phylogenetic diversity, and genetic compartmentalization between CD4+ T cell subsets. While three of five participants exhibited some degree of proviral compartmentalization between CD4+ T cell subsets, combined analyses revealed no evidence that any particular CD4+ T cell subset harbored the longest persisting, most genetically diverse, and/or most genetically distinctive HIV reservoir. In one participant, diverse proviruses archived within naive T cells were significantly younger than those in memory subsets, while for three other participants we observed no significant differences in proviral ages between subsets. In one participant, "old" proviruses were recovered from all subsets, and included one sequence, estimated to be 21.5 years old, that dominated (>93%) their effector memory subset. HIV eradication strategies will need to overcome within- and between-host genetic complexity of proviral landscapes, possibly via personalized approaches.IMPORTANCE The main barrier to HIV cure is the ability of a genetically diverse pool of proviruses, integrated into the genomes of infected CD4+ T cells, to persist despite long-term suppressive combination antiretroviral therapy (cART). CD4+ T cells, however, constitute a heterogeneous population due to their maturation across a developmental continuum, and the genetic "landscapes" of latent proviruses archived within them remains incompletely understood. We applied phylogenetic techniques, largely novel to HIV persistence research, to reconstruct within-host HIV evolutionary history and characterize proviral diversity in CD4+ T cell subsets in five individuals on long-term cART. Participants varied widely in terms of proviral burden, genetic diversity, and age distribution between CD4+ T cell subsets, revealing that proviral landscapes can differ between individuals and between infected cell types within an individual. Our findings expose each within-host latent reservoir as unique in its genetic complexity and support personalized strategies for HIV eradication.

Keywords: CD4+ T cells; HIV; cell subsets; cellular subsets; genetic compartmentalization; human immunodeficiency virus; persistence; proviral age; reservoir.


Figures

FIG 1
FIG 1
Gating strategy for sorting of CD4+ T cell subsets. Representative flow cytometry plot illustrating how participant CD4+ T cells were isolated after staining with the indicated antibodies. CD4 T cell subsets were defined as follows: TN, CD45RA+ CCR7+ CD27+; TCM, CD45RA CCR7+ CD27+; TTM, CD45RA CCR7 CD27+; TEM, CD45RA CCR7 CD27.
FIG 2
FIG 2
Frequency and latent HIV reservoir burden in CD4+ T cell subsets. (A) Schematic of CD4+ T cell differentiation, with corresponding cell surface markers below. All subsequent figures use this color scheme to denote specific CD4+ T cell subsets. (B) Frequency of CD4+ T cells within each subset. The other category denotes CD4+ T cells that express other combinations of the markers listed in panel A that are rare and have no reported function (80). (C) Proviral DNA burden, measured as the number of HIV Gag copies/million cells, in each CD4+ T cell subset. Error bars represent 95% Poisson confidence intervals calculated from merged replicate wells. (D) Proportion of the total proviral burden harbored by each CD4+ T cell subset.
FIG 3
FIG 3
Sequence distinctness in CD4+ T cell subsets. Data points denote the frequency of distinct (unique) proviral sequences per subset per participant. Frequencies across subsets were compared using the Friedman rank sum test. CM, central memory; TM, transitional memory; EM, effector memory.
FIG 4
FIG 4
Participant 1. (A) Plasma viral load and sampling history. Yellow shading denotes periods on cART. (B) The phylogeny with the highest likelihood derived from Bayesian inference, rooted using root-to-tip regression. (C) Highlighter plot showing amino acid differences with respect to the consensus of the sequences collected at the earliest plasma HIV RNA sampling time point. (D) Linear model (dashed gray diagonal) relating plasma HIV RNA collection dates to their respective distances from the root of the phylogeny shown in panel B. Thin gray lines show the phylogenetic relationships between the sequences. HIV RNA nef evolutionary rate (ER), expressed in estimated nucleotide substitutions per site per day, is shown in the bottom right corner. (E) The 95% highest posterior density (HPD) intervals of the integration date estimates of the proviral sequences, derived from all phylogenies generated by the Bayesian analysis. The points represent mean values. The distribution of mean values across the CD4+ T cell subsets is compared using a Kruskal-Wallis test (P value at bottom right). (F) P values of proviral genetic compartmentalization across the CD4+ T cell subsets, derived from AMOVA and Slatkin-Maddison (where the latter values are derived from all phylogenies generated by the Bayesian analysis). Here, the circle represents the overall mean P value, the x represents the mean weighted by the likelihood of the phylogeny tested, and the bars represent the 95% HPD interval.
FIG 5
FIG 5
Participant 2. The panels are as described in the legend of Fig. 4. Pink shading in panels A, D, and E denotes a period of nonsuppressive dual therapy.
FIG 6
FIG 6
Participant 3. The panels are as described in the legend of Fig. 4.
FIG 7
FIG 7
Participant 4. The panels are as described in the legend of Fig. 4.
FIG 8
FIG 8
Participant 5. (A) Plasma viral load and sampling history. Yellow shading indicates cART, and pink shading denotes nonsuppressive dual therapy (also in panel D). (B) The phylogeny with the highest likelihood derived from Bayesian inference, rooted using the HXB2 reference strain as an outgroup. (C) Highlighter plot showing amino acid differences with respect to the consensus of the sequences collected at the earliest plasma HIV RNA sampling time point. (D) Linear model (dashed gray diagonal) relating plasma HIV RNA collection dates to their respective distances from the root of the phylogeny shown in panel B. Gray lines show the phylogenetic relationships of the sequences. HIV RNA nef evolutionary rate (ER) could not be determined for this participant due to insufficient molecular clock signal. (E) The 95% highest posterior density (HPD) intervals of root-to-tip patristic distances, expressed as the number of estimated nucleotide substitutions/site, derived from all phylogenies generated by the Bayesian analysis. The points represent mean values. The distribution of mean values across the CD4+ T cell subsets is compared using the Kruskal-Wallis test (P value at bottom right). (F) P values of proviral genetic compartmentalization across the CD4+ T cell subsets, as described in the legend of Fig. 4F.
FIG 9
FIG 9
Mean estimated proviral integration year of unique versus duplicated sequences. Data points correspond to the mean proviral integration year of distinct sequences, stratified by whether they are unique (i.e., observed only once) or duplicated (i.e., observed more than once). The P value was calculated using a paired t test between the mean proviral integration year of unique versus duplicated sequences.
FIG 10
FIG 10
Cross-participant analysis of proviral diversity and distinctiveness within CD4+ T cell subsets. (A) Normalized phylogenetic diversity in the number of nucleotide substitutions per site per tip of distinct sequences in each participant, stratified by specific CD4+ T cell subset. (B) Mean evolutionary distinctiveness of distinct sequences in each participant, stratified by specific CD4+ T cell subset. Evolutionary distinctiveness is a unitless measurement. P values were calculated using a Friedman rank sum test.

Similar articles

Cited by

References

    1. Hogg RS, Heath KV, Yip B, Craib KJ, O'Shaughnessy MV, Schechter MT, Montaner JS. 1998. Improved survival among HIV-infected individuals following initiation of antiretroviral therapy. JAMA 279:450–454. doi:10.1001/jama.279.6.450. - DOI - PubMed
    1. Palella FJ Jr, Delaney KM, Moorman AC, Loveless MO, Fuhrer J, Satten GA, Aschman DJ, Holmberg SD. 1998. Declining morbidity and mortality among patients with advanced human immunodeficiency virus infection. HIV Outpatient Study Investigators. N Engl J Med 338:853–860. doi:10.1056/NEJM199803263381301. - DOI - PubMed
    1. Finzi D, Blankson J, Siliciano JD, Margolick JB, Chadwick K, Pierson T, Smith K, Lisziewicz J, Lori F, Flexner C, Quinn TC, Chaisson RE, Rosenberg E, Walker B, Gange S, Gallant J, Siliciano RF. 1999. Latent infection of CD4+ T cells provides a mechanism for lifelong persistence of HIV-1, even in patients on effective combination therapy. Nat Med 5:512–517. doi:10.1038/8394. - DOI - PubMed
    1. Chun TW, Stuyver L, Mizell SB, Ehler LA, Mican JA, Baseler M, Lloyd AL, Nowak MA, Fauci AS. 1997. Presence of an inducible HIV-1 latent reservoir during highly active antiretroviral therapy. Proc Natl Acad Sci U S A 94:13193–13197. doi:10.1073/pnas.94.24.13193. - DOI - PMC - PubMed
    1. Finzi D, Hermankova M, Pierson T, Carruth LM, Buck C, Chaisson RE, Quinn TC, Chadwick K, Margolick J, Brookmeyer R, Gallant J, Markowitz M, Ho DD, Richman DD, Siliciano RF. 1997. Identification of a reservoir for HIV-1 in patients on highly active antiretroviral therapy. Science 278:1295–1300. doi:10.1126/science.278.5341.1295. - DOI - PubMed

Publication types