. 2020 Jan 31;94(4):e01410-19.
doi: 10.1128/JVI.01410-19. Print 2020 Jan 31.

Viral Determinants in H5N1 Influenza A Virus Enable Productive Infection of HeLa Cells

Affiliations

Viral Determinants in H5N1 Influenza A Virus Enable Productive Infection of HeLa Cells

Ariel Rodriguez-Frandsen et al. J Virol. .

Abstract

Influenza A virus (IAV) is a human respiratory pathogen that causes yearly global epidemics, as well as sporadic pandemics due to human adaptation of pathogenic strains. Efficient replication of IAV in different species is, in part, dictated by its ability to exploit the genetic environment of the host cell. To investigate IAV tropism in human cells, we evaluated the replication of IAV strains in a diverse subset of epithelial cell lines. HeLa cells were refractory to the growth of human H1N1 and H3N2 viruses and low-pathogenic avian influenza (LPAI) viruses. Interestingly, a human isolate of the highly pathogenic avian influenza (HPAI) H5N1 virus successfully propagated in HeLa cells to levels comparable to those in a human lung cell line. Heterokaryon cells generated by fusion of HeLa and permissive cells supported H1N1 virus growth, suggesting the absence of a host factor(s) required for the replication of H1N1, but not H5N1, viruses in HeLa cells. The absence of this factor(s) was mapped to reduced nuclear import, replication, and translation, as well as deficient viral budding. Using reassortant H1N1:H5N1 viruses, we found that the combined introduction of nucleoprotein (NP) and hemagglutinin (HA) from an H5N1 virus was necessary and sufficient to enable H1N1 virus growth. Overall, this study suggests that the absence of one or more cellular factors in HeLa cells results in abortive replication of H1N1, H3N2, and LPAI viruses, which can be circumvented upon the introduction of H5N1 virus NP and HA. Further understanding of the molecular basis of this restriction will provide important insights into the virus-host interactions that underlie IAV pathogenesis and tropism.IMPORTANCE Many zoonotic avian influenza A viruses have successfully crossed the species barrier and caused mild to life-threatening disease in humans. While human-to-human transmission is limited, there is a risk that these zoonotic viruses may acquire adaptive mutations enabling them to propagate efficiently and cause devastating human pandemics. Therefore, it is important to identify viral determinants that provide these viruses with a replicative advantage in human cells. Here, we tested the growth of influenza A virus in a subset of human cell lines and found that abortive replication of H1N1 viruses in HeLa cells can be circumvented upon the introduction of H5N1 virus HA and NP. Overall, this work leverages the genetic diversity of multiple human cell lines to highlight viral determinants that could contribute to H5N1 virus pathogenesis and tropism.

Keywords: H5N1; HeLa; heterokaryon; highly pathogenic; influenza A virus.


Figures

FIG 1
FIG 1
HeLa cells do not support H1N1 or H3N2 IAV growth. (A) Nine epithelial cell lines (A549, HCT15, SK-N-SH, U2OS, HOS-CD4, HEK293T, U87-CD4-CXCR4, Huh-7, and HeLa cells) were infected with IAV A/WSN/33 at an MOI of 0.01. At the indicated hours postinfection, cell culture supernatants were collected, and the amount of infectious virus released was measured by a plaque assay. Plotted is the fold change in titer from 24 hpi for each cell line. Data are averages from two independent biological experiments. The limit of detection (LOD) for the plaque assay is indicated by a dotted black line at 1 × 102 PFU/ml. (B through D) Infectious virus titers in supernatants from A549 (solid black lines) or HeLa (solid red lines) cells infected with A/WSN/33 (B) or the indicated H1N1 (C) or H3N2 (D) IAV strains at an MOI of 0.01. Data are averages from three independent biological experiments and represent mean ± standard deviation. Asterisks indicate significant differences by multiple Student t tests (*, P ≤ 0.05; **, P ≤ 0.001; ***, P ≤ 0.0001).
FIG 2
FIG 2
HeLa cells support the replication of a highly pathogenic avian IAV (H5N1) strain. A549 (solid black lines) or HeLa (solid red lines) cells were infected with the indicated LPAI strains (A) or H5N1-HaLo (B) at an MOI of 0.01, and infectious virus titers in the cell culture supernatants were measured at 24, 48, and 72 hpi via a focus-forming assay (with results expressed in focus-forming units [FFU] per milliliter) (A) or a plaque assay (with results expressed in PFU per milliliter) (B). Data are averages from three independent biological experiments and represent mean ± standard deviation. The limits of detection (LOD) for the focus-forming assay and plaque assay are indicated by dotted black lines at 1 × 102 PFU/ml. Asterisks indicate significant differences by multiple Student t tests (*, P ≤ 0.05; **, P ≤ 0.001; ***, P ≤ 0.0001).
FIG 3
FIG 3
Abortive replication of several IAVs in HeLa cells is not due to the expression of human papillomavirus proteins. (A and B) HeLa cells were either mock infected or infected with A/WSN/33 or H5N1-HaLo at an MOI of 3. At 9 hpi, cell extracts were collected, and total RNA was isolated for RNA sequencing. The expression of each of the HPV18 genes is shown as the fragments per kilobase of transcript per million mapped reads (FPKM) (A) or as fold gene expression relative to that in mock-infected samples (B). (C) HeLa cells transfected with siRNAs targeting the indicated HPV18 genes or a negative-control siRNA (Scrambled). Knockdown efficiency at 48 h was determined by qRT-PCR. Values were normalized to that for TBP and were then graphed as the fold change relative to expression with the scrambled siRNA. (D) HeLa cells were transfected with the indicated siRNAs for 48 h and were then infected with A/WSN/33 at an MOI of 0.01. At the indicated times, the virus titer was determined by a plaque assay. (E) qRT-PCR validation of HPV gene overexpression in 293T cells. Values were normalized to that for TBP and were then graphed as the fold change relative to expression in mock-infected cells. (F and G) Cells overexpressing control genes, individual HPV18 genes (F), or a combination of HPV18 genes (G) were infected with A/WSN/33 at an MOI of 0.01, and at the indicated times, the virus titer was determined by a plaque assay. Data are mean ± standard deviation from at least two independent experiments. The limit of detection (LOD) for the plaque assay is indicated by a dotted black line at 1 × 102 PFU/ml.
FIG 4
FIG 4
HeLa cells support productive infection by other RNA and DNA viruses. A549, Huh-7, or HeLa cells were infected with a murine gammaherpesvirus 68 (MHV-68) luciferase reporter virus (MOI, 0.1) (A), lymphocytic choriomeningitis virus (LCMV) (MOI, 0.01) (B), or dengue virus 16681 (DENV-2) (MOI, 10) (C). At the indicated times postinfection, luciferase activity was measured in cell lysates to assess MHV replication (A) or infectious virus titers were measured by a focus forming assay (B) or a plaque assay (C). Data are mean ± standard deviation from at least two independent biological experiments. The limits of detection (LOD) for the focus-forming and plaque assay are indicated by dotted black lines at 1 × 102 PFU/ml. Asterisks indicate significant differences by multiple Student t tests (*, P ≤ 0.05; **, P ≤ 0.001; ***, P ≤ 0.0001).
FIG 5
FIG 5
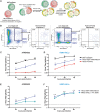
Growth of H1N1 virus in HeLa cells is supported upon fusion with permissive 293T cells. (A) Schematic for the production and isolation of HeLa-293T heterokaryons using HeLa-mCherry or 293T-zsGreen cells. Cells were transiently transfected with VSV-G and then exposed to a low pH in order to induce the fusogenic properties of VSV-G. Fused cells were FACS sorted for zsGreen-mCherry double-positive cells. (B) zsGreenhi mCherryhi and zsGreenlow mCherryhi cell populations (presort; boxed area) were collected, and the purity of the sorted population was assessed (postsort purity) prior to downstream experiments. Pre- and postsort cell populations are shown for two independent experiments. Stringent gating criteria were used to exclude the collection of zsGreen single-positive cells. (C) HeLa-mCherry (solid red lines), 293T-zsGreen (solid black lines), or sorted HeLa-293T heterokaryons (dashed blue lines) were infected at an MOI of 0.01 with A/WSN/33 (C) or H5N1-HaLo (D). At the indicated times, cell culture supernatants were collected, and virus titers were determined by plaque assay. (E) Due to technical limitations, the cells collected included a small percentage (≤4% of live, single cells) of zsGreen single-positive cells (293T-zsGreen). A mixed population of 96% HeLa-mCherry cells and 4% 293T-zsGreen cells (solid cyan lines) was created and infected alongside sorted heterokaryons (HeLa-293T heterokaryons) (dashed blue lines) at an MOI of 0.01 with A/WSN/33 (E) or H5N1-HaLo (F). At the indicated times, virus titers were determined by plaque assay. Data points are mean ± standard deviation from two independent biological experiments. The limit of detection (LOD) for the plaque assay is indicated by a dotted black line at 1 × 102 PFU/ml. Asterisks indicate significant differences (*, P ≤ 0.05; **, P ≤ 0.001; ***, P ≤ 0.0001) for comparison to HeLa-mCherry by two-way analysis of variance (C and D) or multiple Student t tests (E and F).
FIG 6
FIG 6
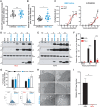
HeLa cells show reduced nuclear import, replication, and translation, as well as deficient budding of H1N1 IAV. (A and B) HeLa cells were synchronously infected with either A/WSN/33 or H5N1-HaLo at an MOI of 10, treated with CHX (100 mg/ml), and then incubated for 3 h at 37°C to allow entry (A) or for 4.5 h at 37°C to allow nuclear import (B). Cells were fixed and stained for IAV NP, and immunofluorescence images were acquired using the IC200 imaging system and were analyzed for cytoplasmic (A) or nuclear (B) NP staining. At least three wells per condition were used, and four fields per well were analyzed for quantification. Circles and squares indicate individual wells assayed, and crossbars indicate mean ± standard deviation from two independent experiments. Rel., relative; n.s., not significant. (C) An IAV infection-driven minigenome luciferase assay was used to measure polymerase activity in order to monitor infection with either H5N1-HaLo (left) or A/WSN/33 (right) at the indicated time points postinfection in HeLa (solid red lines) or 293T (solid black lines) cells. The firefly luciferase signal was normalized to the expression of Renilla luciferase, used as a transfection control. Data are mean ± standard error of the mean from three independent biological experiments. (D and E) Representative Western blots of protein lysates from HeLa cells (D) or A549 cells (E) infected with A/WSN/33 or H5N1-HaLo at an MOI of 3, collected at 3, 6, 9, and 12 hpi and probed for expression of IAV PA, NP, and M2 proteins and the loading control β-actin. Three independent biological experiments were performed. The number sign (#) indicates a nonspecific band seen under all conditions. (F) HA cell surface staining in nonpermeabilized HeLa (red bars) or A549 (black bars) cells following infection with A/WSN/33 at an MOI of 0.5. The percentage of HA-positive (HA+) cells, determined by gating of live, single cells and analysis via flow cytometry, is shown. Data are mean ± standard deviation for three independent experiments. (G) 293T or HeLa cells were transfected with plasmids expressing either A/WSN/33 (H1N1) HA or A/Vietnam/1203/04 (H5N1) HA. Cell surface staining of HA was assessed at 48 h posttransfection by flow cytometry. The percentages of HA+ cells are graphed, and histograms of HA+ populations following the gating of live, single cells are shown. A plasmid expressing eGFP was transfected alongside the virus-expressing plasmids as a positive control, and mock-transfected cells served as negative controls. Data are mean ± standard deviation from three independent experiments. (H) HeLa cells were either mock infected or infected at an MOI of 1 with A/WSN/33 or H5N1-HaLo. At 10 hpi, cells were fixed, negatively stained with uranyl acetate, and visualized by transmission electron microscopy. Arrows indicate newly released influenza virions. (I) A549 or HeLa cells were infected with A/WSN/33 at an MOI of 0.01, and supernatant samples were collected at 72 hpi for extraction of total viral RNA. Genomic copies of NP were quantified by qRT-PCR in three independent biological experiments. Asterisks indicate significant differences by multiple Student t tests (*, P ≤ 0.05; **, P ≤ 0.001; ***, P ≤ 0.0001).
FIG 7
FIG 7
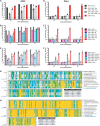
H5N1 NP and HA segments enable H1N1 IAV growth in HeLa cells. Recombinant viruses were created using the A/Puerto Rico/8/1934 (H1N1) [PR8 (H1N1)] backbone and introducing the indicated segment(s) of the H5N1 IAV. (A through F) A549 (left) or HeLa (right) cells were infected with recombinant viruses at an MOI of 0.01 to test the effect of the H5N1 polymerase complex (PB1, PB2, and PA) or the viral ribonucleoprotein (vRNP) complex (PB1, PB2, PA, and NP) (A and D), the effects of individual H5N1 gene segments (B and E), or the combinatorial effect of the H5N1 NP with other H5N1 gene segments (C and F) on virus growth. At the indicated times, infectious virus release was determined by plaque assay. Bars represent mean ± standard deviation from at least three independent biological experiments, while each symbol represents the mean value from an independent experiment. The limit of detection (LOD) for the plaque assay is indicated by a dotted black line at 1 × 102 PFU/ml. Asterisks indicate significant differences (*, P ≤ 0.05; **, P ≤ 0.001; ***, P ≤ 0.0001) by two-way analysis of variance, with Dunnett’s multiple-comparison test for comparisons to PR8. (G and H) Full nucleotide sequence alignments of the HA (G) and NP (H) gene segments from the indicated IAV strains.

References

    1. Palese P, Shaw ML. 2007. Orthomyxoviridae: the viruses and their replication, p 1647–1690. In Knipe DM, Howley PM, Griffin DE, Lamb RA, Martin MA, Roizman B, Straus SE (ed), Fields virology, 5th ed Lippincott Williams & Wilkins, Philadelphia, PA.
    1. Molinari NA, Ortega-Sanchez IR, Messonnier ML, Thompson WW, Wortley PM, Weintraub E, Bridges CB. 2007. The annual impact of seasonal influenza in the US: measuring disease burden and costs. Vaccine 25:5086–5096. doi:10.1016/j.vaccine.2007.03.046. - DOI - PubMed
    1. CDC. 2019. Disease burden of influenza. https://www.cdc.gov/flu/about/burden/index.html.
    1. Klenk HD. 2014. Influenza viruses en route from birds to man. Cell Host Microbe 15:653–654. doi:10.1016/j.chom.2014.05.019. - DOI - PubMed
    1. Lycett SJ, Duchatel F, Digard P. 2019. A brief history of bird flu. Philos Trans R Soc Lond B Biol Sci 374:20180257. doi:10.1098/rstb.2018.0257. - DOI - PMC - PubMed

Publication types

MeSH terms