. 2019 Nov 27;11(520):eaaw3521.
doi: 10.1126/scitranslmed.aaw3521.

Distinct cellular roles for PDCD10 define a gut-brain axis in cerebral cavernous malformation

Affiliations

Distinct cellular roles for PDCD10 define a gut-brain axis in cerebral cavernous malformation

Alan T Tang et al. Sci Transl Med. .

Abstract

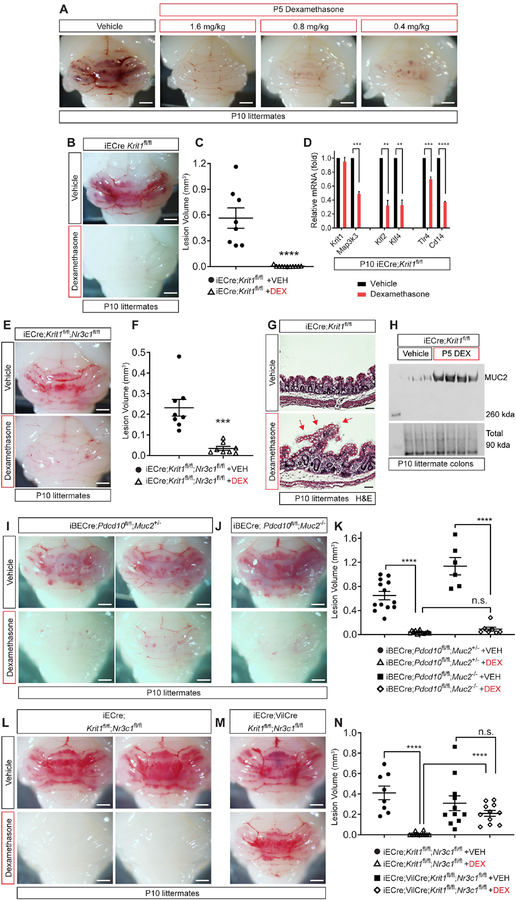
Cerebral cavernous malformation (CCM) is a genetic, cerebrovascular disease. Familial CCM is caused by genetic mutations in KRIT1, CCM2, or PDCD10 Disease onset is earlier and more severe in individuals with PDCD10 mutations. Recent studies have shown that lesions arise from excess mitogen-activated protein kinase kinase kinase 3 (MEKK3) signaling downstream of Toll-like receptor 4 (TLR4) stimulation by lipopolysaccharide derived from the gut microbiome. These findings suggest a gut-brain CCM disease axis but fail to define it or explain the poor prognosis of patients with PDCD10 mutations. Here, we demonstrate that the gut barrier is a primary determinant of CCM disease course, independent of microbiome configuration, that explains the increased severity of CCM disease associated with PDCD10 deficiency. Chemical disruption of the gut barrier with dextran sulfate sodium augments CCM formation in a mouse model, as does genetic loss of Pdcd10, but not Krit1, in gut epithelial cells. Loss of gut epithelial Pdcd10 results in disruption of the colonic mucosal barrier. Accordingly, loss of Mucin-2 or exposure to dietary emulsifiers that reduce the mucus barrier increases CCM burden analogous to loss of Pdcd10 in the gut epithelium. Last, we show that treatment with dexamethasone potently inhibits CCM formation in mice because of the combined effect of action at both brain endothelial cells and gut epithelial cells. These studies define a gut-brain disease axis in an experimental model of CCM in which a single gene is required for two critical components: gut epithelial function and brain endothelial signaling.


Conflict of interest statement

Competing interests: The authors declare no competing financial interests. IA is Chairman of the Scientific Advisory Board for Angioma Alliance and provides expert opinions related to clinical care of cerebral cavernous malformations.

Figures

Figure 1.
Figure 1.. Comparison of PDCD10, KRIT1 and CCM2 deficiency states in mice and humans.
A, CCM lesion burden in iBECre;Pdcd10fl/fl and iBECre;Pdcd10fl/fl Map3k3fl/+ mice at P10, assessed visually (left) and using microCT imaging (right). Scale bars 1 mm. B, Blinded microCT quantitation of CCM lesion burden in P10 iBECre;Pdcd10fl/fl and iBECre;Pdcd10fl/fl;Map3k3fl/+ littermates. n>10 animals per genotype and 4 distinct litters. C, Principle Coordinates Analysis (PCoA) of weighted UniFrac bacterial composition distances between the feces of individuals with familial CCM disease associated with mutations in KRIT1, CCM2 and PDCD10, individuals with sporadic CCM disease, and age/sex-matched healthy controls. P-value compares bacterial compositions between healthy and CCM disease groups using PERMANOVA. D, Relative abundance boxplots of gram-negative Bacteroides in individuals with CCM disease and healthy controls. Significance (false discovery rate, q) determined by linear models of logit transformed relative abundances with Benjamini-Hochberg correction for multiple comparisons. E, PCoA of weighted UniFrac bacterial composition distances between the feces of only individuals with genotyped mutations in KRIT1, CCM2 and PDCD10. P-values compare bacterial compositions in all groups using PERMANOVA. F, Relative abundance box plots of gram-negative Bacteroides comparing genotyped familial KRIT1, CCM2, or PDCD10 patients with sporadic cases or healthy volunteers. Significance was determined by pairwise-testing of estimated marginal means from a linear model comparing the genetic categories of CCM disease, controlling for age and sex. All associated p-values > 0.5 and not significant (n.s.). Error bars shown as s.e.m. and significance (panel B) determined by unpaired, two-tailed Student’s t-test. ***indicates p<0.001; n.s. indicates p>0.05.
Figure 2.
Figure 2.. Effect of dextran sodium sulfate-induced colitis on CCM formation.
A, Schematic of the experimental design in which littermates receive an injection of tamoxifen one day after birth (P1), daily gavage of dextran sodium sulfate (DSS) or vehicle from P10–15, and tissue harvest at P21. B, DSS-treated iECre;Krit1fl/fl mice exhibit colitis of varying severity associated with thinned mucus layer (red bracket), crypt dilation and abscesses (red arrows) and an inflamed (middle) or entirely eroded (right) epithelium. Scale bars 100 μm. Results representative of n>3 animals per treatment group. C, CCM lesion burden in susceptible iECre;Krit1fl/fl mice was measured following DSS or vehicle exposure assessed visually (left panels) and using microCT imaging (right panels). Scale bars 1 mm. D, Blinded microCT quantitation of CCM lesion burden in P21 iECre;Krit1fl/fl littermates following gavage with vehicle or DSS. n>18 per treatment group and 8 distinct litters.. E, CCMs form in resistant iECre;Ccm2fl/fl mice following DSS exposure. CCMs were assessed visually (left panels) and using microCT imaging (right panels). Scale bars 1 mm. F, Blinded microCT quantitation of CCM lesion burden in resistant P21 iECre;Ccm2fl/fl littermates following gavage with vehicle or DSS. n≥8 per treatment group and 4 distinct litters. Error bars shown as s.e.m. and significance determined by unpaired, two-tailed Welch’s t-test (panel D) or unpaired, two-tailed Student’s t-test (panel F). **indicates p<0.01
Figure 3.
Figure 3.. Effect of brain endothelial and gut epithelial loss of PDCD10 or KRIT1 on CCM formation.
A, CCM formation in iBECre;Pdcd10fl/fl and iBECre;VilCre;Pdcd10fl/fl littermates assessed visually (left and middle panels) and using microCT imaging (right panels). Scale bars 1 mm. B, Blinded microCT quantitation of CCM lesion burden in P21 iBECre;Pdcd10fl/fl and iBECre;VilCre;Pdcd10fl/fl littermates. n≥19 animals per genotype and 10 distinct litters. C, CCM formation in iECre;Krit1fl/fl and iECre;VilCre;Krit1fl/fl littermates was assessed visually (left and middle panels) and using microCT imaging (right panels). Scale bars 1mm. D, Blinded microCT quantitation of CCM lesion burden in P21 iECre;Krit1fl/fl and iECre;VilCre;Krit1fl/fl littermates. n≥16 animals per genotype and 7 distinct litters. E-G, H&E staining of hindbrain sections from P21 iBECre;VilCre;Pdcd10fl/fl, iBECre;Pdcd10fl/fl, and iBECre;VilCre;Pdcd10fl/+ littermates. Arrows indicate extravascular hemorrhage that was observed in iBECre;VilCre;Pdcd10fl/fl animals. Boxes in left images denote area of magnified image on the right. Scale bars 500 μm (left images) and 100 μm (right images). H-I, H&E staining of hindbrain sections from P21 iECre;Krit1fl/fl and iECre;VilCre;Krit1fl/fl littermates. Boxes in left images denote area of magnified image on the right. Scale bars 500 μm (left images) and 100 μm (right images). Results representative of n≥3 animals per genotype and four distinct litters. Error bars shown as s.e.m. and significance determined by unpaired, two-tailed Welch’s t-test. ***indicates p<0.001; n.s. indicates p>0.05.
Figure 4.
Figure 4.. Gut barrier and blood TLR4 ligand following gut epithelial loss of PDCD10 or KRIT1.
A-B, H&E histology of methacarn-fixed colons from iBECre;Pdcd10fl/fl, iBECre;VilCre;Pdcd10fl/+, and iBECre;VilCre;Pdcd10fl/fl animals (A) or iECre;Krit1fl/fl and iECre;VilCre;Krit1fl/fl animals (B) at P21. Low magnification images of the colonic fecal pellet (top) and higher magnification images of the colonic crypts (bottom). The brains of these animals with CCM lesions are shown in Figure 3. Brackets denote the thickness of the mucus layer. Arrows indicate goblet cells. Asterisks highlight colonic crypts. Scale bars 100 μm (top panels) and 50 μm (bottom panels). Results are representative of n≥16 animals per genotype and at least 7 distinct litters. C-D, Quantitation of colonic mucus layer from the indicated H&E stained, methacarn-fixed, tissue sections in A and B. Each point represents measurements around one fecal pellet, n≥16 animals per genotype and at least 7 distinct litters. E, Fecal lipocalin-2 (LCN2) concentration measured by ELISA in VilCre;Pdcd10fl/fl, VilCre;Pdcd10fl/+, or littermate controls (Pdcd10fl/+ or fl/fl). n≥12 animals per genotype from 4 distinct litters. F, Fecal LCN2 concentration measured by ELISA in VilCre;Krit1fl/fl and littermate Krit1fl/fl animals. n≥11 animals per genotype and 3 distinct litters. G-H, Immunostaining for the neutrophil marker Ly6G is shown for P21 colons from Pdcd10fl/fl, VilCre;Pdcd10fl/+, VilCre;Pdcd10fl/fl littermates and Krit1fl/fl, VilCre;Krit1fl/fl littermates. Scale bars 50 μm. I-J, Quantification of Ly6G-positive crypt abscesses per colonic section analyzed. Each point represents a distinct animal. Results are representative of n≥ 4 animals per genotype and at least 3 distinct litters. K-L, TLR4 agonist activity detected in the blood of VilCre;Pdcd10fl/fl animals and VilCre;Krit1fl/fl animals. n≥13 animals per genotype and at least 7 distinct litters. Error bars shown as s.e.m. and significance determined by Kruskall-Wallis one-way ANOVA with Dunn’s correction for multiple comparisons (panels C, E, I) or unpaired, two-tailed Student’s t-test (panels D, F, J). ****indicates p<0.0001; **indicates p<0.01; n.s. indicates p>0.05.
Figure 5.
Figure 5.. Relationship of the colonic mucus barrier and CCM formation.
A, H&E staining of methacarn fixed colon samples from iBECre;Pdcd10fl/fl, iBECre;Pdcd10fl/fl;Muc2+/−, and iBECre;Pdcd10fl/fl;Muc2−/− animals. The mucus barrier is indicated with brackets. Scale bars 100 μm. B, Quantitation of the area of the mucus layers shown in (A). Each point represents measurement around one fecal pellet. n≥10 animals per genotype and 9 distinct litters. C, CCM formation in representative P21 iBECre;Pdcd10fl/fl, iBECre;Pdcd10fl/fl;Muc2+/−, and iBECre;Pdcd10fl/fl;Muc2−/− animals is shown visually in the hindbrain (top), hindbrain and forebrain (middle) and with microCT imaging (bottom). Scale bars 1 mm. D, Blinded microCT quantification of CCM lesion volumes in P21 iBECre;Pdcd10fl/fl, iBECre;Pdcd10fl/fl;Muc2+/−, and iBECre;Pdcd10fl/fl;Muc2−/− littermates. n≥25 animals per genotype and 17 distinct litters. Error bars shown as s.e.m. and significance determined by Kruskall-Wallis one-way ANOVA with Dunn’s correction for multiple comparisons (panels B and D). ****indicates p<0.0001; ***indicates p<0.001;**indicates p<0.01; *indicates p<0.05
Figure 6.
Figure 6.. Analysis of the gut microbiome following loss of gut epithelial PDCD10 or MUC2.
A, Experimental design in which females were mated, individually housed prior to natural delivery of pups, and fecal pellets collected from each pup at P21 prior to weaning for 16S rRNA bacterial gene sequencing. B-E, Principle Coordinates Analysis (PCoA) of weighted UniFrac bacterial composition distances from the feces of the indicated animals. Each box shows analysis of littermate animals while accounting for caging differences. P-values compare bacterial compositions in the indicated groups using PERMANOVA also considering individual cage differences and corrected for multiple comparisons using the Bonferroni method. (B-D). n≥10 animals per genotype and at least four distinct cages/litters. Overall p-values comparing homozygous animals to wildtype or heterozygous controls are shown in plot, as well as the pairwise comparisons (q-values) in legend. F, Mean difference of logit transformed relative abundance of the indicated bacteria taxa estimated with linear mixed effects models in VilCre;Krit1fl/fl, VilCre;Pdcd10fl/fl, iBECre;VilCre;Pdcd10fl/fl, and iBECre;Pdcd10fl/fl;Muc2−/− animals compared to their respective VilCre-negative or Muc2+/+ littermate controls. G, Mean difference of logit transformed relative abundance of the indicated bacteria taxa estimated with linear mixed effects models in VilCre;Pdcd10fl/+, iBECre;VilCre;Pdcd10fl/+, and iBECre;Pdcd10fl/fl;Muc2+/− animals compared to their respective VilCre-negative or Muc2+/+ littermate controls. Significance (false discovery rate, q) determined by linear mixed effects models with Benjamini-Hochberg correction for multiple comparisons.
Figure 7.
Figure 7.. Effects of chronic P80 dietary emulsifier intake on the colonic mucosal barrier and CCM formation.
A, H&E staining of methacarn fixed colon samples from vehicle and Pdcd10+/− animals administered 1% P80 in drinking water for two weeks. The mucus barrier is indicated with brackets. Scale bars 100 μm. B, Quantitation of the area of the mucus layers shown in (A). Each point represents measurement around one fecal pellet. n=7 animals per genotype. C-D, Principle Coordinates Analysis (PCoA) of unweighted and weighted UniFrac bacterial composition distances from the feces of the indicated animals administered 1% P80 for 4 months is shown. P-values compare bacterial compositions in the indicated groups using PERMANOVA also considering individual cage differences and corrected for multiple comparisons using the Bonferroni method.. n=12 animals per genotype and five distinct cages per treatment. E-G, Spontaneous CCM formation was analyzed using microCT imaging (E, F) and lesion volume measurement normalized to total brain volume (G) in animals of the indicated genotypes administered 1% P80 for 4 months. n≥16 animals per treatment group. Error bars shown as s.e.m. and significance determined by Kruskall-Wallis one-way ANOVA with Dunn’s correction for multiple comparisons (B and D) or Mann-Whitney non-parametric U-test (G). ****indicates p<0.0001; **indicates p<0.01; *indicates p<0.05.
Figure 8.
Figure 8.. Dexamethasone therapy highlights a gut-brain CCM axis.
A, Visual assessment of CCM formation in ten-day old (P10) iECre;Krit1fl/fl littermates treated at P5 with vehicle or the indicated doses of dexamethasone. 0.8 mg/kg dose was used for all following experiments. Scale bars 1 mm. Images are representative of n≥3 animals per treatment group from at least 2 distinct litters. B, Visual assessment of CCM formation in iECre;Krit1fl/fl littermates treated with vehicle or dexamethasone. Scale bars 1 mm. C, Blinded microCT quantitation of CCM lesion burden in P10 iCre;Krit1fl/fl littermates treated with vehicle or dexamethasone. n≥8 animals per treatment group and 3 distinct litters. D, Relative amounts of Krit1, Map3k3, Klf2, Klf4, Tlr4, and Cd14 expression in cerebellar endothelial cells freshly isolated from P10 iECre;Krit1fl/fl littermates treated with P5 vehicle or dexamethasone. n≥4 animals per treatment group and 3 distinct litters. E, Visual assessment of CCM formation in iECre;Krit1fl/fl;Nr3c1fl/fl littermates treated with vehicle or dexamethasone. Scale bars 1 mm. Results are representative of n≥5 animals per group and five independent experiments. F, Blinded microCT quantitation of CCM lesion burden in P10 iECre;Krit1fl/fl;Nr3c1fl/fl littermates treated with vehicle or dexamethasone. n≥8 animals per treatment group and 3 distinct litters. G, H&E staining of P10 colon sections from iECre;Krit1fl/fl littermates treated with P5 vehicle or dexamethasone. Note the goblet cells in the dexamethasone treated colon (arrows). Scale bars 50 μm. H, Immunoblot analysis of MUC2-expression in P10 colons from iECre;Krit1fl/fl littermates treated with P5 vehicle or dexamethasone (top, anti-MUC2). Total protein loading detected using REVERT™ is shown below. Molecular weight markers (kDa) on left. Each lane is whole colonic lysate from one distinct animal. Results are representative of n≥5 animals per group and two distinct litters. I-J, Visual assessment of CCM formation in iBECre;Pdcd10fl/fl;Muc2+/− (I) and iBECre;Pdcd10fl/fl;Muc2−/− (J) animals treated with P5 vehicle or dexamethasone. Scale bars 1 mm. K, Blinded microCT quantitation of CCM lesion burden in P10 iBECre;Pdcd10fl/fl;Muc2+/− and iBECre;Pdcd10fl/fl;Muc2−/− littermates treated with vehicle or dexamethasone. n≥6 animals per treatment group and ≥3 distinct litters. L-M, Visual assessment of CCM formation in iECre;Krit1fl/fl;Nr3c1fl/fl (L) and iECre;VilCre;Krit1fl/fl;Nr3c1fl/fl (M) littermates at P10 after treatment with P5 vehicle or dexamethasone.. Scale bars 1 mm. N, Blinded microCT quantitation of CCM lesion burden in P10 iECre;Krit1fl/fl;Nr3c1fl/fl and iECre;VilCre;Krit1fl/fl;Nr3c1fl/fl littermates treated with vehicle or dexamethasone. n≥8 animals per treatment group and 3 distinct litters. Error bars shown as s.e.m. and significance determined by unpaired, two-tailed Student’s t-test. ****indicates p<0.0001; ***indicated p<0.001; **indicates p<0.01.

References

    1. Benakis C, Brea D, Caballero S, Faraco G, Moore J, Murphy M, Sita G, Racchumi G, Ling L, Pamer EG, Iadecola C, Anrather J, Commensal microbiota affects ischemic stroke outcome by regulating intestinal gammadelta T cells. Nat Med 22, 516–523 (2016); published online EpubMay (10.1038/nm.4068). - DOI - PMC - PubMed
    1. Stanley D, Mason LJ, Mackin KE, Srikhanta YN, Lyras D, Prakash MD, Nurgali K, Venegas A, Hill MD, Moore RJ, Wong CH, Translocation and dissemination of commensal bacteria in post-stroke infection. Nat Med 22, 1277–1284 (2016); published online EpubNov (10.1038/nm.4194). - DOI - PubMed
    1. Faraco G, Brea D, Garcia-Bonilla L, Wang G, Racchumi G, Chang H, Buendia I, Santisteban MM, Segarra SG, Koizumi K, Sugiyama Y, Murphy M, Voss H, Anrather J, Iadecola C, Dietary salt promotes neurovascular and cognitive dysfunction through a gut-initiated TH17 response. Nature neuroscience 21, 240–249 (2018); published online EpubFeb (10.1038/s41593-017-0059-z). - DOI - PMC - PubMed
    1. Sampson TR, Debelius JW, Thron T, Janssen S, Shastri GG, Ilhan ZE, Challis C, Schretter CE, Rocha S, Gradinaru V, Chesselet MF, Keshavarzian A, Shannon KM, Krajmalnik-Brown R, Wittung-Stafshede P, Knight R, Mazmanian SK, Gut Microbiota Regulate Motor Deficits and Neuroinflammation in a Model of Parkinson’s Disease. Cell 167, 1469–1480 e1412 (2016); published online EpubDec 01 (10.1016/j.cell.2016.11.018). - DOI - PMC - PubMed
    1. Wang PY, Caspi L, Lam CK, Chari M, Li X, Light PE, Gutierrez-Juarez R, Ang M, Schwartz GJ, Lam TK, Upper intestinal lipids trigger a gut-brain-liver axis to regulate glucose production. Nature 452, 1012–1016 (2008); published online EpubApr 24 (10.1038/nature06852). - DOI - PubMed

Publication types

MeSH terms

Supplementary concepts