. 2019 Nov 27;10(12):898.
doi: 10.1038/s41419-019-2133-9.

Homogenous generation of dopaminergic neurons from multiple hiPSC lines by transient expression of transcription factors

Affiliations

Homogenous generation of dopaminergic neurons from multiple hiPSC lines by transient expression of transcription factors

Sameehan Mahajani et al. Cell Death Dis. .

Abstract

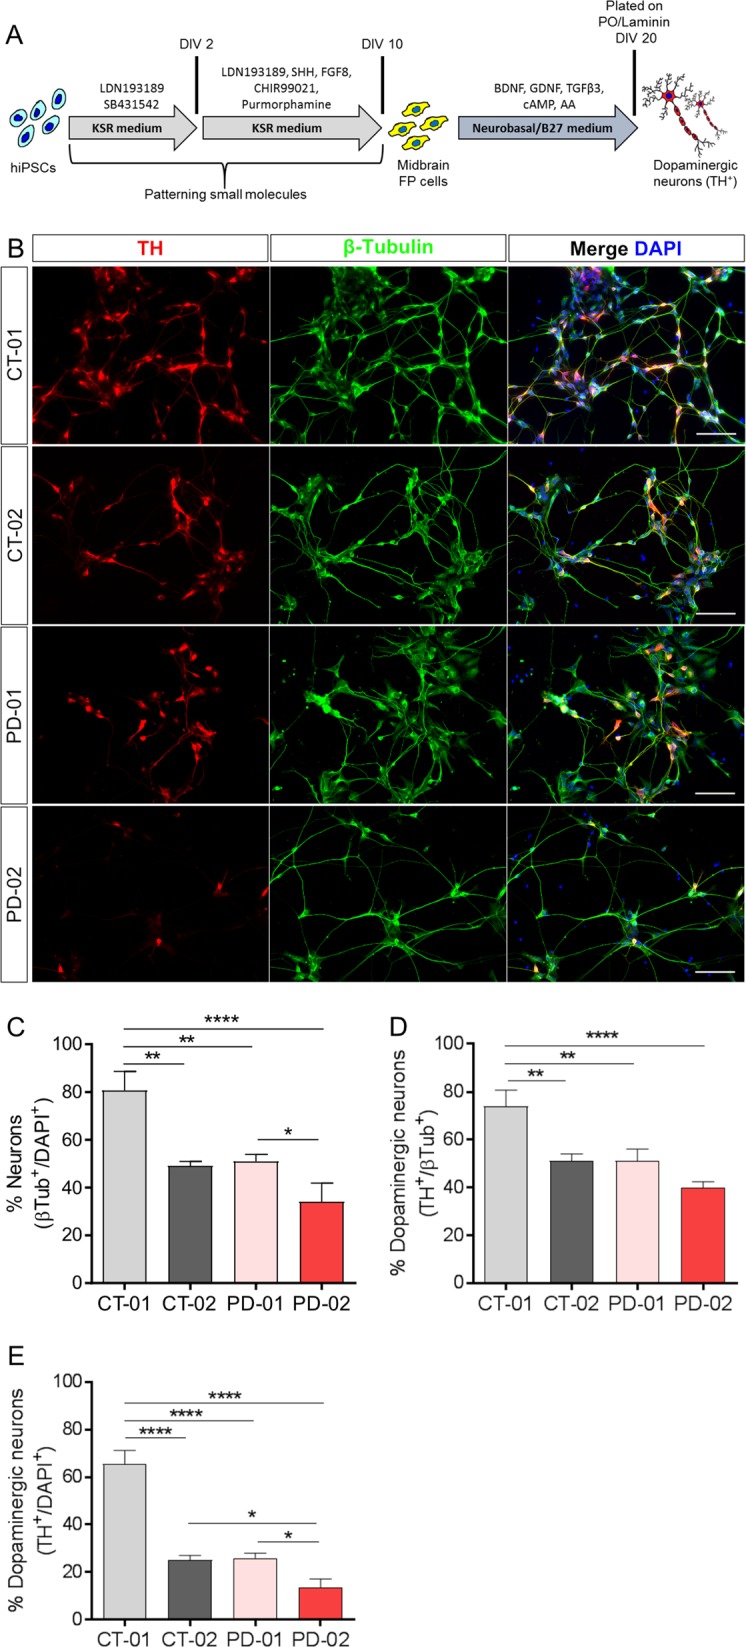
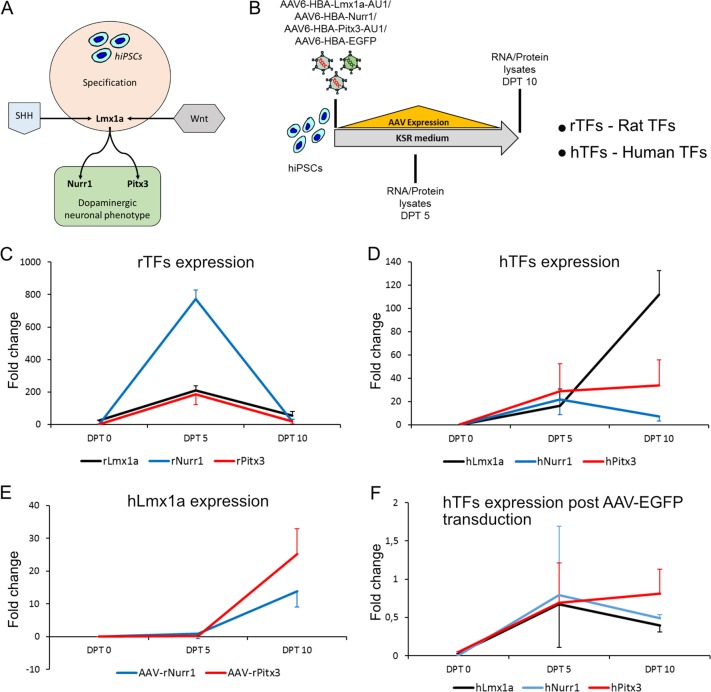
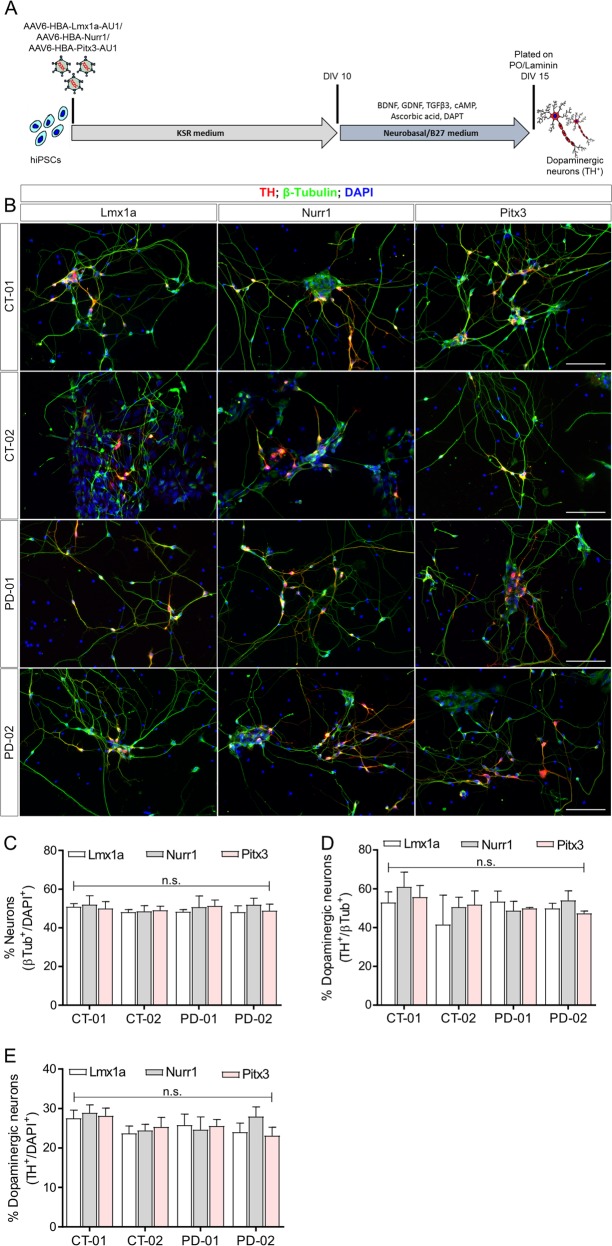
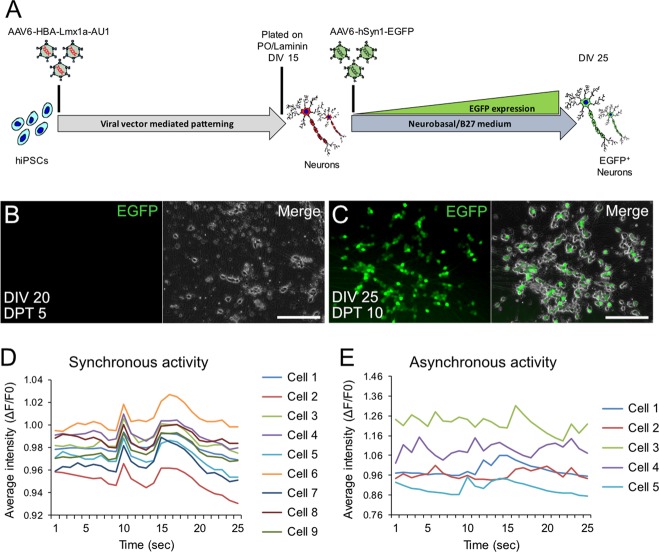
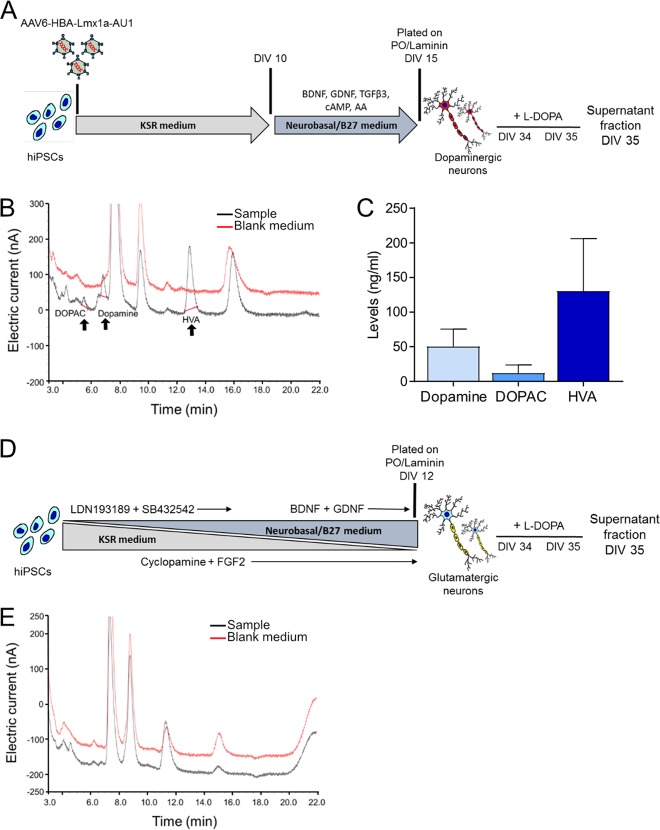
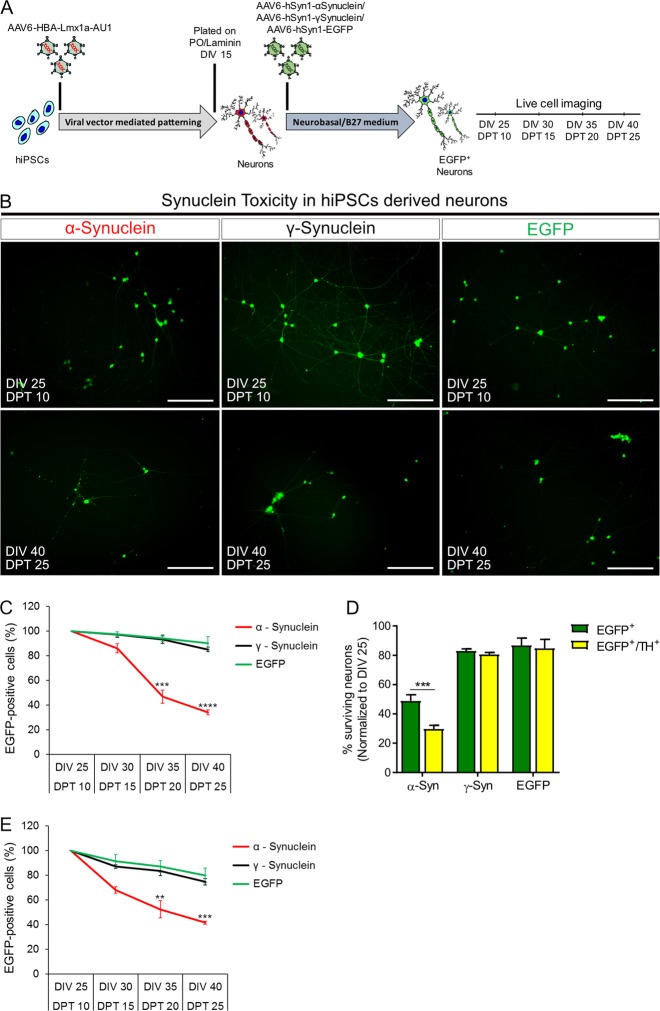
A major hallmark of Parkinson's disease is loss of dopaminergic neurons in the substantia nigra pars compacta (SNpc). The pathophysiological mechanisms causing this relatively selective neurodegeneration are poorly understood, and thus experimental systems allowing to study dopaminergic neuron dysfunction are needed. Induced pluripotent stem cells (iPSCs) differentiated toward a dopaminergic neuronal phenotype offer a valuable source to generate human dopaminergic neurons. However, currently available protocols result in a highly variable yield of dopaminergic neurons depending on the source of hiPSCs. We have now developed a protocol based on HBA promoter-driven transient expression of transcription factors by means of adeno-associated viral (AAV) vectors, that allowed to generate very consistent numbers of dopaminergic neurons from four different human iPSC lines. We also demonstrate that AAV vectors expressing reporter genes from a neuron-specific hSyn1 promoter can serve as surrogate markers for maturation of hiPSC-derived dopaminergic neurons. Dopaminergic neurons differentiated by transcription factor expression showed aggravated neurodegeneration through α-synuclein overexpression, but were not sensitive to γ-synuclein overexpression, suggesting that these neurons are well suited to study neurodegeneration in the context of Parkinson's disease.


Conflict of interest statement

The authors declare that the research was conducted in the absence of any commercial or financial relationships that could be construed as a potential conflict of interest.

Figures

Fig. 1
Fig. 1. Quantification of the percentages of neurons and dopaminergic neurons obtained from different hiPSC lines using pharmacological compounds.
a Schematic representation of the use of pharmacological compounds to pattern hiPSCs to generate TH+ dopaminergic neurons at DIV 25. The patterning protocol consists of inhibiting SMAD signaling and activating SHH and WNT signaling to obtain midbrain floor-plate precursors by DIV 11. These cells in the presence of growth factors mature into TH+ dopaminergic neurons. b Representative fluorescence images of immunoreactivity for the dopaminergic neuronal marker TH (red) and the pan-neuronal marker β-Tubulin (green) at DIV 25. Nuclei are counterstained with DAPI (blue). Scale bars: 100 µm. c Quantitative analysis of the percentage of neurons obtained after patterning with pharmacological compounds. Data represent the average percentage of neurons of total cell numbers in culture (β-Tubulin+/DAPI+). *p < 0.05; **p < 0.01; ****p < 0.0001, one-way ANOVA followed by Bonferroni’s post-hoc test. d Quantitative analysis of total percentage of dopaminergic neurons obtained after patterning with pharmacological compounds. Data represent the average percentage of total dopaminergic neurons out of all neurons in culture (TH+/β-Tubulin+). **p < 0.01; ***p < 0.001, one-way ANOVA followed by Bonferroni’s post-hoc test. e Quantitative analysis of total percentage of dopaminergic neurons obtained after patterning with pharmacological compounds. Data represent the average percentage of total dopaminergic neurons out of all cells in culture (TH+/DAPI+). *p < 0.05; ****p < 0.0001, one-way ANOVA followed by Bonferroni’s post-hoc test. In all graphs, bars represent the average percentage ± SD from at least three independent differentiations for each of the four hiPSC lines.
Fig. 2
Fig. 2. Expression pattern of transcription factors.
a Schematic representation of involvement of transcription factors Lmx1a, Nurr1 and Pitx3 in patterning of hiPSCs to dopaminergic neurons. b Experimental design for the use of viral vector to pattern hiPSCs to generate dopaminergic neurons. cf Quantitative analysis of mRNA expression of infected rat transcription factors (rTFs) (c), endogenous human transcription factors (hTFs) (d), expression of endogenous hLmx1a in hiPSCs after transducing hiPSCs with AAV-HBA-rNurr1 and AAV-HBA-rPitx3-AU1 (e) and expression of endogenous human transcription factors (hTFs) after transducing hiPSCs with AAV-HBA-EGFP (f). Data represented as fold change ± SD as compared to their respective untreated control at the respective time point from three independent differentiations for each transcription factor.
Fig. 3
Fig. 3. Quantification of percentage of neurons and dopaminergic neurons obtained from four different hiPSC lines using viral vector-mediated patterning.
a Schematic representation of the use of adeno-associated viral vectors encoding rLmx1a, rNurr1 and rPitx3. b Representative fluorescence images of immunoreactivity for the dopaminergic neuronal marker TH (red) and the pan-neuronal marker β-Tubulin (green) at DIV 20. Nuclei are counterstained with DAPI (blue). Scale bars: 100 µm. c Quantitative analysis of total percentage of neurons obtained after viral vector-mediated patterning. Data represent the average percentage of total neurons of all cells in culture (β-Tubulin+/DAPI+). d Quantitative analysis of total percentage of dopaminergic neurons obtained after viral vector-mediated patterning. Data represent the average percentage of total dopaminergic neurons out of total number of neurons in culture (TH+/β-Tubulin+). e Quantitative analysis of total percentage of dopaminergic neurons obtained after viral vector-mediated patterning. Data represent the average percentage of total dopaminergic neurons out of total number of cells in culture (TH+/DAPI+). In all graphs, bars represent the average percentage ± SD from three independent differentiations and independent transductions for each of the four hiPSC lines. Non-significant (n.s.) via two-way ANOVA followed by Bonferroni’s post-hoc test.
Fig. 4
Fig. 4. Maturation of hiPSC-derived neurons obtained after viral vector-mediated patterning.
a Experimental design to monitor expression of EGFP in neurons obtained after rLmx1a viral vector-mediated patterning. b, c Representative live cell images showing EGFP expression (c) or lack of (b) in hiPSC-derived neurons at DIV 25 (c) vs DIV 20 (b). Scale bar: 100 µm. d, e Quantitative analysis of endogenous spontaneous activity; synchronous (d) or asynchronous (e) activity observed after transducing CT-01 hiPSC-derived neurons with AAV-hSyn1-GCaMP3.5-EGFP. Data represented as change in average intensity (ΔF/F0 of GCaMP3.5-EGFP fluorescence) recorded over 25 s per visual field.
Fig. 5
Fig. 5. hiPSC-derived neurons release dopamine and its metabolites after treatment with L-DOPA.
a Experimental design to detect the release of dopamine in CT-01 hiPSC-derived neurons at DIV 35. Neurons were treated with L-DOPA at DIV 34 and DIV 35 with the supernatant collected 4 h later (i.e. at DIV 35). b, c Representative HPLC chromatogram (b) and quantitative analysis (c) of released dopamine, DOPAC and HVA in hiPSC-derived dopaminergic neurons patterned using transcription factor rLmx1a. The black and red lines in the chromatogram (b) represent supernatant of the sample and matched blank medium (without cells), respectively. d Experimental design to detect released dopamine in CT-01 hiPSC-derived glutamatergic neurons at DIV 35. Patterning was performed using SMAD inhibitors LDN/SB along with cyclopamine and FGF2. Neuronal cells were plated on DIV 12 in the presence of growth factors like BDNF and GDNF. Similarly, these neurons were treated with L-DOPA at DIV 34 and DIV 35, with the supernatant collected 4 h later (i.e. at DIV 35). e Representative HPLC chromatogram with no detectable levels of dopamine, DOPAC and HVA observed in the supernatant of hiPSC-derived glutamatergic neurons at DIV 35. The black and red lines in the chromatogram (e) represent supernatant of the sample and matched blank medium (without cells), respectively. The other unspecific peaks present in the chromatogram (b, e) arise due to the neurobasal medium composition.
Fig. 6
Fig. 6. Synuclein toxicity in hiPSC-derived neurons.
a Experimental design for determining the toxicity induced by synucleins in hiPSC-derived neurons. Confluent CT-01 hiPSCs were transduced with AAV-HBA-rLmx1a-AU1 and kept in culture until DIV 15, when they were plated on coverslips. These neuronal-like cells were transduced with neuron-specific AAV-hSyn1-α-synuclein-EGFP, AAV-hSyn1-γ-synuclein-EGFP or AAV-hSyn1-EGFP viral vector as a control 4 h after plating (i.e. at DIV 15). Live cell imaging was performed every fifth day starting from DIV 25 (i.e. DPT 10) until DIV 40 (i.e. DPT 25). b Representative live cell images of hiPSC-derived neurons infected with either α-synuclein, γ-synuclein or EGFP at DIV 25 (DPT 10) and DIV 40 (DPT 25). Scale bars: 100 µm. c Quantitative analysis of EGFP+ neurons surviving over time when infected with either α-synuclein (red), γ-synuclein (black) or EGFP (green). Data represented as percentage of surviving EGFP+ neurons over time normalized to the surviving cells at the first time point, i.e. DIV 25 (DPT 10). Lines represent the average percentage ± SD of EGFP+ neurons from three independent experiments and three independent transductions at each time point. d Quantitative analysis of percent surviving dopaminergic or non-dopaminergic neurons after transducing CT-01 hiPSC-derived neurons with either α-synuclein, γ-synuclein or EGFP at DIV 40 (DPT 25), normalized to the percent surviving neurons at DIV 25 (DPT 10). Data represent the average percentage ± SD of EGFP+ or EGFP+/TH+ neurons from three independent experiments at DIV 40 (DPT 25). e Quantitative analysis of hiPSC-derived glutamatergic EGFP+ neurons surviving over time when infected with either α-synuclein (red), γ-synuclein (black) or EGFP (green). Data represented as percentage of surviving EGFP+ neurons over time normalized to the surviving cells at the first time point, i.e. DIV 25 (DPT 10). Lines represent the average percentage ± SD of EGFP+ neurons from three independent differentiations and three independent transductions at each time point. **p < 0.01; ***p < 0.001; ****p < 0.0001; unpaired t-test when compared to EGFP infected neurons at the respective time point.

Similar articles

Cited by

References

    1. Polymeropoulos MH, et al. Mutation in the alpha-synuclein gene identified in families with Parkinson’s disease. Science. 1997;276:2045–2047. doi: 10.1126/science.276.5321.2045. - DOI - PubMed
    1. Spillantini MG, et al. Alpha-synuclein in Lewy bodies. Nature. 1997;388:839–840. doi: 10.1038/42166. - DOI - PubMed
    1. Goedert M, Spillantini MG, Del Tredici K, Braak H. 100 years of Lewy pathology. Nat. Rev. Neurol. 2013;9:13–24. doi: 10.1038/nrneurol.2012.242. - DOI - PubMed
    1. Surmeier DJ, Obeso JA, Halliday GM. Selective neuronal vulnerability in Parkinson disease. Nat. Rev. Neurosci. 2017;18:101–113. doi: 10.1038/nrn.2016.178. - DOI - PMC - PubMed
    1. Halliday GM, et al. Neuropathology of immunohistochemically identified brainstem neurons in Parkinson’s disease. Ann. Neurol. 1990;27:373–385. doi: 10.1002/ana.410270405. - DOI - PubMed