

GraphTyper2 enables population-scale genotyping of structural variation using pangenome graphs
- PMID: 31776332
- PMCID: PMC6881350
- DOI: 10.1038/s41467-019-13341-9
GraphTyper2 enables population-scale genotyping of structural variation using pangenome graphs
Abstract
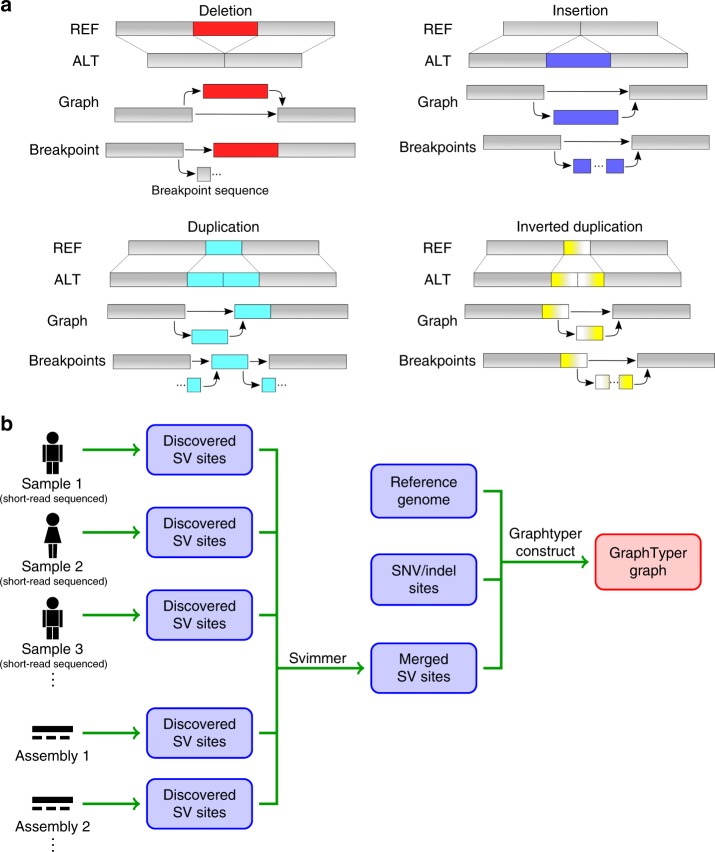
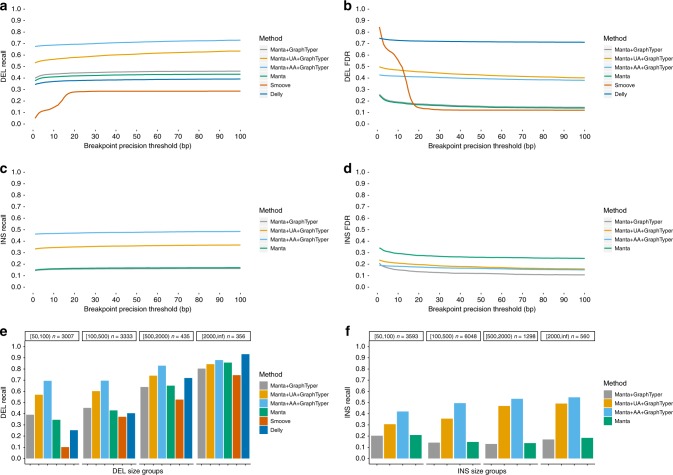
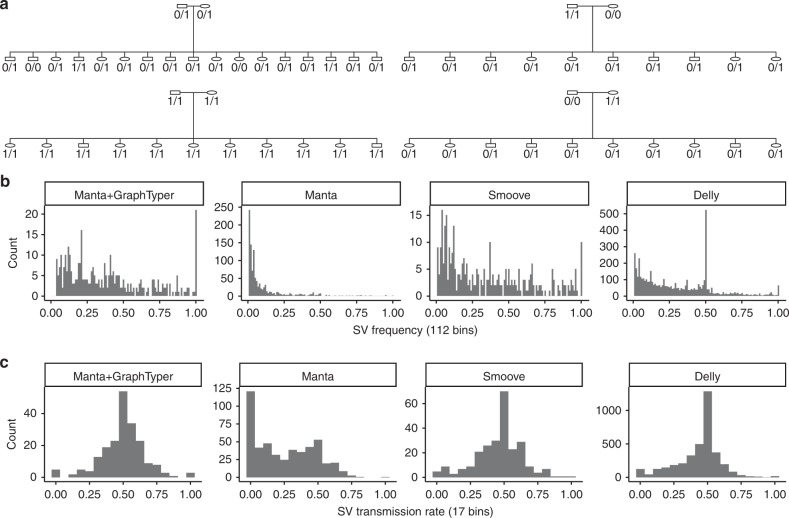
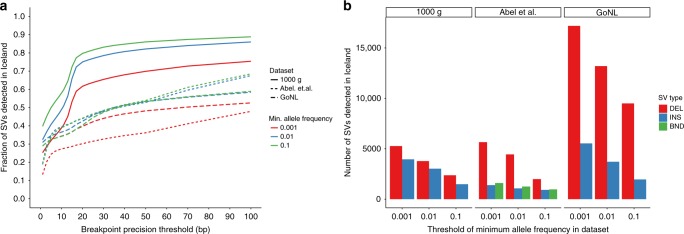
Analysis of sequence diversity in the human genome is fundamental for genetic studies. Structural variants (SVs) are frequently omitted in sequence analysis studies, although each has a relatively large impact on the genome. Here, we present GraphTyper2, which uses pangenome graphs to genotype SVs and small variants using short-reads. Comparison to the syndip benchmark dataset shows that our SV genotyping is sensitive and variant segregation in families demonstrates the accuracy of our approach. We demonstrate that incorporating public assembly data into our pipeline greatly improves sensitivity, particularly for large insertions. We validate 6,812 SVs on average per genome using long-read data of 41 Icelanders. We show that GraphTyper2 can simultaneously genotype tens of thousands of whole-genomes by characterizing 60 million small variants and half a million SVs in 49,962 Icelanders, including 80 thousand SVs with high-confidence.
Conflict of interest statement
All authors are employees of deCODE Genetics/Amgen, Inc.
Figures
Similar articles
-
Graphtyper enables population-scale genotyping using pangenome graphs.Nat Genet. 2017 Nov;49(11):1654-1660. doi: 10.1038/ng.3964. Epub 2017 Sep 25. Nat Genet. 2017. PMID: 28945251
-
Genotyping structural variants in pangenome graphs using the vg toolkit.Genome Biol. 2020 Feb 12;21(1):35. doi: 10.1186/s13059-020-1941-7. Genome Biol. 2020. PMID: 32051000 Free PMC article.
-
Sawfish: improving long-read structural variant discovery and genotyping with local haplotype modeling.Bioinformatics. 2025 Mar 29;41(4):btaf136. doi: 10.1093/bioinformatics/btaf136. Bioinformatics. 2025. PMID: 40203061 Free PMC article.
-
Geographic distribution and adaptive significance of genomic structural variants: an anthropological genetics perspective.Hum Biol. 2014 Fall;86(4):260-75. doi: 10.13110/humanbiology.86.4.0260. Hum Biol. 2014. PMID: 25959693 Review.
-
Challenges in studying genomic structural variant formation mechanisms: the short-read dilemma and beyond.Bioessays. 2011 Nov;33(11):840-50. doi: 10.1002/bies.201100075. Epub 2011 Sep 30. Bioessays. 2011. PMID: 21959584 Review.
Cited by
-
The design and construction of reference pangenome graphs with minigraph.Genome Biol. 2020 Oct 16;21(1):265. doi: 10.1186/s13059-020-02168-z. Genome Biol. 2020. PMID: 33066802 Free PMC article.
-
Evaluation of four methods to identify the homozygotic sex chromosome in small populations.BMC Genomics. 2022 Feb 24;23(1):160. doi: 10.1186/s12864-022-08393-z. BMC Genomics. 2022. PMID: 35209843 Free PMC article.
-
Variant calling and benchmarking in an era of complete human genome sequences.Nat Rev Genet. 2023 Jul;24(7):464-483. doi: 10.1038/s41576-023-00590-0. Epub 2023 Apr 14. Nat Rev Genet. 2023. PMID: 37059810 Review.
-
Structural variation detection and association analysis of whole-genome-sequence data from 16,543 Alzheimer's disease sequencing project subjects.Alzheimers Dement. 2025 Jun;21(6):e70277. doi: 10.1002/alz.70277. Alzheimers Dement. 2025. PMID: 40528303 Free PMC article.
-
Evidence for a transgenerational mutational signature from ionizing radiation exposure in humans.Sci Rep. 2025 Jun 23;15(1):20262. doi: 10.1038/s41598-025-07030-5. Sci Rep. 2025. PMID: 40550869 Free PMC article.
References
MeSH terms
LinkOut - more resources
Full Text Sources
