. 2019 Nov 27;10(1):5399.
doi: 10.1038/s41467-019-13386-w.

Unraveling cis and trans regulatory evolution during cotton domestication

Affiliations

Unraveling cis and trans regulatory evolution during cotton domestication

Ying Bao et al. Nat Commun. .

Abstract

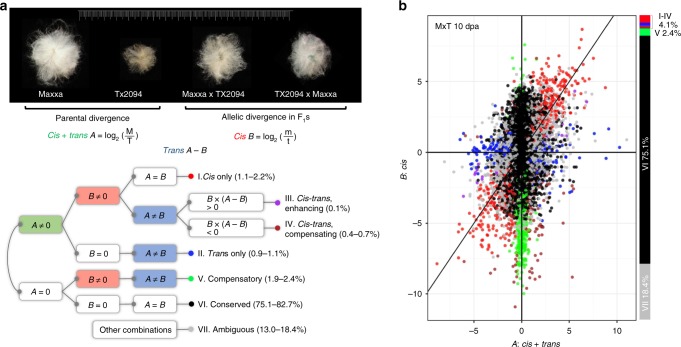
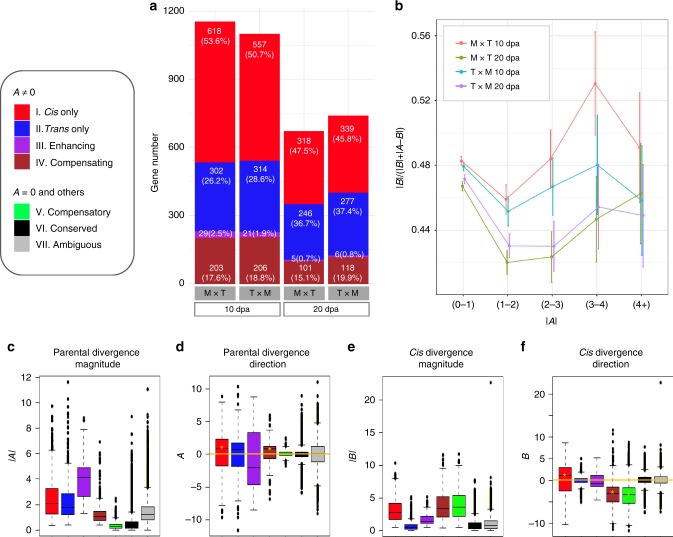
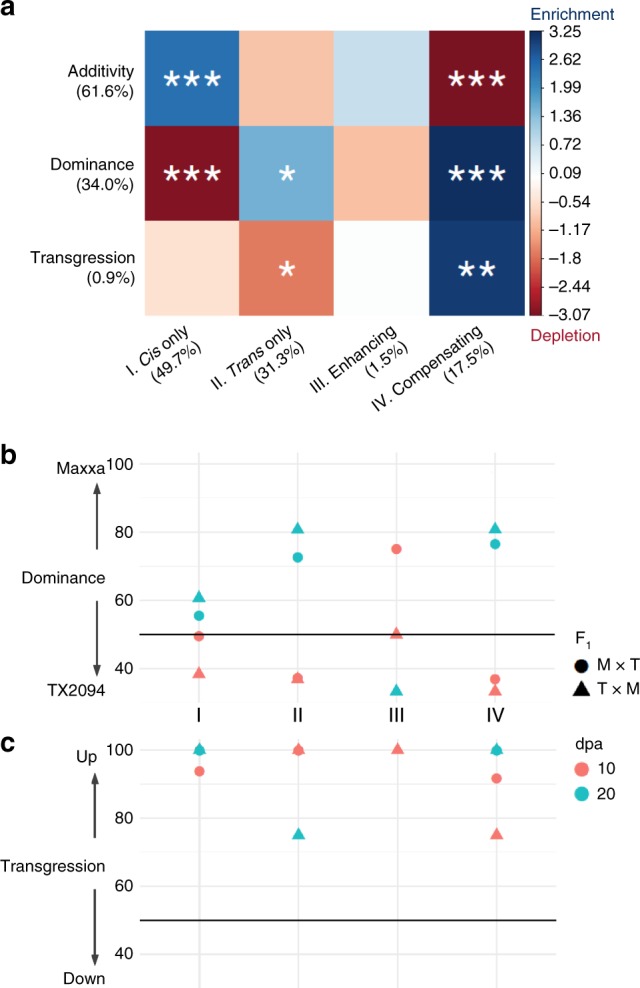
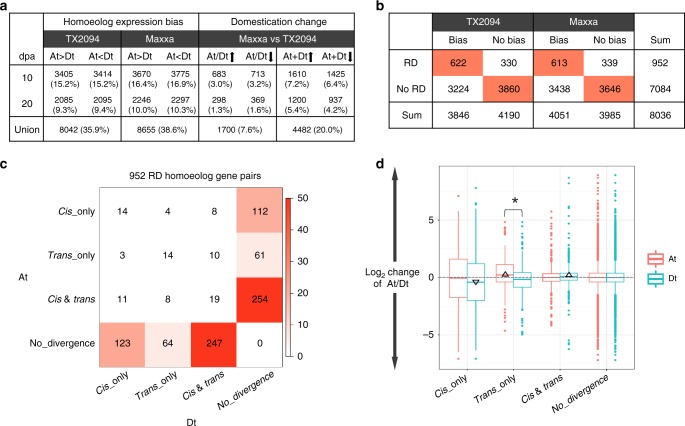
Cis and trans regulatory divergence underlies phenotypic and evolutionary diversification. Relatively little is understood about the complexity of regulatory evolution accompanying crop domestication, particularly for polyploid plants. Here, we compare the fiber transcriptomes between wild and domesticated cotton (Gossypium hirsutum) and their reciprocal F1 hybrids, revealing genome-wide (~15%) and often compensatory cis and trans regulatory changes under divergence and domestication. The high level of trans evolution (54%-64%) observed is likely enabled by genomic redundancy following polyploidy. Our results reveal that regulatory variation is significantly associated with sequence evolution, inheritance of parental expression patterns, co-expression gene network properties, and genomic loci responsible for domestication traits. With respect to regulatory evolution, the two subgenomes of allotetraploid cotton are often uncoupled. Overall, our work underscores the complexity of regulatory evolution during fiber domestication and may facilitate new approaches for improving cotton and other polyploid plants.


Conflict of interest statement

The authors declare no competing interests.

Figures

Fig. 1
Fig. 1
Parental and F1 hybrid expression data enable the ASE study of G. hirsutum domestication. a Using parental and F1 allelic expression divergence between wild and domesticated cottons, genes were assigned into one of seven regulatory categories representing combinations of cis and trans regulatory effects. Briefly, differential expression of any given gene in the parents reflects both cis and trans divergence (A), whereas the expression of the same gene in the common trans environment of the F1 hybrid reflects cis regulatory divergence (B) between parental alleles. While trans divergence cannot be directly measured, it can be inferred via the difference in AB. See methods for additional description. Next to each category, the percentage range of genes was obtained from four sample conditions (M × T and T × M hybrids each at 10 and 20 dpa). b Taking the 10 dpa sample of the F1 hybrid M × T as an example, the scatter plot of cis regulatory divergence (y-axis) vs. parental expression divergence (x-axis) is shown for all seven categories of genes. Category I–IV together only account for 4.1% of 27,816 genes, with the majority of genes assigned to categories of conserved (VI–75.1%), ambiguous (VII–18.4%), or compensatory regulation (V–2.4%). The source data underlying Fig. 1b are provided as a Source Data file.
Fig. 2
Fig. 2
Categorization of cis and trans regulatory divergence. a Regulatory categories I–IV that exhibited parental divergence (A ≠ 0). In 10 and 20 dpa fibers from the reciprocal F1 hybrids M × T and T × M, gene numbers and relative percentages of these four categories were shown. b Proportion of cis regulatory contribution to parental expression divergence. Genes were binned by absolute parental divergence |A| in x-axis, and the amount of absolute total expression divergence due to cis effects |B|/(|B| + |AB|) is shown on the y-axis with error bars depicting 95% confidence intervals. cf Boxplots showing the magnitude and direction of parental expression divergence and cis regulatory divergence, as summarized by pooled M × T and T × M data at both the 10 and 20 dpa developmental stages. Boxplot elements: center line–median; box limits–upper (Q3) and lower (Q1) quartiles; whiskers–smallest and largest non-outlier; points–outliers. Y-axis values above zero in d, f indicate a bias toward higher parental and allelic Maxxa expression, respectively; similarly, below zero indicates a bias towards TX2094. The significant deviations from zero, as indicated by gold star symbol (*), was inferred by Student’s t-test (P < 0.05). Corresponding plots for each F1 hybrid at either stage are shown in Supplementary Fig. 2. Source data are provided as a Source Data file.
Fig. 3
Fig. 3
Relationships between regulatory mechanism and mode of inheritance. a For each combination of inheritance (rows) and cis/trans regulatory (columns) categories, the color shows the magnitude of gene enrichment (blue) and depletion (red) based on residuals of Pearson’s Chi-square test of independence. Blue indicates a positive residual when more genes were observed than expected under the null model of independence, and red indicates fewer genes than expected. Statistical significance was derived from Fisher’s exact test, as indicated by *P < 0.05, **P < 0.01, ***P < 0.001. b Within the category of dominance, percentages of Maxxa-dominant genes are shown for each regulatory category on the x-axis. c Within the category of transgression, the percentage of over-expressed genes are shown for each regulatory category on the x-axis. Source data are provided as a Source Data file.
Fig. 4
Fig. 4
Regulatory evolution and homoeolog expression. a The extent of homoeolog expression bias (1st and 2nd columns) and expression changes under domestication (ratios, At/Dt, and total expression, At + Dt; 3rd and 4th columns, respectively) were measured for 22,394 homoeologous gene pairs. b Contingency tables between cis and trans regulatory divergence and homoeolog bias. A pair of homoeologous genes was considered to exhibit regulatory divergence (RD) if at least one homoeolog was found to be a RD gene (1st row). Homoeolog expression bias was characterized each within TX2094 and Maxxa (columns). Cells displaying significant over-representation (Fisher’s exact test; P < 0.05) are highlighted. c Cross-tabulation of regulatory evolution for 952 RD homoeolog pairs, indicating predominance of cis and trans effects. Cell color indicates the magnitude of significant over-representation based on −log10(P-value) of Fisher’s exact test (i.e., P = 0.05 is converted to 1.3). d Boxplot of homoeolog expression ratio changes under domestication for RD homoeolog pairs. Black triangles indicate significant deviation from zero (Student’s t-test; P < 0.05), and the asterisk (*) denotes a significantly different ratio between At and Dt homoeologs. Boxplot elements: center line–median; box limits–upper (Q3) and lower (Q1) quartiles; whiskers–smallest and largest non-outlier; points–outliers. The source data underlying Fig. 4d are provided as a Source Data file.
Fig. 5
Fig. 5
Predicted GRNs of TX2094 and Maxxa fibers. a Number of candidate genes within the fiber QTL confidence intervals, from a curated list of cell wall-related genes, and those annotated as TFs. For the total of 53 TFs that belong to the list of 1655 regulatory divergent (RD) genes (see annotation in Supplementary Data 2), a GRN was each inferred for TX2094 (b) and Maxxa (c) by Genie3 and visualized using Cytoscape. Edge direction represents the regulatory interaction from TF to target TG genes. Node shape represents the categorization of RD patterns. Node size is proportional to number of target genes (i.e., out-degree). Nodes color represents the membership of consensus co-expression gene modules inferred by WGCNA (see Methods and Supplementary Data 2). TFs marked by asterisk (node 3, 32, and 50) and and (48) were found within the confidence intervals of fiber QTLs and related to cell wall synthesis, respectively. The source data underlying Figs. 5b, c are provided as a Source Data file.

References

    1. Larson G, et al. Current perspectives and the future of domestication studies. Proc. Natl Acad. Sci. USA. 2014;111:6139–6146. doi: 10.1073/pnas.1323964111. - DOI - PMC - PubMed
    1. Meyer RS, Purugganan MD. Evolution of crop species: genetics of domestication and diversification. Nat. Rev. Genet. 2013;14:840–852. doi: 10.1038/nrg3605. - DOI - PubMed
    1. Olsen KM, Wendel JF. A bountiful harvest: genomic insights into crop domestication phenotypes. Annu. Rev. Plant Biol. 2013;64:47–70. doi: 10.1146/annurev-arplant-050312-120048. - DOI - PubMed
    1. Fang L, et al. Genomic insights into divergence and dual domestication of cultivated allotetraploid cottons. Genome Biol. 2017;18:33. doi: 10.1186/s13059-017-1167-5. - DOI - PMC - PubMed
    1. Liu S, et al. Independent mis-splicing mutations in TaPHS1 causing loss of preharvest sprouting (PHS) resistance during wheat domestication. New Phytol. 2015;208:928–935. doi: 10.1111/nph.13489. - DOI - PubMed

Publication types