. 2019 Nov 27;9(1):17677.
doi: 10.1038/s41598-019-53623-2.

A Plant Growth-Promoting Microbial Soil Amendment Dynamically Alters the Strawberry Root Bacterial Microbiome

Affiliations

A Plant Growth-Promoting Microbial Soil Amendment Dynamically Alters the Strawberry Root Bacterial Microbiome

Siwen Deng et al. Sci Rep. .

Abstract

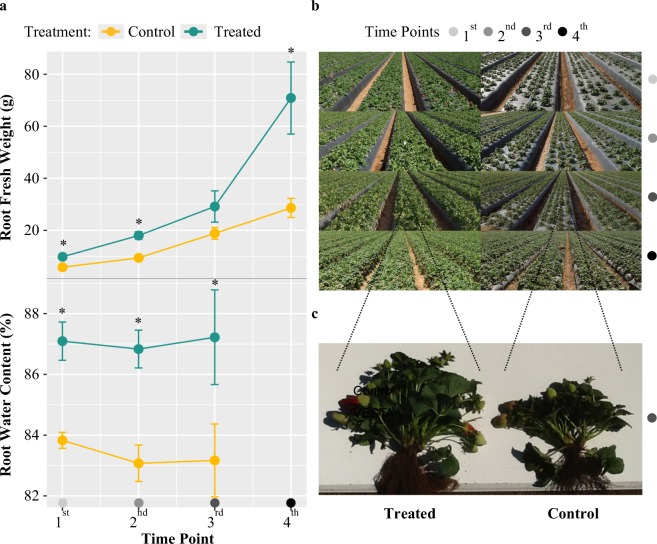
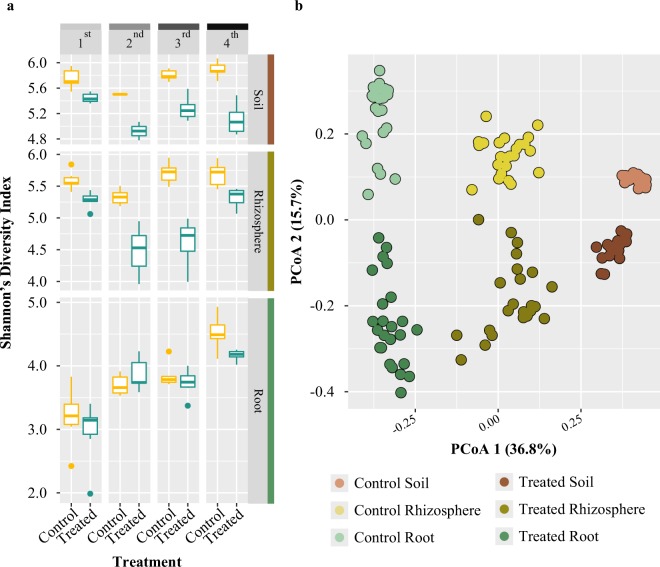
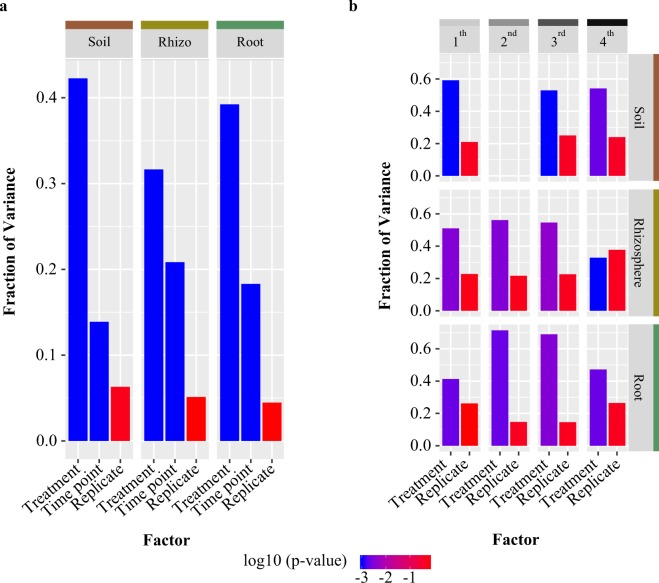
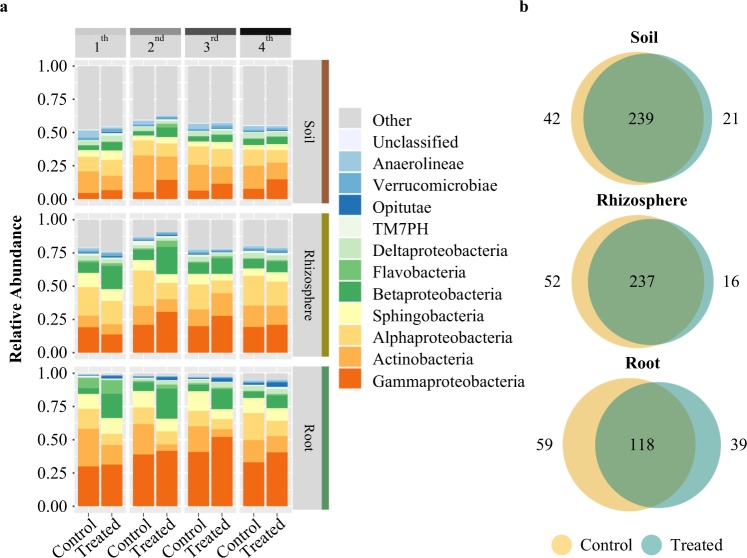
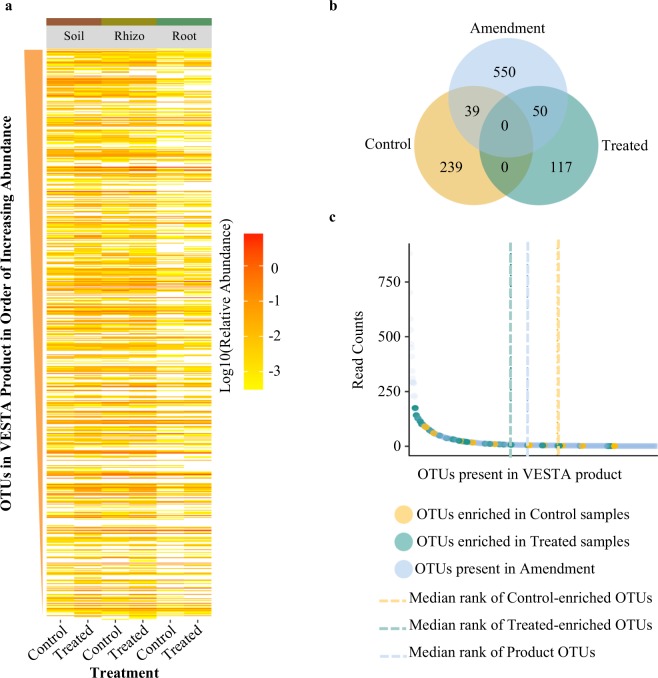
Despite growing interest in utilizing microbial-based methods for improving crop growth, much work still remains in elucidating how beneficial plant-microbe associations are established, and what role soil amendments play in shaping these interactions. Here, we describe a set of experiments that test the effect of a commercially available soil amendment, VESTA, on the soil and strawberry (Fragaria x ananassa Monterey) root bacterial microbiome. The bacterial communities of the soil, rhizosphere, and root from amendment-treated and untreated fields were profiled at four time points across the strawberry growing season using 16S rRNA gene amplicon sequencing on the Illumina MiSeq platform. In all sample types, bacterial community composition and relative abundance were significantly altered with amendment application. Importantly, time point effects on composition are more pronounced in the root and rhizosphere, suggesting an interaction between plant development and treatment effect. Surprisingly, there was slight overlap between the taxa within the amendment and those enriched in plant and soil following treatment, suggesting that VESTA may act to rewire existing networks of organisms through an, as of yet, uncharacterized mechanism. These findings demonstrate that a commercial microbial soil amendment can impact the bacterial community structure of both roots and the surrounding environment.


Conflict of interest statement

Rajnish Khanna is the founder of i-Cultivar, but the company did not influence any aspects of the reporting or this study. The authors declare that they have no competing interests.

Figures

Figure 1
Figure 1
Treatment effect on strawberry root growth. Amendment-treated strawberry plants display evidence of root growth promotion, as compared to controls. (a) Line plot illustrating the average trend of 5 to 6 replicates per treatment per time point for root fresh weight (RFW) in grams and percentage Root Water Content (RWC) in amendment-treated (indicated in blue) and control (yellow) strawberry plants across the four sampling time points. Data shown are mean ± SE. ‘*’ indicates p-value < 0.01 (b) Photographs of amendment-treated and control strawberry fields across four time points in upper panel. Four time points correspond to sampling dates of March 18 (light grey circle), April 8 (grey circle), May 13 (dark grey circle), and August 24 (black circle) in 2015. (c) Two representative plants from treated and control fields from the 3rd sampling time point in lower panel. Amendment-treated strawberry plant displays enhanced root proliferation at the crown and greater aboveground shoot biomass.
Figure 2
Figure 2
Treatment effect on strawberry root microbiome. 16S rRNA bacterial profiling indicates treatment impacts Shannon’s Diversity most distinctly in soil and rhizosphere samples and that samples distinctly cluster by sample type and treatment. (a) Box and whisker plots representing Shannon’s Diversity indices for all samples based on Bray-Curtis distances in amendment-treated (blue) and control (yellow) samples for each sample type and at each of the four sampling time points; soil (upper panel), rhizosphere (middle panel), and root (lower panel) indicate that amendment treatment correlates with a decrease in the within-sample diversity in soil and rhizosphere samples, but not in roots. The horizontal line within each box represents the median index value, and the bottom and top edges of each box indicate the 25th and 75th percentiles, respectively. Individual points are outliers. (b) Principal coordinate analysis (PCoA) plot for all samples using Bray-Curtis distances indicates that the largest source of variation between microbial communities is sample type (PCo 1, 36.8%) and the second largest source of variation is treatment (PCo 2, 15.7%). Both control soil (light brown circles), rhizosphere (light yellow), and root (light green) samples and amendment-treated soil (dark brown), rhizosphere (dark yellow), and root (dark green) samples cluster together within their respective treatment and sample types.
Figure 3
Figure 3
Treatment type explains the greatest bacterial community variance for each sample type and time point. (a) Bar plots displaying fraction of variance explained by treatment, time point and replicate, as determined by canonical analysis of principal coordinates (CAPS) using Bray-Curtis distances. The y-axis indicates the fraction of variance explained by each factor, and the shade of the bar indicates the level of significance (p > 0.01 is in light grey; p < 0.001 is in dark grey). (b) Bar plots displaying fraction of variance determined by CAPS using Bray-Curtis distances and performed separately for each time point (1st, 2nd, 3rd, and 4th) on soil (shown in the upper panel), rhizosphere (middle panel), and root (lower panel) samples. The fraction of variation is indicated by the y-axis, and the shade of the bar indicates the level of significance.
Figure 4
Figure 4
Class-level relative abundance of bacterial communities indicate distinct soil, rhizosphere, and root profiles. (a) Relative abundances bar graphs for the top 12 most abundant bacterial classes for amendment-treated and control samples in soil (upper panel), rhizosphere (middle panel), and root (lower panel) across four time points (1st, 2nd, 3rd, 4th). (b) Venn-diagrams displaying numbers of OTUs shared and distinct between amendment-treated (blue) and control (yellow) samples in soil (upper panel), rhizosphere (middle panel), and root (lower panel) compartments.
Figure 5
Figure 5
OTUs in the product are not highly enriched in treated or control samples. (a) Heatmap displaying degree of enrichment by log10 relative abundance in treated and control soil, rhizosphere, and root samples for the 639 OTUs present in the product. Product OTUs were sorted according to their relative abundance from top (highest) to the bottom (lowest). Darker shades of color indicate higher relative abundance within the samples, whereas lighter shades indicate lower relative abundance. Columns for amendment-treated soils, rhizospheres, and roots generally are darker, indicating greater enrichment in product OTUs than controls, but there was no significant enrichment. (b) Venn-Diagram displaying the OTUs shared and distinct to the product and those uniquely enriched in the amendment-treated or control roots, as determined with indicator species analysis. OTUs uniquely enriched in control (yellow) and treated (green) samples were compared with those present in the product (light blue). More OTUs from the product were distinctly shared with treated samples (50 vs. the 39 OTUs shared between the product and controls), and treated samples shared a larger proportion of total OTUs (30% or 50 of 167 OTUs total) with the product than controls (14% or 39 of 278 OTUs total). (c) All OTUs present in the product were ranked by their relative abundance, with the y-axis representing the average read count for each product OTU. The median rank for OTUs which showed enrichment in the control (yellow circles; n = 39) or treated roots (green circles; n = 50) was calculated and is displayed with yellow and green dashed lines, respectively; the median rank for all OTUs in the product with no enrichment (light blue circles; n = 550) is shown by the blue dashed line. This demonstrates that the median rank abundance in the product was roughly 1.5x higher in treated roots than that for OTUs enriched in controls.

References

    1. Flowers TJ, Yeo AR. Breeding for salinity resistance in crop plants: where next? Funct. Plant Biol. 1995;22:875–884. doi: 10.1071/PP9950875. - DOI
    1. Dos Reis SP, Lima AM, de Souza CRB. Recent molecular advances on downstream plant responses to abiotic stress. Int. J. Mol. Sci. 2012;13:8628–8647. doi: 10.3390/ijms13078628. - DOI - PMC - PubMed
    1. Onaga, G. & Wydra, K. Advances in plant tolerance to abiotic stresses. In Plant Genomics (ed. Abdurakhmonov, I. Y.) (InTech, 2016).
    1. Savary S, Ficke A, Aubertot J-N, Hollier C. Crop losses due to diseases and their implications for global food production losses and food security. Food Security. 2012;4:519–537. doi: 10.1007/s12571-012-0200-5. - DOI
    1. Carroll, C., Carter, C., Goodhue, R. & Lawell, C.-Y. C. L. Crop disease and agricultural productivity, 10.3386/w23513 (National Bureau of Economic Research, 2017).

Publication types