. 2019 Nov 27;9(1):17714.
doi: 10.1038/s41598-019-53721-1.

Plasma lipid profiles discriminate bacterial from viral infection in febrile children

Collaborators, Affiliations

Plasma lipid profiles discriminate bacterial from viral infection in febrile children

Xinzhu Wang et al. Sci Rep. .

Abstract

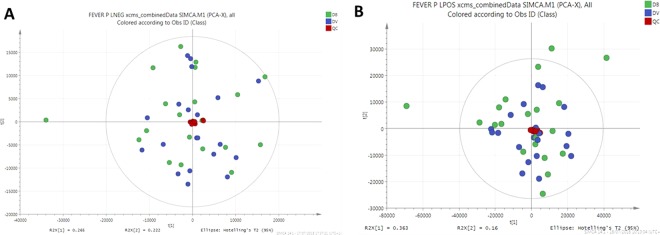
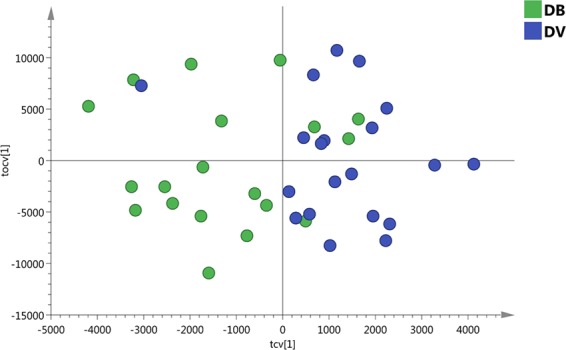
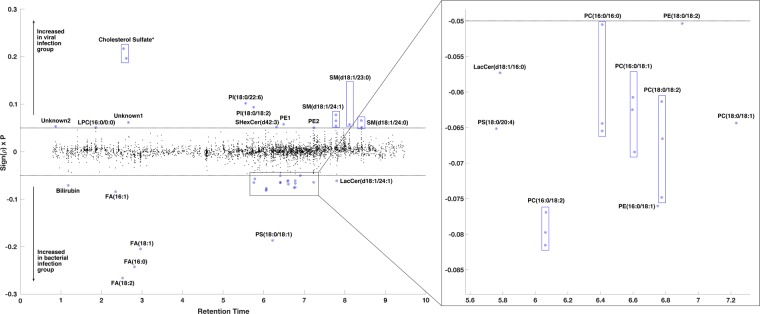
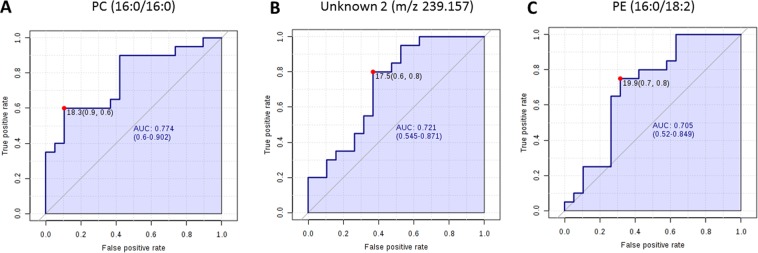
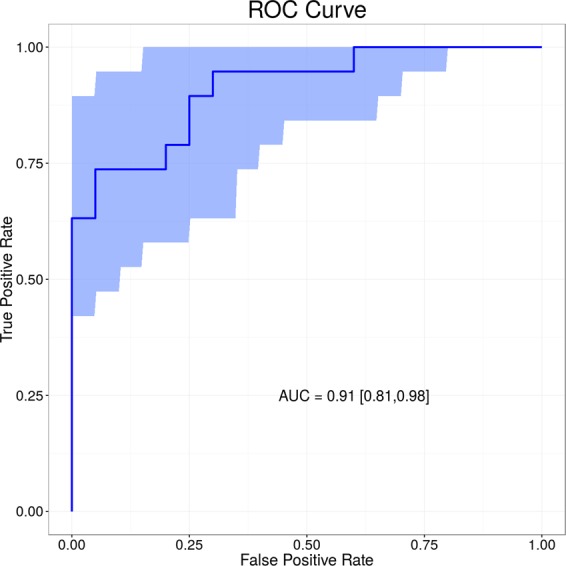
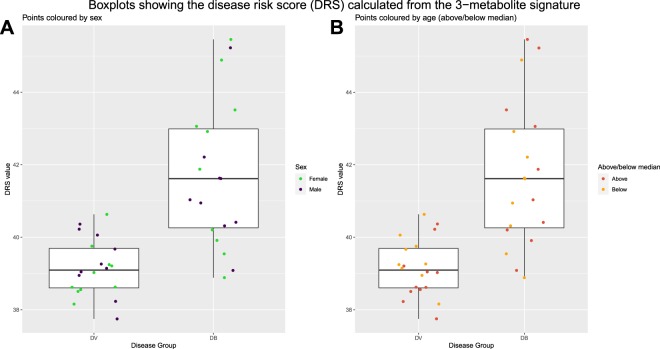
Fever is the most common reason that children present to Emergency Departments. Clinical signs and symptoms suggestive of bacterial infection are often non-specific, and there is no definitive test for the accurate diagnosis of infection. The 'omics' approaches to identifying biomarkers from the host-response to bacterial infection are promising. In this study, lipidomic analysis was carried out with plasma samples obtained from febrile children with confirmed bacterial infection (n = 20) and confirmed viral infection (n = 20). We show for the first time that bacterial and viral infection produces distinct profile in the host lipidome. Some species of glycerophosphoinositol, sphingomyelin, lysophosphatidylcholine and cholesterol sulfate were higher in the confirmed virus infected group, while some species of fatty acids, glycerophosphocholine, glycerophosphoserine, lactosylceramide and bilirubin were lower in the confirmed virus infected group when compared with confirmed bacterial infected group. A combination of three lipids achieved an area under the receiver operating characteristic (ROC) curve of 0.911 (95% CI 0.81 to 0.98). This pilot study demonstrates the potential of metabolic biomarkers to assist clinicians in distinguishing bacterial from viral infection in febrile children, to facilitate effective clinical management and to the limit inappropriate use of antibiotics.


Conflict of interest statement

Michiel Van der Flier received CSL Behring Grant for in vitro testing novel antibody preparation and Shire grant for Quality improvement PID outpatient clinic, also has Thermo Fisher Educational event speaker honorarium. Andrew J Pollard chairs the UK department of Health and Social Care’s (DHCSC) Joint Committee on Vaccination and Immunisation and the EMA Scientific Advisory Group on vaccines, and he is a member of WHO’s Strategic Advisory Group of Experts. The views expressed in the publication are those of the author(s) and not necessarily those of the DHSC, NIHR or WHO. Other authors declare no potential conflict of interest.

Figures

Figure 1
Figure 1
Principal components analysis (PCA) of lipidomics dataset. (A) Scatter plot of PCA model from data acquired in negative polarity mode. (B) Scatter plot of PCA model from data acquired in positive polarity mode. Quality control samples are shown in red, bacterial infected samples are shown in blue and viral infected samples shown in green.
Figure 2
Figure 2
The scatter plot of the cross-validated score vectors showing the clustering of definitive bacterial infected samples (green dots) from definitive viral infected samples (blue dots).
Figure 3
Figure 3
Manhattan-style plot of the 3891 lipid features detected by lipid-positive mode UPLC-MS with 40 features showing a significant association with infection type (as determined by model S-plot) highlighted and annotated. Y axis Sign(p) x P is the loadings of the OPLS-DA (i.e. modelled covariance p[1]). *Cholesterol sulfate – isomers due to different position of the sulfate.
Figure 4
Figure 4
Receiver operator characteristic (ROC) analysis based on single lipids. ROC curve analysis of top 3 lipids PC (16:0/16:0) (A), unknown feature (m/z 239.157) (B) and PE (16:0/18:2) (C) which gave with highest Area Under the Curve (AUC) values.
Figure 5
Figure 5
Receiver operator characteristic (ROC) analysis based on 3-lipid signature. A combination of SHexCer(d42:3), PC (16:0/16:0) and LacCer(d18:1/24:1) achieved AUC of 0.911 (CI 95% 0.81–0.98).
Figure 6
Figure 6
Boxplots comparing the Disease Risk Score (DRS) for definitive bacterial and definitive viral samples. The DRS was calculated using abundance values from the 3-metabolite signature identified by FS-PLS. Plot A shows points coloured according to the sex of the sample and plot B shows points coloured according to whether the sample was above or below the median age (9 months).

Similar articles

Cited by

References

    1. Hay AD, Heron J, Ness A. The prevalence of symptoms and consultations in pre-school children in the Avon Longitudinal Study of Parents and Children (ALSPAC): a prospective cohort study. Fam. Pract. 2005;22:367–374. doi: 10.1093/fampra/cmi035. - DOI - PubMed
    1. Alpern ER, et al. Epidemiology of a Pediatric Emergency Medicine Research Network. Pediatr. Emerg. Care. 2006;22:689–699. doi: 10.1097/01.pec.0000236830.39194.c0. - DOI - PubMed
    1. Hsiao AL, et al. Incidence and predictors of serious bacterial infections among 57- to 180-day-old infants. Pediatrics. 2006;117:1695–701. doi: 10.1542/peds.2005-1673. - DOI - PubMed
    1. Craig JC, et al. The accuracy of clinical symptoms and signs for the diagnosis of serious bacterial infection in young febrile children: prospective cohort study of 15 781 febrile illnesses. BMJ. 2010;340:c1594. doi: 10.1136/bmj.c1594. - DOI - PMC - PubMed
    1. Nijman RG, et al. Clinical prediction model to aid emergency doctors managing febrile children at risk of serious bacterial infections: diagnostic study. BMJ. 2013;346:f1706. doi: 10.1136/bmj.f1706. - DOI - PMC - PubMed

Publication types