. 2019 Dec;576(7785):143-148.
doi: 10.1038/s41586-019-1785-z. Epub 2019 Nov 27.

Bile acid metabolites control TH17 and Treg cell differentiation

Affiliations

Bile acid metabolites control TH17 and Treg cell differentiation

Saiyu Hang et al. Nature. 2019 Dec.

Erratum in

Abstract

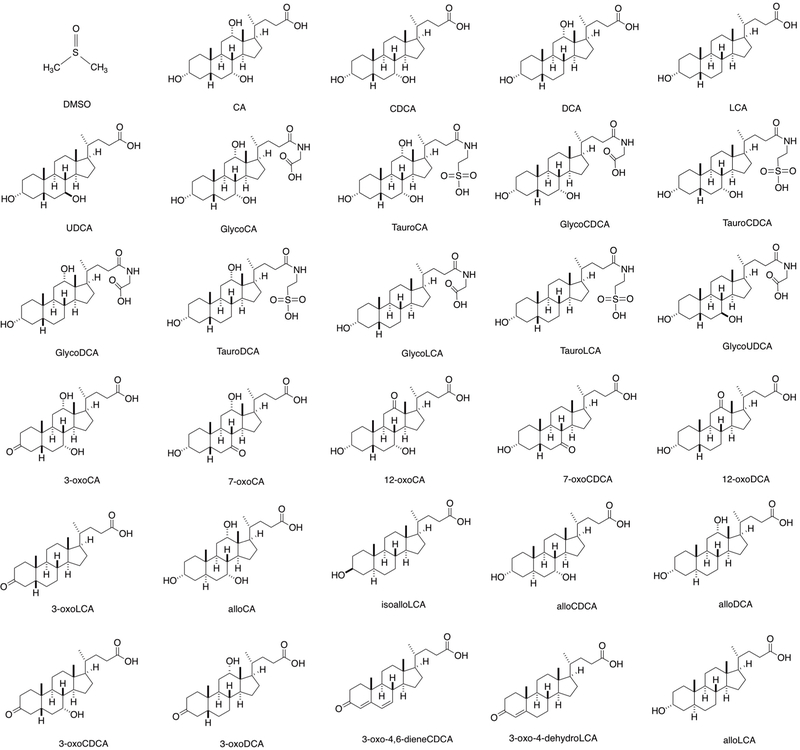
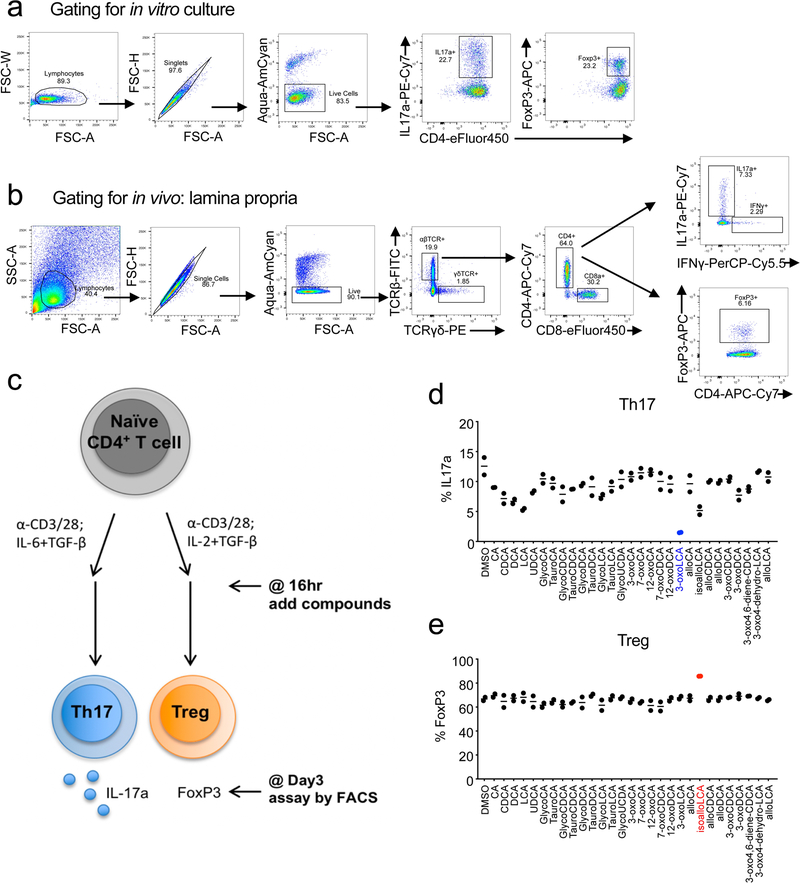
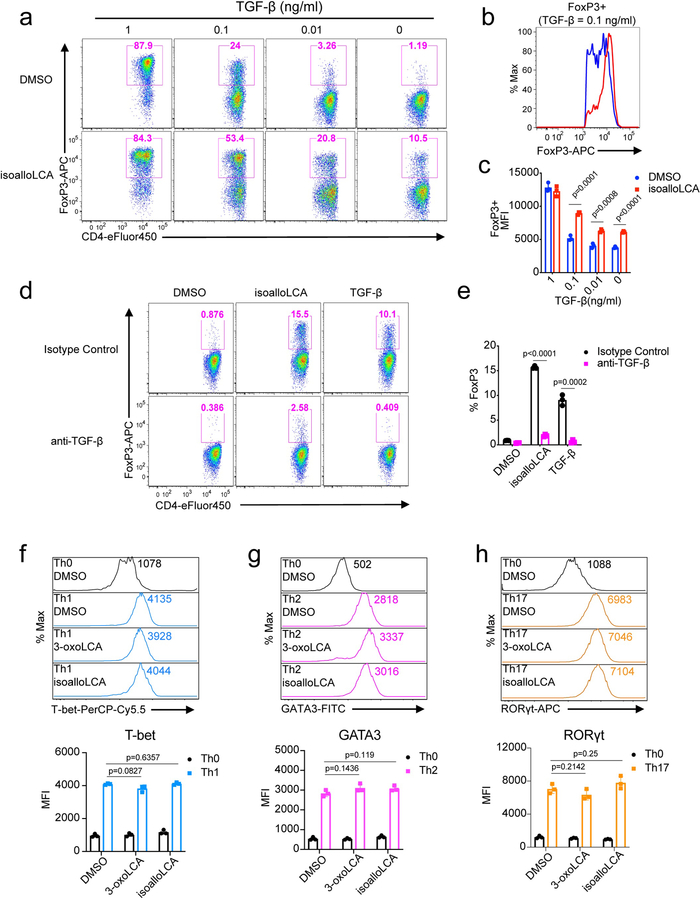
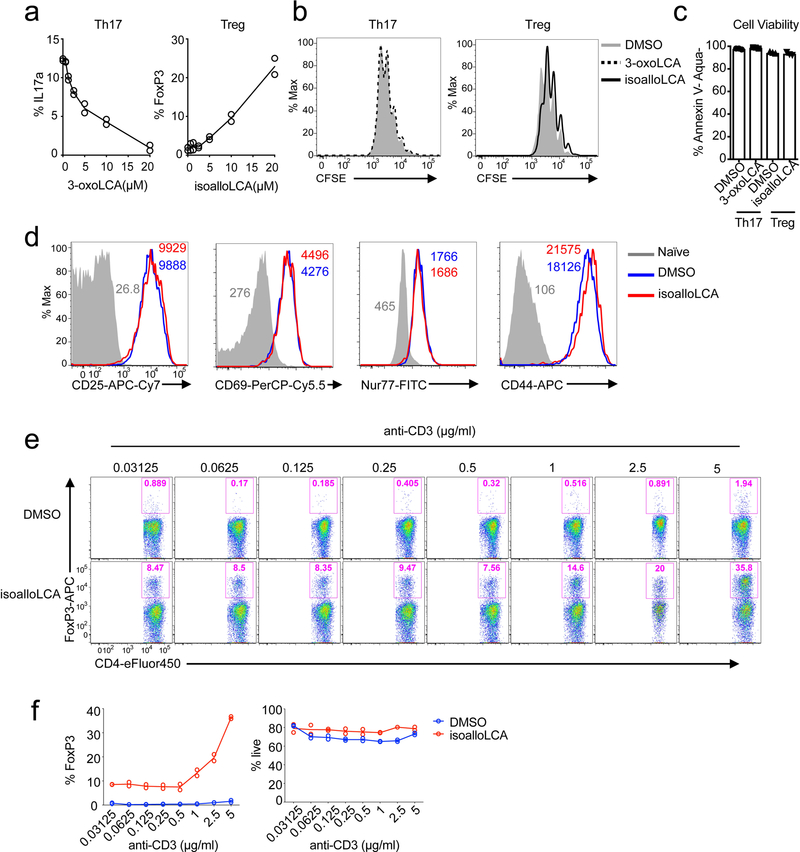
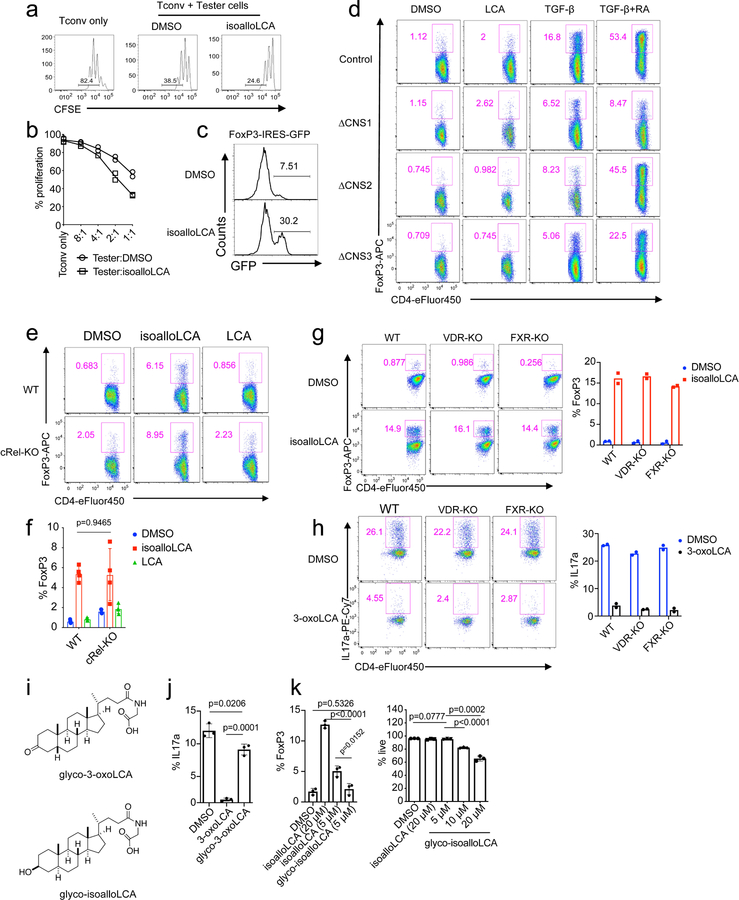
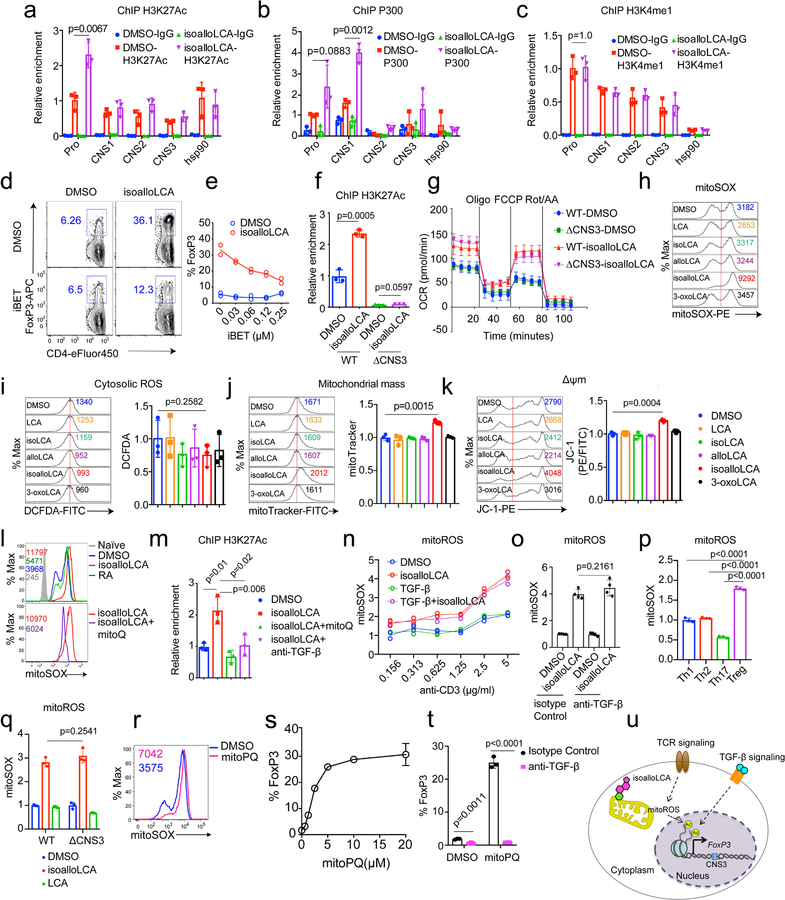
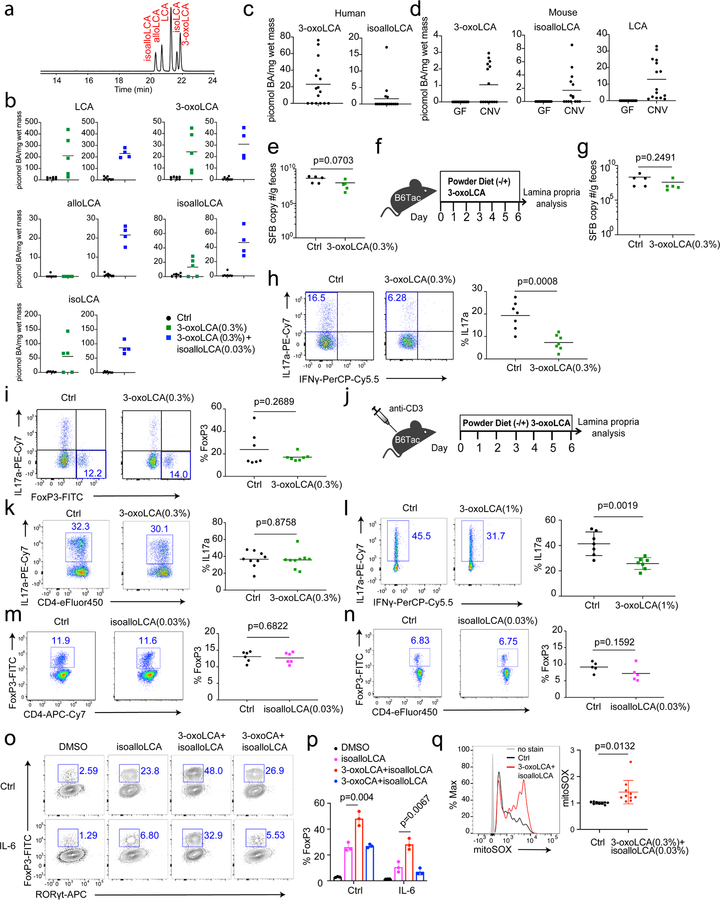
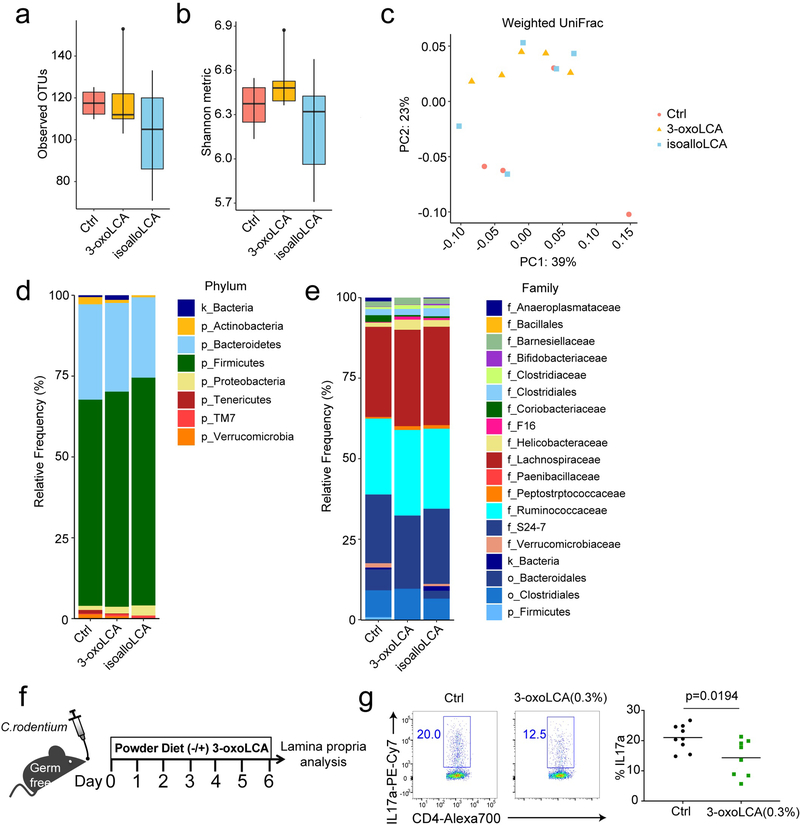
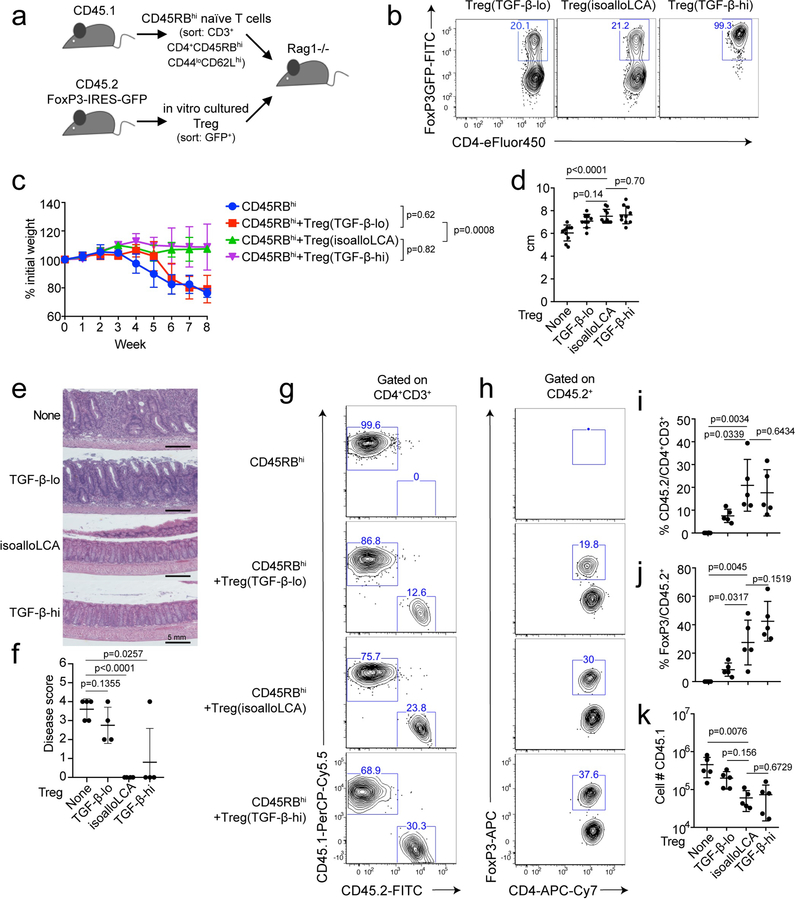
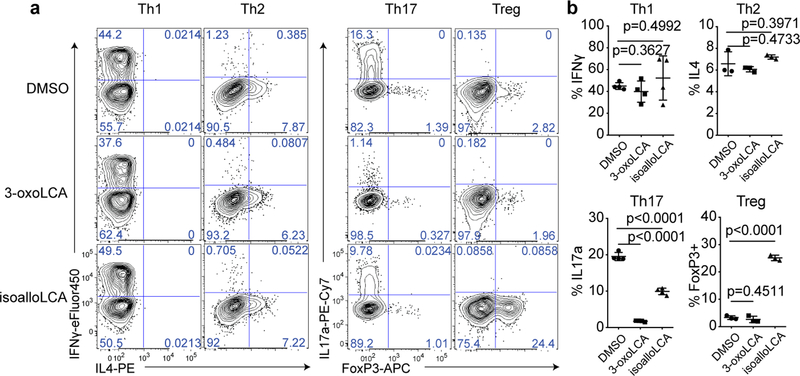
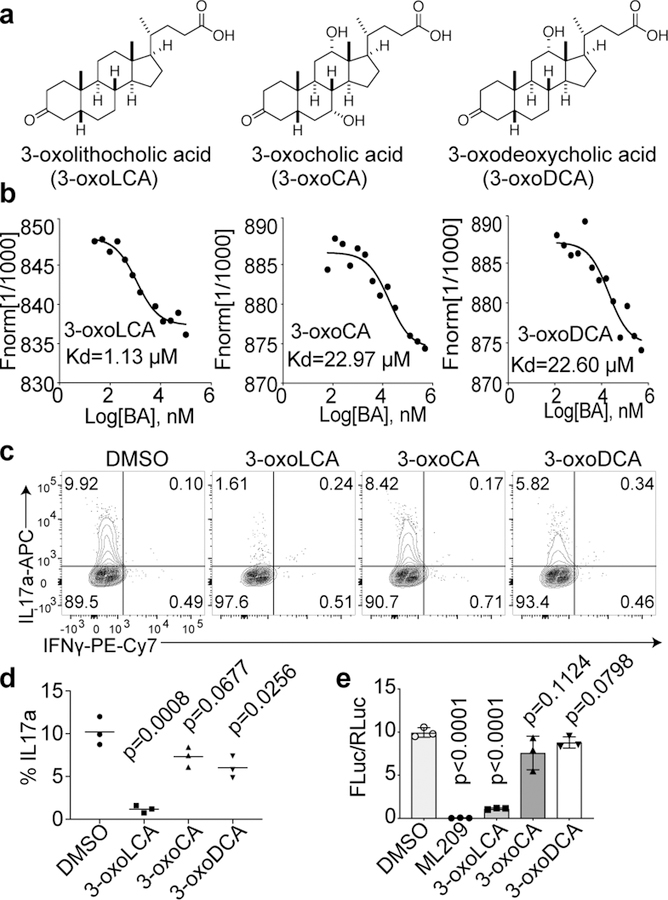
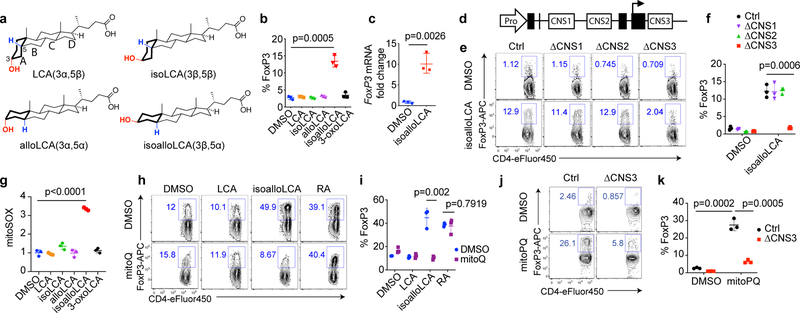
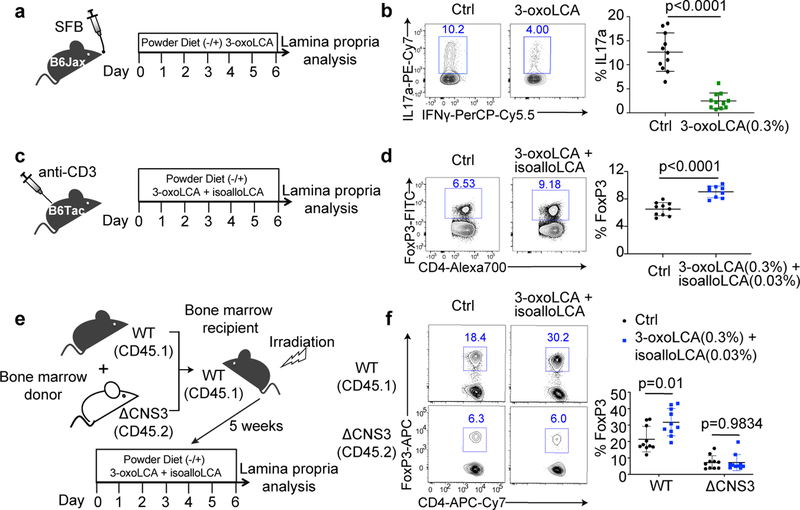
Bile acids are abundant in the mammalian gut, where they undergo bacteria-mediated transformation to generate a large pool of bioactive molecules. Although bile acids are known to affect host metabolism, cancer progression and innate immunity, it is unknown whether they affect adaptive immune cells such as T helper cells that express IL-17a (TH17 cells) or regulatory T cells (Treg cells). Here we screen a library of bile acid metabolites and identify two distinct derivatives of lithocholic acid (LCA), 3-oxoLCA and isoalloLCA, as T cell regulators in mice. 3-OxoLCA inhibited the differentiation of TH17 cells by directly binding to the key transcription factor retinoid-related orphan receptor-γt (RORγt) and isoalloLCA increased the differentiation of Treg cells through the production of mitochondrial reactive oxygen species (mitoROS), which led to increased expression of FOXP3. The isoalloLCA-mediated enhancement of Treg cell differentiation required an intronic Foxp3 enhancer, the conserved noncoding sequence (CNS) 3; this represents a mode of action distinct from that of previously identified metabolites that increase Treg cell differentiation, which require CNS1. The administration of 3-oxoLCA and isoalloLCA to mice reduced TH17 cell differentiation and increased Treg cell differentiation, respectively, in the intestinal lamina propria. Our data suggest mechanisms through which bile acid metabolites control host immune responses, by directly modulating the balance of TH17 and Treg cells.


Conflict of interest statement

Conflict of Interest

A.S.D is an ad hoc consultant for Kintai Therapeutics. D.R.L. is a scientific co-founder of Vedanta Biosciences.

Figures

Extended Data Figure 1.
Extended Data Figure 1.. Chemical structures of bile acid derivatives used for T cell differentiation assay.
Extended Data Figure 2.
Extended Data Figure 2.. 3-oxoLCA and isoalloLCA affect Th17 and Treg differentiation.
a and b, Gating strategy for the flow cytometric analyses of in vitro cultured T cells (a) and in vivo derived cells from the lamina propria (b). c, Schematic of the screening procedure. d and e, Naïve CD4+ T cells isolated from B6 mice (n = 2) were cultured under Th17 (IL-6 = 10 ng/ml; TGF-β = 0.5 ng/ml) (d) and Treg (IL-2 = 100 U/ml; TGF-β = 0.1 ng/ml) (e) polarization conditions for 3 days. DMSO or various bile acids at 20 μM concentration were added to the cell cultures on day 1. n, number of biologically independent samples. Data are shown as the mean.
Extended Data Figure 3.
Extended Data Figure 3.. isoalloLCA-induced Treg expansion requires TGF-β.
a-c, Flow cytometry and histogram of CD4+ T cells, cultured for 3 days with different amounts of TGF-β (1, 0.1, 0.01 or 0 ng/ml) and IL-2 (100 U/ml) in the presence of DMSO or isoalloLCA (20 μM) and intracellularly stained for FoxP3 (n = 3/group). d and e, Flow cytometry of CD4+ T cells, cultured for 3 days in the presence of DMSO, isoalloLCA (20 μM) or TGF-β (0.05 ng/ml). In addition, anti-TGF-β antibody (10 μg/ml, 1D11) or isotype control were added to the culture (n = 3/group). fh, 3-oxoLCA and isoalloLCA do not affect key transcription factor expression. T cells were cultured under Th0, Th1, Th2 or Th17 conditions, in the presence of DMSO, 3-oxoLCA (20 μM) or isoalloLCA (20 μM). T cell lineage determining transcription factors such as T-bet, GATA3 or RORγt were intracellularly stained (n = 3/group). MFI denotes mean fluorescence intensity. n, number of biologically independent samples. Data are shown as the mean ± standard deviation by unpaired t-test with 2-tailed p-value.
Extended Data Figure 4.
Extended Data Figure 4.. Effects of isoalloLCA on FoxP3 expression require strong TCR stimulation.
a, 3-oxoLCA and isoalloLCA demonstrate dose-dependent effects on Th17 cell and Treg differentiation, respectively (n = 2). A low concentration of TGF-β (0.01 ng/ml) was used for Treg culture. bd, 3-oxoLCA and isoalloLCA do not significantly affect cell proliferation, cell viability, or T cell activation. b, Naïve CD4+ T cells were labeled with a cell proliferation dye CFSE and cultured for 3 days in the presence of DMSO, 3-oxoLCA or isoalloLCA under Th17 or Treg polarization conditions. c, Live cell percentages at the end of the 3-day culture were determined based on both Annexin V and fixable live/dead staining (n = 3/group). d, Both DMSO and isoalloLCA treatment lead to comparable levels of expression of CD25, CD69, Nur77 and CD44. Naïve CD4+ T cells were used as a negative control. e and f, T cells were cultured with different concentrations of anti-CD3 antibody, in the presence of DMSO or isoalloLCA (20 μM). Representative FACS plots of CD4+ T cells cultured for 3 days and stained intracellularly for FoxP3 (e). Quantification of FoxP3+ and viable T cells after 3-day culture (f) (n = 2/group). n, number of biologically independent samples. Data are representative of two independent experiments (b, d). Data in (c) are shown as the mean ± standard deviation.
Extended Data Figure 5.
Extended Data Figure 5.. cRel, VDR and FXR are dispensable for isoalloLCA-dependent induction of FoxP3.
a and b, In vitro suppression assay. CD4+ effector T cells were labeled with CFSE and mixed with DMSO- or isoalloLCA-treated Treg cells at different ratios of Tconv: Tester cells (n = 2/group). c, Expression of GFP in DMSO- or isoalloLCA-treated T cells cultured with anti-CD3/28, IL-2 and TGF-β (0.01 ng/ml). Naïve CD4+ T cells were isolated from FoxP3-IRES-GFP mice. d, Flow cytometry of CD4+ T cells stained intracellularly for FoxP3. Naïve CD4+ T cells isolated from WT, CNS1, CNS2 or CNS3 knockout mice (n = 3/group) were cultured with anti-CD3/28 and IL-2, LCA (20 μM), TGF-β (0.05 ng/ml) and additional retinoic acid (RA; 1 ng/ml). e and f, Flow cytometry (e) and its quantification (f) of CD4+ T cells stained intracellularly for FoxP3. Naïve CD4+ T cells were isolated from WT control mice or cRel-KO mice (n = 4/group) and cultured with anti-CD3/28 and IL-2 in the presence of DMSO, isoalloLCA (20 μM) or LCA (20 μM). g and h, Naïve CD4+ T cells isolated from WT control, VDR knockout or FXR knockout (n = mice/group) were cultured with anti-CD3/28 and IL-2 (g) or anti-CD3/28, IL-6 and TGF-β (h) for 3 days in the presence of DMSO, isoalloLCA (20 μM), or 3-oxoLCA (20 μM). Representative FACS plots of T cells intracellularly stained for FoxP3 or IL-17a. i, Chemical structures of glycine conjugated 3-oxoLCA (glyco-3-oxoLCA) and isoalloLCA (glyco-isoalloLCA). j and k, Quantifications of Th17 (j) and Treg (k) differentiation in vitro. T cells were cultured with anti-CD3/28, IL-6 and TGF-β (j) or anti-CD3/28 and IL-2 (k) in the presence of DMSO, 3-oxoLCA (20 μM), glyco-3-oxoLCA (20 μM), isoalloLCA (5 or 20 μM) or glyco-isoalloLCA (5, 10, or 20 μM). Glyco-isoalloLCA exhibited enhanced cytotoxicity at 10 or 20 μM compared to isoalloLCA (n = 3/group). n, number of biologically independent samples. Data are representative of two independent experiments (c, d). Data are shown as the mean ± standard deviation by unpaired t-test with 2-tailed p-value.
Extended Data Figure 6.
Extended Data Figure 6.. IsoalloLCA-dependent FoxP3 transcription requires mitochondrial ROS and H3K27Ac.
ac, ChIP analysis of H3K27Ac, P300 and H3K4me1 on FoxP3 gene locus. Chromatin obtained from DMSO- and isoalloLCA-treated WT cells was immunoprecipitated with IgG, anti-H3K27Ac, anti-P300, or anti-H3K4me1 antibodies, followed by real-time PCR analysis (n = 3/group). Primers targeting FoxP3 promoter (Pro), CNS1, CNS2 and CNS3 region and hsp90 promoter were used for qPCR quantification. Relative enrichment was calculated as fold change relative to the ChIP signal at the FoxP3 promoter of the DMSO-treated control. d and e, Flow cytometry and quantification of CD4+ T cells stained intracellularly for FoxP3. Naïve CD4+ T cells isolated from WT mice (n = 2/group) were cultured with anti-CD3/28, IL-2 and TGF-β (0.05 ng/mL) in the presence of DMSO or isoalloLCA (20 μM) in the presence or absence of iBET. f, ChIP analysis of H3K27Ac on the FoxP3 promoter region. Naïve CD4+ T cells isolated from WT or CNS3 knockout mice (n = 3/group) were treated with DMSO or isoalloLCA (20 μM). g, Seahorse analysis of OCR with naïve CD4+ T cells isolated from WT or CNS3 knockout mice cultured with anti-CD3/28 and IL-2 for 48h, in the presence of DMSO or isoalloLCA (20 μM). Measurements from six wells from two mice for each genotype. hk, T cells were cultured with DMSO, LCA, isoLCA, alloLCA, isoalloLCA or 3-oxoLCA at 20 μM for 48h. Their mitochondrial and cytoplasmic ROS were measured by mitoSOX (h) and 2’,7’-dichlorofluorescein diacetate (DCFDA) (i), respectively. Total mitochondria mass was measured by MitoTracker (j) and the mitochondrial membrane potential measured by JC-1 dye (k). MFIs of different treatments were normalized as fold changes to those of DMSO control (n = 3/group). l, Mitochondria ROS production measured by mitoSOX with T cells cultured with DMSO, isoalloLCA (20 μM), retinoic acid (RA, 1 nM), or isoalloLCA (20 μM) + mitoQ (0.5 μM) for 48h. m, ChIP analysis (n = 3/group) of H3K27Ac on the FoxP3 promoter of T cells, treated with DMSO, isoalloLCA, isoalloLCA+mitoQ, or isoalloLCA+anti-TGF-β for 72 h. nq, Mitochondrial ROS production measured by mitoSOX with T cells cultured with different concentrations of anti-CD3 and treated with DMSO, isoalloLCA (20 μM), TGF-β (0.05 ng/ml), or isoalloLCA plus TGF-β (n = 2/group) (n); or with T cells treated with DMSO or isoalloLCA (20 μM) plus an isotype control or anti-TGF-β antibody (n = 4/group) (o); or with T cells cultured under Th1, Th2, Th17 or Treg conditions (n = 3/group) (p); or with naïve CD4+ T cells isolated from WT or CNS3 knockout mice and cultured with anti-CD3/28 and IL-2 (n = 3/group) (q). r, Mitochondria ROS production measured by mitoSOX with T cells cultured with DMSO or mitoPQ (5 μM) for 48h. s, Dose-dependent effects of mitoPQ on Treg differentiation (n = 3). t, Quantification of Treg differentiation in vitro on naïve CD4+ T cells cultured in the presence of DMSO or mitoPQ (5 µM) and treated with isotype control or anti-TGF-β antibody (n = 3/group). u, A model showing the mechanism of isoalloLCA enhancement of Treg differentiation. n, number of biologically independent samples. Data are representative of two independent experiments (l, r) and shown as the mean ± standard deviation by unpaired t-test with 2-tailed p-value.
Extended Data Figure 7.
Extended Data Figure 7.. 3-oxoLCA inhibits the differentiation of Th17 cells but not Tregs, and isoalloLCA alone does not enhance Treg differentiation in vivo.
a, UPLC/MS spectra of LCA and its isomers isoalloLCA, alloLCA, and isoLCA as well as 3-oxoLCA. b, Quantification of unconjugated LCA and its derivatives in the cecal contents of B6 mice fed on a control or bile acid-containing diet (n = 7/5/4 mice for Ctrl/3-oxoLCA/3-oxoLCA+isoalloLCA). c, Quantification of unconjugated 3-oxoLCA and isoalloLCA in human stool samples from patients with ulcerative colitis (n = 16 donors). d, Quantification of unconjugated 3-oxoLCA, isoalloLCA and LCA in mouse cecal contents from germ-free (GF) or conventionally housed (CNV) mice (n = 15 mice/group). e, B6 Jax mice gavaged with SFB. SFB colonization measured by qPCR analysis calculated as copy number (n = 5 mice/group). f, Diagram showing experimental design. B6 Taconic mice were fed a 3-oxoLCA (0.3%) containing diet for 7 days. g, SFB colonization measured by qPCR analysis calculated as SFB copy number (n = 5 mice/group). h and i, Flow cytometric analysis and quantification of Th17 (h) and Treg (i) cells of the ileal lamina propria (n = 7 mice/group). jl, Experimental scheme of anti-CD3 experiment with 3-oxoLCA (j). Flow cytometric analysis and quantification of CD4+ cells of the lamina propria following an anti-CD3 injection from B6 mice fed with control or 3-oxoLCA (0.3%) diet (n = 9 mice/group) (k), or 3-oxoLCA (1%) diet (n = 7 mice/group) (l). m and n, Flow cytometric analysis and quantification of CD4+ cells of the ileal lamina propria in steady-state (m) (n = 6 mice/group) or following an anti-CD3 injection (n) (n = 5 mice/group). B6 mice were fed with control or isoalloLCA (0.03%) diet. o and p, Flow cytometry (o) and quantification (p) of CD4+ T cells stained intracellularly for FoxP3 showing that the combination of 3-oxoLCA and isoalloLCA further increases Treg cell differentiation. Naïve CD4+ T cells isolated from WT B6 mice (n = 3 biologically independent samples) treated with DMSO, isoalloLCA (20 µM), a mixture of 3-oxoLCA (20 µM) and isoalloLCA (20 µM), or a mixture of 3-oxoCA (20 µM) and isoalloLCA (20 µM) and cultured with anti-CD3/28 and IL-2, with or without addition of IL-6 (62.5 pg/ml). q, mitoROS production in total CD4+ T cells isolated from the ileal lamina propria. Mice were fed a control diet or diet containing a mixture of 3-oxoLCA (0.3%) + isoalloLCA (0.03%) (n = 9, 10 mice) and injected with 10 µg of anti-CD3 to induce inflammation. Data are shown as the mean ± standard deviation by unpaired t-test with 2-tailed p-value.
Extended Data Figure 8.
Extended Data Figure 8.. 3-oxoLCA or isoalloLCA does not significantly alter gut microbiota.
a, Box plot showing operational taxonomic unit (OTU) numbers. b, Shannon diversity of fecal microbiota based on 16S rRNA gene amplicon sequencing. For the box plots (a, b), the three horizontal lines of the box represent the third quartile, median and first quartile, respectively from top to bottom. The whiskers above and below the box show the maximum and minimum. c, Principal coordinates analysis (PCoA) based on weighted UniFrac distances of 16S rRNA amplicon sequencing of fecal microbiota. d and e, Average relative abundance of microbiota at the phylum (d) and the family (e) levels by taxon-based analyses (n = 4, 5, 5 mice for Ctrl, 3-oxoLCA, isoalloLCA group). f and g, Experimental scheme (f) and flow cytometric analysis and quantification (g) of CD4+ cells of the colon lamina propria in germ-free B6 mice, infected with Citrobacter rodentium. Mice were fed an autoclaved diet with or without 3-oxoLCA (0.3%) (n = 9 mice/group). Data are shown as the mean ± standard deviation by unpaired t-test with 2-tailed p-value.
Extended Data Figure 9.
Extended Data Figure 9.. IsoalloLCA-induced Treg cells suppress transfer colitis.
a, Experimental scheme. Rag1−/− recipient mice were transferred intraperitoneally with 0.5 million CD45RBhi naïve CD4+ T cells (CD45.1) and with or without co-transfer of 0.5 million FoxP3-GFP+ Treg cells (CD45.2). FoxP3-GFP+ cells were cultured under TGF-β-lo (0.05 ng/ml), isoalloLCA (20 µM, 0.01 ng/ml TGF-β) and TGF-β-hi (1 ng/ml) conditions with GFP naïve CD4 T cells, isolated from CD45.2 FoxP3-IRES-GFP mice. b, Flow cytometric analysis of the FoxP3-GFP+ cells following in vitro culture. The gated cells were sorted and used for co-transfer. c-f, Weight change monitored for eight weeks, week 7 values are used for unpaired t-test with two-tailed p-value (c) (n = 5 mice/group). At the end of the experiment, colon length (d) (n = 10 mice/group), H&E staining (e) and the quantification of disease score (f) (n = 5 mice for None, 4 mice for other groups). gj, Flow cytometric analysis and quantification of the frequency of CD45.1 and CD45.2 (g, i) and the frequency of FoxP3+ cells in the CD45.2 population (h, j) in each condition (n = 5 mice/group). k, Quantification of total CD45.1 cell number in the colon lamina propria (n = 5 mice/group). Data are shown as the mean ± standard deviation by unpaired t-test with 2-tailed p-value.
Figure 1.
Figure 1.. 3-oxoLCA inhibits Th17 cell differentiation while isoalloLCA enhances Treg differentiation.
a and b, Flow cytometry and its quantification of intracellular staining for IFN-γ and IL-4 or IL-17a and FoxP3 in sorted naïve T cells from wild-type B6 mice activated and expanded in the presence of mouse Th1, Th2, Th17 and Treg polarizing cytokines (n = 4, 3, 4, 3). A low concentration of TGF-β (0.01 ng/ml) was used for Treg culture. DMSO, 3-oxoLCA (20 μM) or isoalloLCA (20 μM) was added on day 0 and CD4+ T cells were gated for analyses on day 3 for Th17 and Treg, day 5 for Th1 and Th2. n, number of biologically independent samples. Data are shown as the mean ± standard deviation by unpaired t-test with 2-tailed p-value.
Figure 2.
Figure 2.. 3-oxoLCA binds to RORγt and inhibits its transcriptional activity.
a, Chemical structures of 3-oxoLCA, 3-oxocholic acid (3-oxoCA) and 3-oxodeoxycholic acid (3-oxoDCA). b, Microscale thermophoresis assay. 3-oxoLCA binds to RORγt LBD at a much lower Kd value than the other two structurally similar bile acids. c and d, Flow cytometric analyses and quantification of IL-17a production from mouse (n = 3/group), naïve CD4+ T cells cultured for 3 days under Th17 polarization condition. DMSO or bile acids at 20 μM were added 18h after cytokine addition. e, RORγt luciferase reporter assay in HEK293 cells treated with a positive control ML209 (2 μM), 3-oxoLCA (10 μM), 3-oxoCA (10 μM), 3-oxoDCA (10 μM), or DMSO. The ratio of firefly to Renilla luciferase activity is presented on the y-axis (n = 3/group). n, number of biologically independent samples. Data are shown as the mean ± standard deviation by unpaired t-test with 2-tailed p-value.
Figure 3.
Figure 3.. mitoROS is necessary and sufficient for isoalloLCA-dependent enhanced expression of FoxP3.
a, Chemical structures of LCA and its isomers: isoLCA, alloLCA and isoalloLCA. b, FoxP3 expression from mouse naïve CD4+ T cells cultured for 3 days with anti-CD3/28 and IL-2. DMSO or bile acids at 20 μM were added to cell culture (n = 3/group). c, qPCR analysis for FoxP3 transcripts in DMSO- or isoalloLCA- (20 μM) treated cells (n = 3/group). d, Diagram of the FoxP3 gene locus containing the promoter region (Pro) and intronic enhancer regions (CNS1, CNS2 and CNS3). e and f, Flow cytometric analyses and quantification of CD4+ T cells stained intracellularly for FoxP3. Naïve CD4+ T cells isolated from wild-type control, CNS1, CNS2 or CNS3 knockout mice were cultured with anti-CD3/28 and IL-2, in the presence of DMSO or isoalloLCA (20 μM) (n = 3/group). g, Mitochondrial ROS production measured by mitoSOX staining with T cells cultured in the presence of DMSO or LCA isomers for 48h. Staining intensity was reported as mean fluorescence intensity from flow cytometry analysis (PE channel). Different conditions were then normalized as fold change to the values of DMSO condition (n = 3/group). h and i, Representative FACS plots and quantification of T cells stained intracellularly for FoxP3, cultured with anti-CD3/28, IL-2 and TGF-β (0.05 ng/ml) in the presence of DMSO, LCA, isoalloLCA (20 μM) or retinoic acid (1 nM), with DMSO or mitoQ (0.5 μM) for 72 h (n = 3/group). j and k, Flow cytometric analyses and quantification of CD4+ T cells stained intracellularly for FoxP3. Naïve CD4+ T cells isolated from control or CNS3 knockout mice were cultured with anti-CD3/28 and IL-2 in the presence of DMSO or mitoPQ (10 μM) (n = 3/group). n, number of biologically independent samples. Data are shown as the mean ± standard deviation by unpaired t-test with 2-tailed p-value.
Figure 4.
Figure 4.. 3-oxoLCA inhibits Th17 development while isoalloLCA enhances Treg cells in vivo
a and b, Experimental scheme (a) and flow cytometric analysis (b) of Th17 induction by SFB. Jax-B6 animals were gavaged with SFB-rich fecal pellets and kept on 3-oxoLCA (0.3%) for a week (n = 11 mice/group). c and d, Experimental scheme (c) and flow cytometric analysis (d) of anti-CD3 experiment with a mixture of 3-oxoLCA + isoalloLCA (n = 10/9 mice for Ctrl/3-oxoLCA+isoalloLCA). B6 animals were i.p. injected with anti-CD3 and fed a control diet or mixture of 3-oxoLCA (0.3%) + isoalloLCA (0.03%) during the experiments. e and f, Experimental scheme (e) and flow cytometric analysis (f) of T cells isolated from the ileal lamina propria. Bone marrow cells from WT (CD45.1) and ΔCNS3 (CD45.2) mice were mixed at a 1:1 ratio and transferred into irradiated WT (CD45.1) recipient mice. Five weeks after the transfer, recipient mice were fed a control diet or a diet containing a mixture of 3-oxoLCA (0.3%) + isoalloLCA (0.03%), followed by an anti-CD3 injection (n = 10 mice/group). Data shown as the mean ± standard deviation by unpaired t-test with 2-tailed p-value.

References

    1. Shapiro H, Kolodziejczyk AA, Halstuch D & Elinav E Bile acids in glucose metabolism in health and disease. J Exp Med 215, 383–396, doi:10.1084/jem.20171965 (2018). - DOI - PMC - PubMed
    1. Ridlon JM, Kang DJ & Hylemon PB Bile salt biotransformations by human intestinal bacteria. J Lipid Res 47, 241–259, doi:10.1194/jlr.R500013-JLR200 (2006). - DOI - PubMed
    1. Devlin AS & Fischbach MA A biosynthetic pathway for a prominent class of microbiota-derived bile acids. Nat Chem Biol 11, 685–690, doi:10.1038/nchembio.1864 (2015). - DOI - PMC - PubMed
    1. Hamilton JP et al. Human cecal bile acids: concentration and spectrum. Am J Physiol Gastrointest Liver Physiol 293, G256–263, doi:10.1152/ajpgi.00027.2007 (2007). - DOI - PubMed
    1. Bernstein H, Bernstein C, Payne CM & Dvorak K Bile acids as endogenous etiologic agents in gastrointestinal cancer. World J Gastroenterol 15, 3329–3340 (2009). - PMC - PubMed

Publication types

MeSH terms