. 2019 Dec;576(7786):315-320.
doi: 10.1038/s41586-019-1795-x. Epub 2019 Nov 27.

Structure and drug resistance of the Plasmodium falciparum transporter PfCRT

Affiliations

Structure and drug resistance of the Plasmodium falciparum transporter PfCRT

Jonathan Kim et al. Nature. 2019 Dec.

Abstract

The emergence and spread of drug-resistant Plasmodium falciparum impedes global efforts to control and eliminate malaria. For decades, treatment of malaria has relied on chloroquine (CQ), a safe and affordable 4-aminoquinoline that was highly effective against intra-erythrocytic asexual blood-stage parasites, until resistance arose in Southeast Asia and South America and spread worldwide1. Clinical resistance to the chemically related current first-line combination drug piperaquine (PPQ) has now emerged regionally, reducing its efficacy2. Resistance to CQ and PPQ has been associated with distinct sets of point mutations in the P. falciparum CQ-resistance transporter PfCRT, a 49-kDa member of the drug/metabolite transporter superfamily that traverses the membrane of the acidic digestive vacuole of the parasite3-9. Here we present the structure, at 3.2 Å resolution, of the PfCRT isoform of CQ-resistant, PPQ-sensitive South American 7G8 parasites, using single-particle cryo-electron microscopy and antigen-binding fragment technology. Mutations that contribute to CQ and PPQ resistance localize primarily to moderately conserved sites on distinct helices that line a central negatively charged cavity, indicating that this cavity is the principal site of interaction with the positively charged CQ and PPQ. Binding and transport studies reveal that the 7G8 isoform binds both drugs with comparable affinities, and that these drugs are mutually competitive. The 7G8 isoform transports CQ in a membrane potential- and pH-dependent manner, consistent with an active efflux mechanism that drives CQ resistance5, but does not transport PPQ. Functional studies on the newly emerging PfCRT F145I and C350R mutations, associated with decreased PPQ susceptibility in Asia and South America, respectively6,9, reveal their ability to mediate PPQ transport in 7G8 variant proteins and to confer resistance in gene-edited parasites. Structural, functional and in silico analyses suggest that distinct mechanistic features mediate the resistance to CQ and PPQ in PfCRT variants. These data provide atomic-level insights into the molecular mechanism of this key mediator of antimalarial treatment failures.


Conflict of interest statement

Competing interests: The authors declare no competing interest.

Figures

Extended Data Figure 1
Extended Data Figure 1. Major PfCRT haplotypes and location of residues involved in chloroquine (CQ) or piperaquine (PPQ) drug resistance phenotypes.
a, Listing of the PfCRT canonical CQ-S, PPQ-S 3D7 haplotype, the CQ-R 7G8 (South America and Western Pacific) and Dd2 (Southeast Asia) haplotypes, and the 7G8+C350R and Dd2+F145I variants that have emerged in P. falciparum parasites in malaria-endemic areas and are associated with PPQ resistance. b, Localization of PfCRT mutations, based on the solved PfCRT structure. Most mutations localize within or near the boundary of one of the 10 TM helices. JM, juxtamembrane. Extended Data Table 2 provides additional information about PfCRT mutations observed in the field or obtained in drug-pressured cultured parasites.
Extended Data Figure 2
Extended Data Figure 2. Identification of PfCRT-specific antigen-binding fragments (Fab) and preparation of purified PfCRT ± Fab protein in nanodiscs.
a, Complementarity-determining region (CDR) sequences of unique antigen-binding fragments (Fabs) panned for binding to recombinant PfCRT 7G8 incorporated into MSP1D1 nanodiscs. Fabs were selected following multiple rounds of enrichment from the phage display library E,,. Enriched SYGW residues are highlighted by color code (red, yellow, green and blue, respectively) and are numbered according to the Kabat system. Tyr (Y), Ser (S), Gly (G), and Trp (W) residues, which play a dominant role in antigen recognition, are shown in yellow, red, green, or blue, respectively, and are numbered according to the Kabat system. CTC was selected to form a stable PfCRT 7G8-Fab complex. b, Single-point ELISA quantifying the binding of phage-displayed Fab to PfCRT-incorporated biotinylated nanodiscs, empty nanodiscs, or buffer (empty wells), measured at 450 nm absorbance (n=1). c, EC50 evaluation for purified Fab binding to PfCRT incorporated into biotinylated nanodiscs, showing high-affinity binding for the Fab CTC (3.7 nM). Data points show average values from independent experiments run in triplicate and error bars display the standard deviations from the means. d, High-performance liquid chromatography profile of PfCRT 7G8 ± bound Fab CTC. e, SDS-PAGE gel of pooled and concentrated size-exclusion chromatography fractions from PfCRT 7G8 ± Fab CTC. The contaminant glutamate dehydrogenase, GDH (present as a left shoulder in d), was excluded from single-particle analyses. MSP1D1 is a membrane scaffold protein used to assemble the nanodiscs. The identity of PfCRT and GDH was confirmed using mass spectrometry. f, Representative negative stain 2D class averages from Relion 2D classification of nanodisc-incorporated PfCRT without Fab. g, Representative negative stain 2D class averages from Relion 2D classification of nanodisc-incorporated PfCRT with bound CTC Fab.
Extended Data Figure 3 |
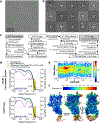
Extended Data Figure 3 |. Cryo-EM analysis of the PfCRT 7G8-Fab CTC complex.
a, Representative micrograph (0.5175 Å per pixel, 1.65 μm defocus). Exemplar picked particles contributing to the final reconstruction are circled in green. b, Representative 2D class averages from Relion 2D classification. c, Flowchart of cryo-EM data processing and refinement of the PfCRT 7G8-Fab CTC complex. See Methods for details. d, Fourier shell correlation (FSC) curves for PfCRT 7G8 complexed with the Fab CTC variable domain as well as for PfCRT alone. Data show the half-map (blue) and map-to-model (purple) resolutions (at 0.143 and 0.5 cut-offs respectively), with embedded histograms of directional resolutions sampled evenly over the 3D-FSC (yellow). The corresponding sphericity values are indicated. e, Euler angle distribution plot of the final 3D reconstruction from CryoSPARC 2. f, Local resolution display of unsharpened reconstructions of PfCRT complexed with the CTC Fab variable domain, in orthogonal views, sliced through the density for the first view.
Extended Data Figure 4 |
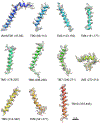
Extended Data Figure 4 |. Fit of cryo-EM density with model.
Cryo-EM densities (mesh) are superimposed with TM and JM helices of the PfCRT model. The model is rendered as a cartoon, colored in rainbow.
Extended Data Figure 5 |
Extended Data Figure 5 |. PfCRT symmetrical arrangement, topology of TM helices, and structural comparison with other DMT superfamily members.
a, View of PfCRT from opposite directions of the DV and cytosol, with labeling of the four helices closest to the center (thus contributing to the cavity). b, Model of the TM helices in the PfCRT 7G8 structure in the open-to-cytosol conformation. c, Structural conservation of PfCRT compared with the DMT family members Vrg4 (a GDP-mannose transporter; PDB ID: 5OGE/5OGK), YddG (an amino acid transporter; PDB ID: 5I20), TPT (a triose-phosphate/phosphate translocator; PDB ID: 5Y78/5Y79), and zmCST and mCST (two CMP-sialic acid transporters; PDB IDs: 6I1R and 6OH4, respectively),. Conservation profiles were generated using the Dali server. d, Electrostatic representation of slices revealing the cavities of these six proteins in their solved structural states. Note the highly negatively charged (red) residues in the PfCRT cavity, contrasting with the positively charged (blue) or neutral residues in the other DMT transporters (shown as slices to emphasize the individual cavities). Ligands for the non-PfCRT transporters are shown in a ball and stick representation.
Extended Data Figure 6 |
Extended Data Figure 6 |. Structure of the PfCRT 7G8-Fab CTC complex showing sequence conservation, localization of cholesteryl hemisuccinate (CHS), chemical structure of CQ and PPQ, and conservation of CQ-R and PPQ-R mutations.
a, PfCRT and the bound Fab are rendered in cartoon. PfCRT is colored according to sequence conservation (see Extended Data Fig. 7) and the Fab is colored in pink. Inset shows a magnified view of the interaction between PfCRT 7G8 and the Fab CTC. b, PfCRT cleft formed by JM1, TM1, TM9 and TM10 demonstrates CHS placement. c, PfCRT is rendered as a surface colored by hydrophobicity, from orange (hydrophobic) to blue (hydrophilic). d, 2D diagram of PfCRT-CHS interactions observed in the structure, generated using LigPlot+89. e, Chemical structures of CQ and PPQ, with the 4-aminoquinoline rings shaded. f, Location of CQ (left) and PPQ (right) resistance-associated mutations (with side chains rendered as sticks and spheres), modeled onto the PfCRT 7G8 structure. Models are color coded according to sequence conservation derived from 11 Apicomplexan species (Extended Data Figure 7). TM helices associated with CQ or PPQ resistance are labeled and the areas highlighted with colored circles.
Extended Data Figure 7 |
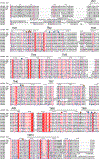
Extended Data Figure 7 |. Sequence alignment and secondary structure of PfCRT.
Sequences of different PfCRT isoforms and other CRT homologs were aligned using MUSCLE and displayed using ESPript. Sequences of nine orthologs of CRT in other Plasmodium or other Apicomplexan parasites were obtained from OrthoMCL-DB. The sequences used are PfCRT 7G8 (UNIPROT W7FI62) and its orthologs PfCRT Dd2 (UNIPROT F5CEB4) and PfCRT WT (the canonical 3D7 wild-type sequence; UNIPROT Q9N623), P. reichenowi CRT (PrCRT; UNIPROT A0A2P9D9K2), P. vivax CRT strain Sal-1 (PvCRT; UNIPROT Q9GSD3), P. knowlesi CRT strain H (PkCRT; UNIPROT Q9GSD7), P. berghei CRT strain ANKA (PbCRT; UNIPROT Q9GSD8), P. chabaudi CRT strain chabaudi (PcCRT; UNIPROT Q7Z0V9), Babesia microti CRT strain RI (BmCRT; UNIPROT A0A1N6LY67), Theileria annulata CRT strain Ankara (TaCRT, UNIPROT Q4UDS9); Eimeria tenella CRT (EtCRT; UNIPROT U6L1M8), Toxoplasma gondii CRT (TgCRT; UNIPROT S8EU26), and Cryptosporidium hominis CRT strain TU502 (ChCRT; UNIPROT A0A0S4THJ3). The secondary structure of PfCRT is shown as a cartoon above the alignments with residue numbering corresponding to the PfCRT 7G8 reference, along with the positioning of the variant residues indicated in Extended Data Fig. 1 (sharing the same color scheme). The highly-conserved cysteine residues that likely form disulfide bonds are C289-C312 and C301-C309. The degree of conservation was calculated by considering all sequences including P. falciparum 3D7 (WT) but excluding the 7G8 and Dd2 variants. Residues conserved (i.e. identical or similar) in at least 10 of 13 species are indicated in red text. Residues conserved in all species are in white text with red highlighting. None of the mutations associated with CQ or PPQ resistance mapped to residues that are fully conserved across these Apicomplexan species.
Extended Data Figure 8 |
Extended Data Figure 8 |. Binding and transport assays for PfCRT 7G8.
a, Total binding of 125 nM [3H]-Arg to 100 ng of nanodisc-incorporated PfCRT 7G8 was measured in the absence (−) or presence (+) of 800 mM imidazole (which competes with the His-tagged PfCRT 7G8 isoform for binding to the copper-coated YSi SPA beads). Bars show means ± SEM (N=3 independent experiments), and grey symbols show the data mean of technical replicates (n=3) of each independent experiment. b, Isotopic dilution of 125 nM [3H]-Arg with non-radiolabeled Arg revealed a LogEC50 value of −3.40 ± 0.033 M (corresponding to 397 μM). We note that the primary source of Arg in parasitized red blood cells is from the proteolysis of hemoglobin, which in its native state as a tetramer is present at 5 mM. Symbols show means ± SEM (N=3 independent experiments of n=3 technical replicates). c, Binding of 125 nM [3H]-Arg in the presence or absence of 10 μM verapamil (VP), 1 μM CQ or PPQ, 0.1 μM amodiaquine (ADQ), or 1 mM Arg, Lys or Leu. Data were normalized to the signal in the absence of the respective non-radiolabeled compound and show means ± SEM (N=3 independent experiments), and grey symbols show the data mean of n=3 technical replicates of each independent experiment. d-e, Uptake of (d) 370 nM [3H]-CQ or (e) 250 nM [3H]-Arg, was measured for 1 min periods in PfCRT 7G8-containing proteoliposomes preloaded with 100 mM KPi, pH 7.5 diluted in buffer composed of 50 mM Tris/MES, pH 5.5 or 7.5 ± the K+ ionophore valinomycin (5 μM). The valinomycin (Vlm)-mediated K+ efflux proceeding down its concentration gradient generated an inside-negative membrane potential. Empty liposomes lacking PfCRT 7G8 served as controls. Data show means ± SEM (N=3 independent experiments), and grey symbols show the data mean of n=3 technical replicates of each independent experiment.
Extended Data Figure 9 |
Extended Data Figure 9 |. Role of conserved Cys residues in CQ binding and transport, and Parasite PPQ dose-response data.
a, Cysteine residues that likely form disulfide bonds on the loop adjacent to JM2 and connecting to TM8 are shown in yellow and rendered as sticks. Their locations are shown as an inset of the overall structure and are colored by conservation (as per Extended Data Fig. 7). b, Effect of reducing conditions on the binding of [3H]-CQ by PfCRT 7G8, 7G8+C289A, and 7G8+C301A. SPA binding of 100 nM [3H]-CQ was performed with 200 ng of each protein variant reconstituted into nanodiscs at pH 7.5 in the presence of varying concentrations of β-mercaptoethanol. Data (shown as means ± SEM of N=3 independent experiments of n=3 technical replicates) were normalized with regard to the activity measured for PfCRT 7G8 in the absence of the reducing agent. c, Effect of the reducing agent β-mercaptoethanol on [3H]-CQ transport by PfCRT 7G8, 7G8+C289A, or 7G8+C301A. Uptake of 100 nM [3H]-CQ was measured for 1 min periods in control liposomes and proteoliposomes containing the indicated PfCRT variants, in the presence of increasing concentrations of β-mercaptoethanol. Data show means of N=2 independent experiments performed as n=4 technical replicates and were subjected to non-linear regression fitting using hyperbolic decay models with either two (for 7G8 and 7G8+C289A) or three (including 7G8+C301A) parameters. Kinetic constants are shown as means ± SEM of the fits. The IC50 (concentration of β-mercaptoethanol yielding half-maximal reduction of transport) for 7G8 and 7G8+C289A were 1.24 ± 0.14 mM and 2.58 ± 0.39 mM, respectively. For 7G8+C301A the IC50 was 4.17 ± 0.16 mM with a remaining activity of 60.2 ± 8.2 % (compared to the activity in the absence of the reducing agent). d, PPQ dose-response data for pfcrt-edited and control parasite lines, generated from 72 h growth inhibition assays. Data are presented as means ± SEM from N=4 independent assays performed in duplicate (n=2). Statistical significance was determined via two-tailed Mann-Whitney U tests.
Extended Data Figure 10 |
Extended Data Figure 10 |. Electrostatic potential surfaces of isoform-specific PfCRT cavities, and molecular dynamics simulations.
a, Electrostatic surfaces for the solved open-to-DV conformation for 7G8 and modeled isoforms, predicted at pH 5.5. Images are presented as a vertical slice through the transporter, showing net charges in the cavity and locations of TM helices. The row below shows the electrostatic surfaces for the homology models of these PfCRT isoforms, illustrated in their open-to-cytosol configuration, predicted at pH 7.0. b, Surface representation of the electrostatic potential of the central cavity of 7G8 and the 7G8+C350R variant, shown in two different orientations with red and blue being negatively and positively charged, respectively. c, Molecular dynamics simulations on the 7G8 structure (minus the Fab) over 250 ns trajectories, establishing the equilibrium positions of protein side chains and distances between position 145 and residues on proximal helices. d, Molecular dynamics simulations on the 7G8 structure (minus the Fab) over 250 ns trajectories, establishing the equilibrium positions of protein side chains between position 350 and residues on proximal helices, and showing marginal movement between the C350 and the 350R isoforms.
Figure 1 |
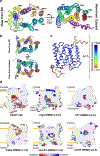
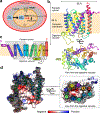
Figure 1 |. Single-particle cryo-EM structure of PfCRT 7G8.
a, PfCRT (PlasmoDB PF3D7_0709000) is localized within the membrane of the P. falciparum intra-erythrocytic parasite’s digestive vacuole (DV), wherein imported host hemoglobin (Hb) is catabolized and toxic free heme is released. Chloroquine (CQ) and piperaquine (PPQ) are believed to concentrate in the DV as protonated species (CQ2+ and PPQ4+) that bind heme and prevent its incorporation into non-toxic hemozoin. In CQ-R parasites, PfCRT is thought to efflux CQ out of the DV into the cytosol away from its heme target. b, The 3.2 Å cryo-EM structure of PfCRT 7G8, with the 10 transmembrane (TM) helices colored in rainbow. The N- and C- termini are labeled. The lower panel shows a 90° rotation with helices numbered, as viewed from the DV side. c, Topology of PfCRT highlighting the inverted antiparallel repeats of TM 1–4 and TM 6–9 (grey). Disordered regions are shown as dotted lines. TM helices are numbered 1 to 10 (with 1–4 and 6–9 surrounding the central cavity), while the juxtamembrane helices (JM) are labeled JM1 and JM2. d, Surface representation of the electrostatic potential of the central cavity with red and blue being negatively and positively charged, respectively. On the right, a central slice through the structure (dotted lines) as an insert shows the arrangement of TM helices, labeled from N- to C-terminus.
Figure 2 |
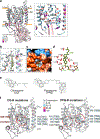
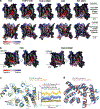
Figure 2 |. Mapping of drug-resistance mutations onto the PfCRT structure.
Residues known to contribute to resistance to CQ and PPQ (Extended Data Fig. 1; Extended Data Table 2) are mapped onto the 7G8 structure and a model of Dd2. Mutations have their side chains rendered as sticks and are colored based on their associated resistance profiles. The remaining structures are rendered in cartoon and colored in grey. Views are shown vertically (DV to the bottom) and from the DV side.
Figure 3 |
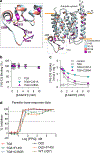
Figure 3 |. Functional characterization of PfCRT isoforms.
a, Binding of 370 nM [3H]-CQ (red) or 75 nM [3H]-PPQ (blue) to PfCRT 7G8 ± imidazole (bars show means ± SEM of N=3 independent experiments, and grey symbols are the data mean of technical replicates (n=3) of each independent experiment to show the distribution of the data). b, Isotopic dilution of [3H]-CQ or [3H]-PPQ revealed LogEC50 of −6.53 ± 0.04 M and −6.70 ± 0.05 M (corresponding to means of 297 nM for CQ and 190 nM for PPQ), respectively. Data show means ± SEM of N=3 independent experiments performed as technical replicates (n=3). c, Competition of [3H]-CQ or [3H]-PPQ binding with non-radiolabeled PPQ or CQ, respectively, revealed LogIC50 values of −6.77 ± 0.03 M and −6.78 ± 0.06 M (corresponding to means of 171 nM and 167 nM), respectively. Data show means ± SEM of N=3 independent experiments performed as technical replicates (n=3). d, Specific binding of [3H]-CQ or [3H]-PPQ performed in the absence (−) or presence of 10 μM verapamil (VP), 1 μM amodiaquine (ADQ), 10 μM lumefantrine (LMF) or atovaquone (ATQ), or 1 mM Arg or Leu. Nanodiscs containing LeuT served as controls. Bars show means ± SEM; N=3 independent experiments, and grey symbols show the data mean of technical replicates (n=3) of each independent experiment. e, Fab binding to the PfCRT 7G8 isoform reduces binding of 370 nM [3H]-CQ, 75 nM [3H]-PPQ, or 250 nM [3H]-Arg, in a concentration-dependent manner, yielding IC50 values of 0.15 ± 0.02 μM, 0.20 ± 0.02 μM, or 0.18 ± 0.02 μM, respectively. Data show means ± SEM; N=3 independent experiments of technical replicates (n=3). f, Time course of 93 nM [3H]-CQ, 75 nM [3H]-PPQ, or 125 nM [3H]-Arg, uptake measured with 7G8 PfCRT-containing proteoliposomes (PLs). Data show means ± SEM of N=2 independent experiments performed as n=3 technical replicates. Inset: transport kinetics of PfCRT-7G8 for [3H]-CQ and [3H]-Arg in PLs revealed Michaelis-Menten constants (Km) of 0.77 ± 0.15 μM and 1.30 ± 0.20 μM with a maximum velocity of transport (Vmax) of 92.2 ± 4.9 nmol x mg−1 x min−1 and 189.2 ± 9.1 nmol x mg−1 x min−1 for the uptake of CQ and Arg, respectively. Data show means of N=2 independent experiments of technical replicates (n=4) and the kinetic constants represent the means ± SEM of the global fits. g, Uptake of 370 nM [3H]-CQ or 250 nM [3H]-Arg was measured for 1 min in the presence or absence of 1 μM Fab, 10 μM VP, CQ, PPQ, ADQ, or 1 mM Leu. Values were normalized to the signal in the absence of non-radiolabeled compound. Bars show means ± SEM of N=3 independent experiments, and grey symbols show the data mean of technical replicates (n=3) of each independent experiment. Data in panel a - e are normalized to the specific signal (total counts per minute minus counts per minute in the presence of imidazole) in the absence of the respective non-radiolabeled compound. h, Saturation binding of [3H]-CQ (red) or [3H]-PPQ (blue) by indicated PfCRT variants reconstituted in nanodiscs was performed using equilibrium dialysis at pH 5.5. Dissociation constants (Kd) are shown as means ± SEM calculated from global non-linear regression fitting (N=3 independent experiments). i, Uptake of 100 nM [3H]-CQ (red) or [3H]-PPQ (blue) was measured for 1 min in proteoliposomes containing the indicated PfCRT variants or in control liposomes. Bars show means of N=2 independent experiments. Grey symbols show the data mean of technical replicates (n=4) of each independent experiment. j, Kinetic characterization of [3H]-CQ (red) or [3H]-PPQ (blue) uptake in proteoliposomes containing the indicated PfCRT variants. The initial rate of transport was measured for periods of 3 seconds using [3H]-CQ or [3H]-PPQ concentrations ranging from 0.05 – 10 μM. Data (means of N=2 independent experiments of technical replicates (n=4)) were fitted to the Michaelis-Menten equation. The Km and Vmax values are shown as means ± SEM of the fit in Extended Data Table 4. Transport kinetics of PfCRT 7G8, Dd2, or WT for PPQ or PfCRT WT for CQ were not determined due to low signal-to-noise ratios. k, [3H]-CQ and [3H]-PPQ cellular accumulation ratios (CARs) at t=60 min for edited and reference parasite lines. Data are presented as means ± SEM where N=4–6 independent experiments performed in duplicate (n=2). *P<0.05; **P<0.01 (using two-tailed Mann-Whitney U tests). l, Percent parasite survival of pfcrt-edited and reference lines following exposure to PPQ for 48 h. Percent survival was calculated for each line by dividing the parasitemia of the PPQ-treated parasites with that of the no-drug control. Data are presented as means ± SEM where N=2–5 independent assays performed in duplicate (n=2). Statistical significance was determined via two-tailed Mann-Whitney U tests where N>2.

Comment in

References

    1. Su XZ, Lane KD, Xia L, Sa JM & Wellems TE Plasmodium genomics and genetics: new insights into malaria pathogenesis, drug resistance, epidemiology, and evolution. Clin. Microbiol. Rev 32, e00019–00019 (2019). - PMC - PubMed
    1. van der Pluijm RW et al. Determinants of dihydroartemisinin-piperaquine treatment failure in Plasmodium falciparum malaria in Cambodia, Thailand, and Vietnam: a prospective clinical, pharmacological, and genetic study. Lancet Infect Dis 19, 952–961 (2019). - PMC - PubMed
    1. Fidock DA et al. Mutations in the P. falciparum digestive vacuole transmembrane protein PfCRT and evidence for their role in chloroquine resistance. Mol. Cell 6, 861–871 (2000). - PMC - PubMed
    1. Martin RE et al. Chloroquine transport via the malaria parasite’s chloroquine resistance transporter. Science 325, 1680–1682 (2009). - PubMed
    1. Blasco B, Leroy D & Fidock DA Antimalarial drug resistance: linking Plasmodium falciparum parasite biology to the clinic. Nat. Med. 23, 917–928 (2017). - PMC - PubMed

Extended Data References

    1. Assur Z, Hendrickson WA & Mancia F Tools for coproducing multiple proteins in mammalian cells. Methods Mol. Biol 801, 173–187 (2012). - PMC - PubMed
    1. Kawate T & Gouaux E Fluorescence-detection size-exclusion chromatography for precrystallization screening of integral membrane proteins. Structure 14, 673–681 (2006). - PubMed
    1. Goehring A et al. Screening and large-scale expression of membrane proteins in mammalian cells for structural studies. Nat. Protoc 9, 2574–2585 (2014). - PMC - PubMed
    1. Gibson DG et al. Enzymatic assembly of DNA molecules up to several hundred kilobases. Nat. Methods 6, 343 (2009). - PubMed
    1. Wright DJ, O’Reilly M & Tisi D Engineering and purification of a thermostable, high-yield, variant of PfCRT, the Plasmodium falciparum chloroquine resistance transporter. Protein. Expr. Purif 141, 7–18 (2018). - PubMed

Publication types

MeSH terms