Observational Study
. 2020 Mar 16;221(7):1135-1145.
doi: 10.1093/infdis/jiz563.

Levels of Human Immunodeficiency Virus DNA Are Determined Before ART Initiation and Linked to CD8 T-Cell Activation and Memory Expansion

Affiliations
Observational Study

Levels of Human Immunodeficiency Virus DNA Are Determined Before ART Initiation and Linked to CD8 T-Cell Activation and Memory Expansion

Genevieve E Martin et al. J Infect Dis. .

Abstract

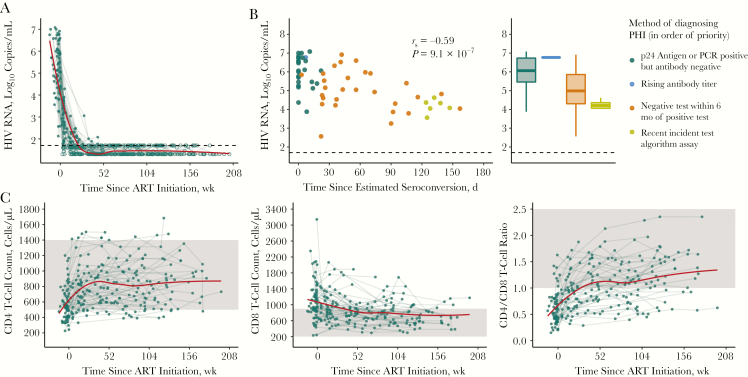
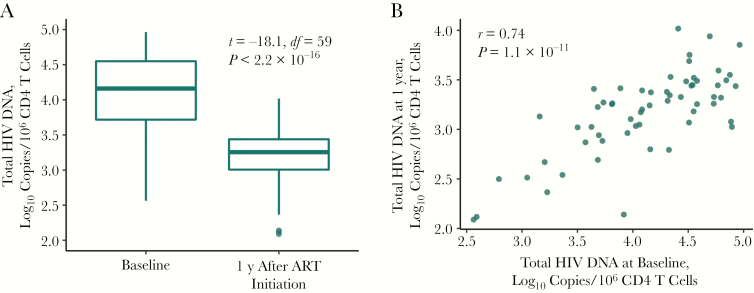
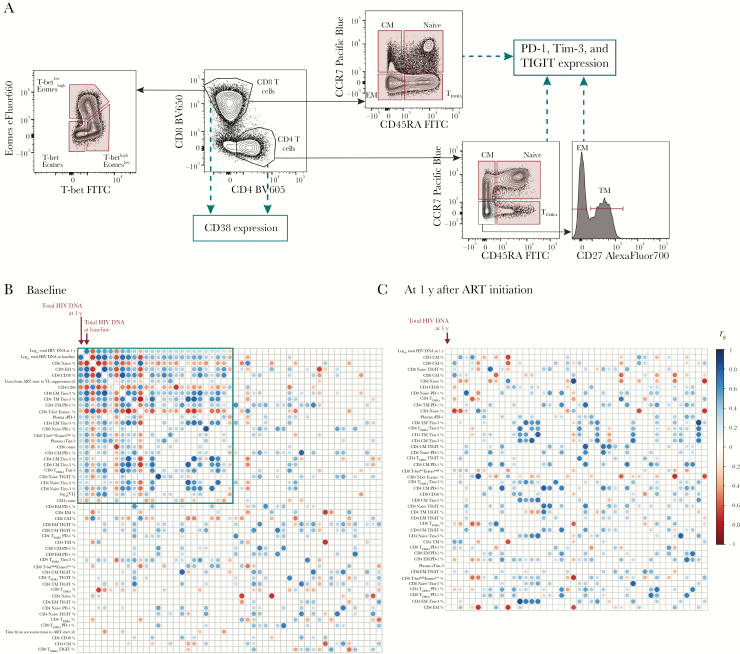
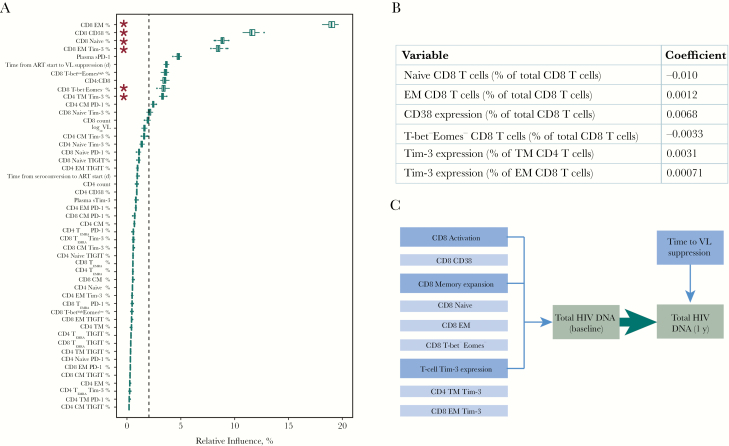
Initiation of antiretroviral therapy (ART) in early compared with chronic human immunodeficiency virus (HIV) infection is associated with a smaller HIV reservoir. This longitudinal analysis of 60 individuals who began ART during primary HIV infection (PHI) investigates which pre- and posttherapy factors best predict HIV DNA levels (a correlate of reservoir size) after treatment initiation during PHI. The best predictor of HIV DNA at 1 year was pre-ART HIV DNA, which was in turn significantly associated with CD8 memory T-cell differentiation (effector memory, naive, and T-bet-Eomes- subsets), CD8 T-cell activation (CD38 expression) and T-cell immunoglobulin and mucin-domain containing-3 (Tim-3) expression on memory T cells. No associations were found for any immunological variables after 1 year of ART. Levels of HIV DNA are determined around the time of ART initiation in individuals treated during PHI. CD8 T-cell activation and memory expansion are linked to HIV DNA levels, suggesting the importance of the initial host-viral interplay in eventual reservoir size.

Keywords: HIV; HIV reservoir; T cells; primary HIV infection.


Figures

Figure 1.
Figure 1.
Measures of clinical progression during treated primary human immunodeficiency virus (HIV) infection. A, Viral load (VL) in the 4 years after antiretroviral therapy (ART) initiation (n = 60). Exact values are shown as closed circles, and those below the limit of detection as open circles; black dashed line indicates 50 copies/mL. B, Baseline VL relative to the number of days this was measured after estimated seroconversion (left panel; Spearman correlation) with the same data as box plots stratified by the method of diagnosing primary HIV infection (PHI) (right panel). If individuals met multiple diagnostic criteria, they are plotted as the criterion with the most reliability in estimating date of seroconversion; these are shown in the legend in the order of priority used. C, CD4 and CD8 T-cell counts and CD4/CD8 T-cell ratio in the 4 years after ART initiation (n = 63); the shaded region shows the normal range for these parameters. For A and C, a trend line (red) has been fitted using local polynomial regression fitting (LOESS) smoothing with an α value of .75. Abbreviation: PCR, polymerase chain reaction.
Figure 2.
Figure 2.
Total human immunodeficiency virus (HIV) DNA levels during treated primary HIV infection, showing relationship between total HIV DNA levels measured at baseline and 1 year after antiretroviral therapy (ART) initiation (n = 60). Comparisons were made using paired t tests (A) and Pearson correlation (B).
Figure 3.
Figure 3.
Immunological and clinical variables associated with human immunodeficiency virus (HIV) reservoir size are highly correlated with one another. A, Schematic showing the T-cell subsets and surface markers measured by flow cytometry in this analysis. The frequency of populations gated in red was included in analysis, as well as the expression of CD38, PD-1, Tim-3 and TIGIT on populations marked. Further gating details are shown in Supplementary Figure 3. B, C, Correlations between clinical or immunological variables and HIV reservoir size. Corrgrams show the relationship between HIV reservoir size at 1 year (log10 total HIV DNA) and immunological or clinical variables (n = 60) measured at baseline (B) or after 1 year of antiretroviral therapy (ART) (C). The same immunological variables were included at both time points, and clinical variables at baseline only. Reservoir size at 1 year (log10 total HIV DNA) is shown in the top left corner and is marked. For both B and C, variables have been ranked based on the magnitude of absolute correlation coefficient with log10 total HIV DNA at 1 year in decreasing order from the top left corner. The size and color of each circle correspond to the correlation coefficient between any 2 variables. Correlation coefficients were calculated using the Spearman method with pairwise complete observations; only correlations significant at the .05 level are shown (other boxes are left blank). The green box encloses variables that are significant correlated with 1 year log10 total HIV DNA at 1 year (at the .05 level). Abbreviations: CM, central memory; EM, effector memory; EMRA, effector memory T-cells re-expressing CD45RA; FITC, fluorescein isothiocyanate; PD-1, programmed cell death protein 1; sPD-1, soluble PD-1; sTim-3, soluble Tim-3; TIGIT, T cell immunoreceptor with immunoglobulin and ITIM domains; Tim-3, T cell immunoglobulin and mucin-domain containing protein 3; TM, transitional memory; VL, viral load.
Figure 4.
Figure 4.
Immunological and clinical variables that relate to total human immunodeficiency virus (HIV) DNA. A, Boosted regression trees model to assess predictors of baseline total HIV DNA (49 predictors; n = 60); box plots show the summary of 100 model runs. Influential predictors were defined as those whose relative contribution was >100, divided by the total number of covariates; this value is indicated by dashed vertical line. Asterisks denote variables that are also selected in B. B, Least absolute shrinkage and selection operator (LASSO) output for predictors of baseline total HIV DNA (49 predictors; n = 60; deviance explained, 0.62). Variables that do not significantly contribute to the model have a coefficient of 0; only those with a nonzero coefficient are shown, and missing values were imputed. Coefficients represent the change in log10 total HIV DNA per 1% higher predictor variable. C, Schematic illustrating which factors were associated with HIV DNA level during treated primary HIV infection in this analysis. Abbreviations: ART, antiretroviral therapy; CM, central memory; EM, effector memory; EMRA, effector memory T cells re-expressing CD45RA; PD-1, programmed cell death protein 1; sPD-1, soluble PD-1; sTim-3, soluble Tim-3; TIGIT, T cell immunoreceptor with immunoglobulin and ITIM domains; Tim-3, T cell immunoglobulin and mucin-domain containing protein 3; TM, transitional memory; VL, viral load.
Figure 5.
Figure 5.
Relationship between HLA class I alleles and total human immunodeficiency virus (HIV) DNA 1 year after antiretroviral therapy (ART) initiation. Alleles, shown on the x-axis, are ordered based on the median value of total HIV DNA for all individuals possessing that allele. Box plots show the distribution of total HIV DNA among individuals possessing the allele, and each observation is shown as an open circle. Data are shown for 58 individuals and a total of 316 alleles. For 1 individual, only B alleles were available and are included here; for another, only A and C alleles were available. Where individuals were homozygous for a given allele, it is shown only once. Dashed line represents median value of total HIV DNA for the entire cohort. Alleles were classified as being associated with disease progression (blue), disease control (red), or neither (white), based on those identified in the International HIV Controllers Study at a significance level of .05 [28].

References

    1. Finzi D, Hermankova M, Pierson T, et al. Identification of a reservoir for HIV-1 in patients on highly active antiretroviral therapy. Science 1997; 278:1295–300. - PubMed
    1. Chun TW, Carruth L, Finzi D, et al. Quantification of latent tissue reservoirs and total body viral load in HIV-1 infection. Nature 1997; 387:183–8. - PubMed
    1. Williams JP, Hurst J, Stöhr W, et al. ; SPARTACTrial Investigators HIV-1 DNA predicts disease progression and post-treatment virological control. Elife 2014; 3:e03821. - PMC - PubMed
    1. Sneller MC, Justement JS, Gittens KR, et al. A randomized controlled safety/efficacy trial of therapeutic vaccination in HIV-infected individuals who initiated antiretroviral therapy early in infection. Sci Transl Med 2017; 9:eaan8848. - PMC - PubMed
    1. Hurst J, Hoffmann M, Pace M, et al. Immunological biomarkers predict HIV-1 viral rebound after treatment interruption. Nat Commun 2015; 6:8495. - PMC - PubMed

Publication types