

Temporal perturbation of ERK dynamics reveals network architecture of FGF2/MAPK signaling
- PMID: 31777174
- PMCID: PMC6864398
- DOI: 10.15252/msb.20198947
Temporal perturbation of ERK dynamics reveals network architecture of FGF2/MAPK signaling
Abstract
Stimulation of PC-12 cells with epidermal (EGF) versus nerve (NGF) growth factors (GFs) biases the distribution between transient and sustained single-cell ERK activity states, and between proliferation and differentiation fates within a cell population. We report that fibroblast GF (FGF2) evokes a distinct behavior that consists of a gradually changing population distribution of transient/sustained ERK signaling states in response to increasing inputs in a dose response. Temporally controlled GF perturbations of MAPK signaling dynamics applied using microfluidics reveal that this wider mix of ERK states emerges through the combination of an intracellular feedback, and competition of FGF2 binding to FGF receptors (FGFRs) and heparan sulfate proteoglycan (HSPG) co-receptors. We show that the latter experimental modality is instructive for model selection using a Bayesian parameter inference. Our results provide novel insights into how different receptor tyrosine kinase (RTK) systems differentially wire the MAPK network to fine-tune fate decisions at the cell population level.
Keywords: ERK signaling dynamics; cell fate determination; mechanistic modeling; microfluidics; parameter estimation.
© 2019 The Authors. Published under the terms of the CC BY 4.0 license.
Conflict of interest statement
The authors declare that they have no conflict of interest.
Figures

- A
Flow‐based, microfluidic device for temporal GF delivery. Computer‐controlled, pressure pump enables mixing of medium and GFs to deliver GF pulses in cells cultured in the microfluidic device. The right panel illustrates typical GF stimulation patterns.
- B
Representative EKAR2G ratio images of cells treated with 25 ng/ml EGF, NGF, and FGF2. Ratio images are color‐coded so that warm/cold colors represent high/low ERK activation levels. Scale bar = 50 μm.
- C, D
Population averages of ERK activity dynamics in response to stimulation with 25 ng/ml (C), or with a dose–response challenge using 0.25, 2.5, 25, and 250 ng/ml EGF, NGF, and FGF2 (D). Single‐cell time series were normalized to their own means before GF stimulation, t = [0, 40]. Red curve at the bottom of panel C indicates GF stimulation profile measured simultaneously using an Alexa 546‐labeled dextran. N = [48, 120] cells per GF concentration. ERK dynamics measured at 2′ intervals.
- E
Hierarchical clustering of pooled (N = 983) single‐cell time series from panel (D). To focus on relevant ERK dynamics, we trimmed x‐axis to t = [36, 100] min. Each row of the heatmap corresponds to a time series of a single cell. We used dynamic time warping and Ward's linkage method for building the dendrogram, which was then cut to distinguish 6 clusters that are color‐coded on the left.
- F
Average ERK activity across 6 clusters identified in panel (E), color‐coded as in (E).
- G
Distribution of ERK activity trajectories across 6 clusters from panels (E and F) in response to different GF dosages.
- H
Separability between populations of single‐cell trajectories calculated as normalized area under the curve of Jeffries–Matusita distance along time (Materials and Methods, Appendix Fig S2B). The dendrogram was created using the complete‐linkage method.

Single‐cell ERK activity measured at 10 min before and after sustained GF stimulation (T = 30′ and 50′). Single‐cell trajectories were normalized to their own means before GF stimulation, t = [0, 40]. Lower and upper hinge correspond to 25th and 75th percentiles. Lower and upper whiskers correspond to 1.5*IQR from the hinge. Replicates: 1.
ERK activity dynamics in response to stimulation with a dose–response challenge using 0.25, 2.5, 25, and 250 ng/ml EGF, NGF, and FGF2. Single‐cell time series were normalized to their own means before GF stimulation, t = [36, 40] min. Red curve indicates the population mean; black horizontal bar indicates GF stimulation. N = [48, 120] cells per GF concentration. ERK dynamics measured at 2′ intervals.
Single‐cell ERK trajectories within 6 clusters identified in Fig 1F. We used hierarchical clustering with dynamic time warping and Ward's linkage method for building the dendrogram, which was then cut to distinguish 6 clusters.
Hierarchical clustering of individual GF dose–response challenges from (B) with the same approach as (B) but for a longer interval (t = [36, 200] min). The left column indicates cluster means and 95% CI for the mean, and the right column is the distribution of single‐cell trajectories across 4 clusters, representative of 3 replicates.

Principal component analysis (PCA) of a pooled dataset from Fig 1E. The first two components account for 85% of the overall variability. Here, we use the same data trimmed to t = [36,100] min as in clustering in Fig 1E. Note that in addition to GF responses, responses of untreated cells are also shown, although they were not used in the decomposition (red points).
Schematic of distance calculation between two populations of single‐cell time series. Two synthetic populations of noisy time series data consist of 100 trajectories each, with each trajectory spanning t = [0, 5] T with 0.1 T interval. Step 1: At every measured time point, calculate Jeffries–Matusita distance (d JM) between two distributions of a measured quantity. Step 2: Calculate area under the curve (AUC) of d JM and express it as fraction of the maximum AUC of d JM, which is 2dxN, where is the interval length and is the number of measured time points. The normalized AUC of d JM is used to construct dendrogram in Fig 1H.
d JM over time for each GF concentration pair (0.25, 2.5, 25, 250 ng/ml) for EGF, NGF, and FGF2 stimulation. Here, we use the same data trimmed to t = [36,200] min as in Figure EV1B.
- A–C
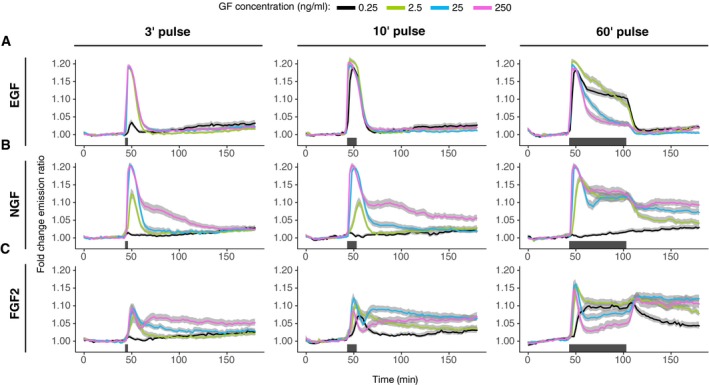
Population average of ERK activity dynamics in response to 3′, 10′, and 60′ EGF (A), NGF (B), and FGF2 (C) single‐pulse stimulation. Single‐cell time series were normalized to their own means before the GF stimulation, t = [0, 40]. Solid lines—population mean, N = [39, 166], replicates: EGF: 1, NGF: 1, FGF: representative of 3 replicates; gray bands—95% CI for the mean; black horizontal bars—duration of GF stimulation.

- A–C
Hierarchical clustering of dynamic ERK responses to a single 3′, 10′, and 60′ pulse of EGF (A), NGF (B), and FGF2 (C). We used dynamic time warping and Ward's linkage method for building the dendrogram, which was then cut to highlight 3 or 4 main branches with major dynamic patterns. GF dose responses in each panel were clustered independently; thus, cluster averages that share the same color across panels are unrelated.

Population average of ERK activity dynamics in response to a multi‐pulse 3′–20′ EGF stimulation. Single‐cell time series were normalized to their own means before the GF stimulation, t = [0, 40].
Cluster averages of ERK activity and distribution of single‐cell trajectories across clusters.
Population average of ERK activity dynamics in response to a multi‐pulse 3′–20′ NGF stimulation. Single‐cell time series were normalized to their own means before the GF stimulation, t = [0, 40].
Cluster averages of ERK activity and distribution of single‐cell trajectories across clusters.
Population average of ERK activity dynamics in response to a multi‐pulse 3′–20′ FGF2 stimulation. Single‐cell time series were normalized to their own means before the GF stimulation, t = [0, 40].
Cluster averages of ERK activity and distribution of single‐cell trajectories across clusters.

- A–D
Whole‐cell mean fluorescence intensity of labeled FGF2 (HiLyte 647) used in a dose–response challenge with 10, 25, and 50 mM of NaClO3 and a multi‐pulse 3′–20′ stimulation with FGF2 2.5 ng/ml (A, C), and 250 ng/ml (B, D). (C, D) Population average of ERK activity dynamics in response to the dose–response challenge. Solid lines—population mean, N =[43, 65] representative of 2 replicates; gray bands—95% CI for the mean; black bars—duration of GF stimulation.

Representative images of differentiation experiments of sustained stimulation with respective GF. Cells are stained for alpha‐tubulin and are shown in inverted black/white contrast.
Fraction of differentiated cells from sustained stimulation, calculated as fraction of cells with the total neurite outgrowth longer than the diameter of the cell soma using a CellProfiler‐based automated image analysis routine. On average, 4,000 cells per condition were included in the analysis (min = 1,600, max = 12,500). Error bars indicate 95% CI for the mean.
Representative images of differentiation experiments of single 3‐min pulse stimulation with respective GF. Cells are stained for alpha‐tubulin and are shown in inverted black/white contrast. Scale bar = 50 μm.
Fraction of differentiated cells from 3‐min single‐pulse stimulation, calculated as fraction of cells with the total neurite outgrowth longer than the diameter of the cell soma using a CellProfiler‐based automated image analysis routine. On average, 4,000 cells per condition were included in the analysis (min = 1,600, max = 12,500). Error bars indicate 95% CI for the mean.

Illustration of the three proposed receptor activation mechanisms. Simple activation: Only the FGFR–FGF2–HSPG complex activates downstream MAPK signaling (blue arrow). Competitive activation: the same as simple activation, but FGFR can bind FGF2 without HSPG. The resulting FGFR–FGF2 complex does not activate downstream pathways. Competitive joint activation: the same as competitive activation, but both FGFR–FGF2–HSPG and FGFR–FGF2 activate downstream MAPK signaling. Right panel indicates how FGFR activity will evolve upon FGF2 stimulation.
Proposed MAPK network feedback models. The minimal set of MAPK signaling nodes is shown, including a negative feedback regulator protein (NFB). Asterisks denote activated forms of these nodes. Basic system: no feedback or feed‐forward structure. Incoherent feed‐forward: Activation of the negative regulator is proportional to FGFR activation. Negative feedback: Activation of the negative regulator is proportional to ERK activation. Incoherent feed‐forward and negative feedback: Activation of the negative regulator is proportional to the product of RTK activation and ERK activation.
A systematic overview of all proposed model topologies. The models are labeled A–D for different intracellular feedback structures, and 1–3 for the different receptor models.
An overview of our model selection procedure. We start with our set of 12 candidate models and a training set of experimental observations. For each of the candidate models, we perform Bayesian parameter inference using the approximate nested sampling algorithm. We obtain a posterior distribution of the parameters for each candidate model. We then subsequently benchmark models/associated parameter spaces for their ability to predict ERK activity dynamics for unobserved pulsed stimulation schemes. Finally, we further evaluate the ability of the candidate models to predict a biological perturbation (HSPG perturbation).


Population average of ERK activity dynamics upon stimulation with 250 ng/ml FGF2 without (red) and with 50 mM NaClO3 (red) treatment (solid lines). The model simulations for the four models B2, B3, C3, and D4 are indicated with dotted lines, gray band indicates 95% CI for the mean.
Full illustration of the model B3, which is able to reproduce the training data, predict ERK activity dynamics upon unknown stimulation schemes, and reproduce the ERK activity dynamics upon NaClO3 treatment.
The latent states of the model B3 upon pulse stimulation with 2.5 ng/ml FGF2 (blue) and 250 ng/ml FGF2 (red). Different molecular species are indicated by symbols (receptor models) or signaling nodes. Asterisks denote activated forms of signaling nodes.
Illustration of the mechanism responsible for the in‐ and anti‐phase ERK dynamics evoked by 2.5 and 250 ng/ml FGF2. Gray boxes indicate stimulation with FGF2 pulses. Red dots indicate FGF2. Dashed dots indicate unbinding of FGF2 receptor complexes. Teal arrows indicate signaling strengths of different FGF2 receptor complexes. Plain black arrows indicate fast binding/unbinding events. Dotted black arrows indicate slow unbinding events.
Qualitative illustration of the abundance of the different receptor species, as well as total FGFR signaling activity. Gray areas indicate FGF2 pulsed stimulation.
References
-
- Avraham R, Yarden Y (2011) Feedback regulation of EGFR signalling: decision making by early and delayed loops. Nat Rev Mol Cell Biol 12: 104–117 - PubMed
-
- Cohen‐Saidon C, Cohen AA, Sigal A, Liron Y, Alon U (2009) Dynamics and variability of ERK2 response to EGF in individual living cells. Mol Cell 36: 885–893 - PubMed
Publication types
MeSH terms
Substances
LinkOut - more resources
Full Text Sources
Miscellaneous
