

Therapeutic implications of altered cholesterol homeostasis mediated by loss of CYP46A1 in human glioblastoma
- PMID: 31777202
- PMCID: PMC6949512
- DOI: 10.15252/emmm.201910924
Therapeutic implications of altered cholesterol homeostasis mediated by loss of CYP46A1 in human glioblastoma
Abstract
Dysregulated cholesterol metabolism is a hallmark of many cancers, including glioblastoma (GBM), but its role in disease progression is not well understood. Here, we identified cholesterol 24-hydroxylase (CYP46A1), a brain-specific enzyme responsible for the elimination of cholesterol through the conversion of cholesterol into 24(S)-hydroxycholesterol (24OHC), as one of the most dramatically dysregulated cholesterol metabolism genes in GBM. CYP46A1 was significantly decreased in GBM samples compared with normal brain tissue. A reduction in CYP46A1 expression was associated with increasing tumour grade and poor prognosis in human gliomas. Ectopic expression of CYP46A1 suppressed cell proliferation and in vivo tumour growth by increasing 24OHC levels. RNA-seq revealed that treatment of GBM cells with 24OHC suppressed tumour growth through regulation of LXR and SREBP signalling. Efavirenz, an activator of CYP46A1 that is known to penetrate the blood-brain barrier, inhibited GBM growth in vivo. Our findings demonstrate that CYP46A1 is a critical regulator of cellular cholesterol in GBM and that the CYP46A1/24OHC axis is a potential therapeutic target.
Keywords: 24OHC; CYP46A1; cholesterol homeostasis; efavirenz; glioblastoma.
© 2019 The Authors. Published under the terms of the CC BY 4.0 license.
Conflict of interest statement
The authors declare that they have no conflict of interest.
- (i)
https://www.cbioportal.org/Cbioportal - (ii)
http://gepia.cancer-pku.cn/index.html - (iii)
https://www.proteinatlas.org/
Figures

- A
Heatmap of the differentially expressed cholesterol‐related genes between normal brain tissues (n = 28) and glioblastomas (n = 217) from the Rembrandt dataset. Gene expression values are z‐transformed and coloured red for high expression and blue for low expression, as indicated in the scale bar.
- B
Volcano plot showing the fold change (log2) in cholesterol‐related gene levels based on GBM versus normal brain tissue. Data were obtained from the Rembrandt dataset.
- C
Representative images of IHC staining for CYP46A1 protein in normal brain and different pathological grades of gliomas (n = 64). Scale bar = 30 μm.
- D
Quantification of CYP46A1 IHC staining in normal brain (n = 6) and different pathological grades of gliomas (n = 58).
- E
Representative images of CYP46A1 IHC staining in GBM and adjacent brain tissues from one specific case. Scale bar = 30 μm.
- F
CYP46A1 expression levels in tumours from the TCGA dataset using 2016 WHO classification. Data are shown as the mean ± the standard error of the mean (SEM; n = 667). ***P < 0.0001. Statistical significance was determined by one‐way ANOVA.
- G
CYP46A1 expression levels in different molecular subtypes from the Rembrandt GBM dataset. Shown are means and SEM (n = 245). ***P < 0.0001. Statistical significance was determined by one‐way ANOVA.
- H–I
Kaplan–Meier analysis for patient OS and PFS based on high versus low expression of CYP46A1 in LGG and GBM. Data were obtained from the CGGA dataset. P‐values were obtained from the log‐rank test.

- A
Heatmap of the differentially expressed cholesterol‐related genes between normal brain tissues (n = 5) and glioblastomas (n = 128) from the CGGA dataset. Gene expression values are z‐transformed and coloured red for high expression and blue for low expression, as indicated in the scale bar.
- B
Volcano plot showing the fold change (log2) in cholesterol‐related gene levels based on GBM versus normal brain tissue samples.
- C
Venn plot showing the significantly dysregulated genes both in Rembrandt and in CGGA datasets.
- D
The top 20 cholesterol‐related genes significantly associated with overall survival in GBM patients from the CGGA dataset.
- A–C
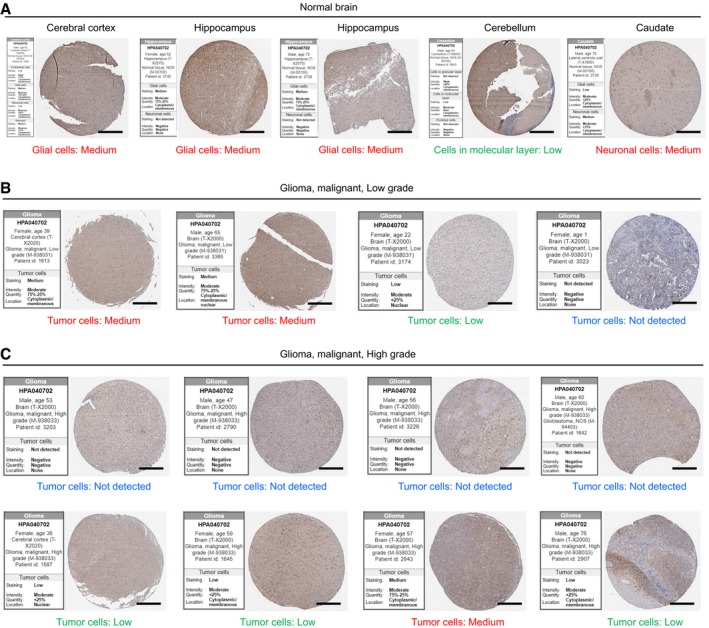
Representative images of IHC staining of CYP46A1 in normal brain and glioma tissues with quantification provided by the Human Protein Atlas (n = 5 for cerebellum, cerebral cortex and hippocampus, n = 4 for low‐grade glioma and n = 8 for high‐grade glioma). Scale bar = 200 μm. The scores of stained tissues were estimated for each cell type, including total staining (not detected to high), intensity (negative to strong), quantity (negative to > 75%) and sub‐cellular locations of positive staining.
- A
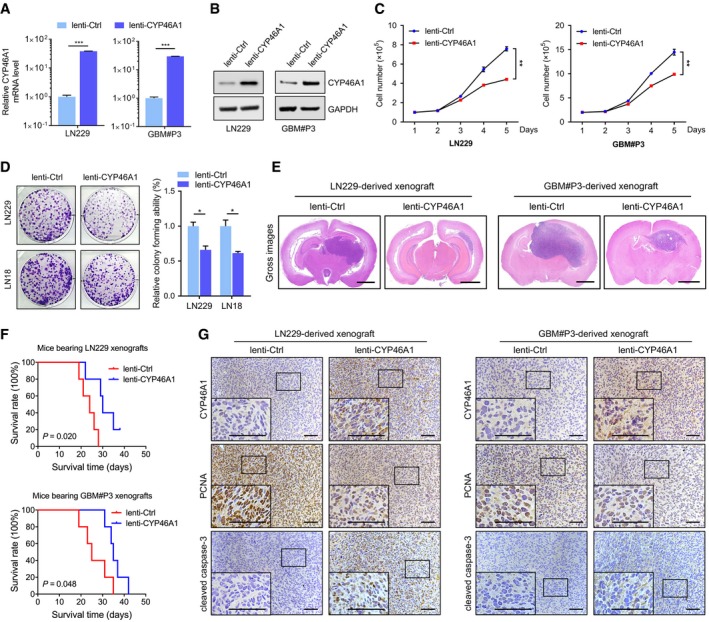
qRT–PCR analysis of CYP46A1 mRNA levels in LN229 and GBM#P3 cells transfected with lentivirus expressing CYP46A1 (lenti‐CYP46A1) or control sequence (lenti‐Ctrl). GAPDH was used as an internal control. Shown are means and SEM (n = 3). LN229: ***P < 0.0001; GBM#P3: ***P < 0.0001. Statistical significance was determined by two‐sided Student's t‐test.
- B
Western blot analysis to confirm CYP46A1 overexpression in GBM cells.
- C
Growth curves for GBM cells in vitro infected with lenti‐Ctrl or lenti‐CYP46A1 derived from trypan blue staining. Shown are means and SEM (n = 3). LN229: **P = 0.003; GBM#P3: **P = 0.002. Statistical significance was determined by two‐sided Student's t‐test.
- D
Colony‐forming assay for GBM cells infected with lenti‐Ctrl or lenti‐CYP46A1. Shown are means and SEM (n = 3). LN229: *P = 0.013; LN18: *P = 0.012. Statistical significance was determined by two‐sided Student's t‐test.
- E
Representative H&E staining of orthotopic tumours derived from GBM cells infected with lenti‐Ctrl or lenti‐CYP46A1. Scale bar = 2 mm.
- F
Kaplan–Meier survival curve of tumour‐bearing mice injected with GBM cells infected with lenti‐Ctrl or lenti‐CYP46A1 (n = 5 per group). A log‐rank test was used to assess statistical significance.
- G
IHC for CYP46A1, PCNA and cleaved caspase‐3 protein levels in the intracranial tumours. Scale bar = 100 μm.
- A
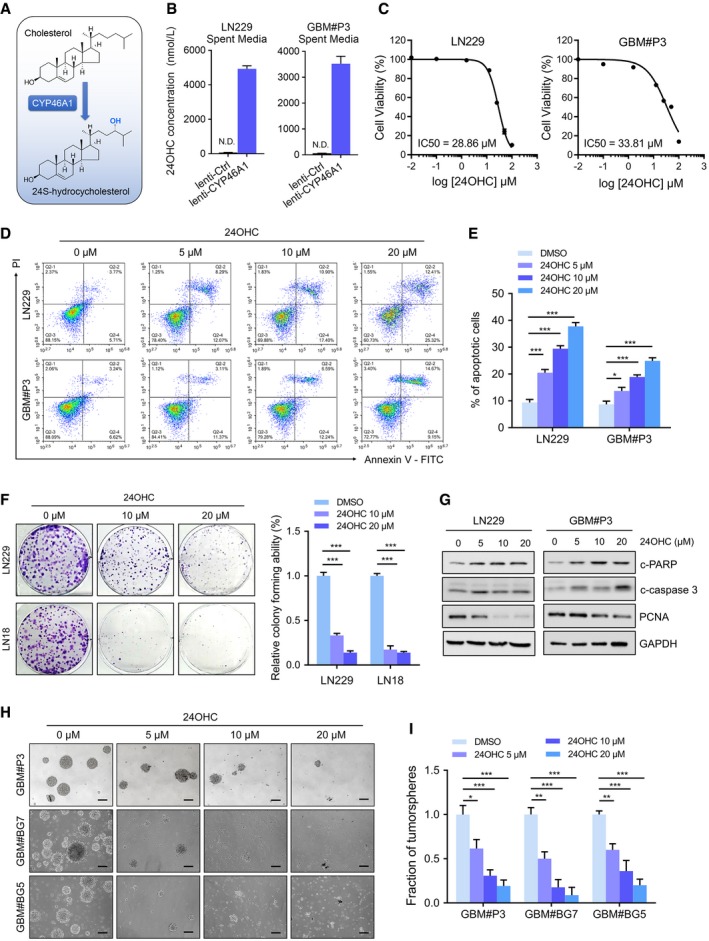
Schematic model of cholesterol conversion into 24OHC catalysed by CYP46A1.
- B
24OHC levels in spent media from LN229 (left) and GBM#P3 (right) cells transduced with lenti‐Ctrl or lenti‐CYP46A1 measured using targeted LC‐MS/MS. Data are shown as the mean ± SEM (n = 3). Statistical significance was determined by two‐sided Student's t‐test (see Materials and Methods).
- C
IC50 curves for 24OHC in LN229 and GBM#P3 cells using the CCK‐8 assay.
- D, E
Flow cytometry to detect Annexin V‐FITC and PI staining to determine the percentage of LN229 and GBM#P3 cells undergoing apoptosis after exposure to 0–20 μM 24OHC for 72 h. Data are shown as the mean ± SEM (n = 3). LN229: ***P = 0.0005, ***P < 0.0001, ***P < 0.0001; GBM#P3: *P = 0.035, ***P = 0.0006, ***P < 0.0001. Statistical significance was determined by one‐way ANOVA.
- F
Colony‐forming ability of GBM cell lines treated with 24OHC (0–20 μM) for 14 days. Data are shown as the mean ± SEM (n = 3). ***P < 0.0001. Statistical significance was determined by one‐way ANOVA.
- G
Western blot analysis of the apoptosis marker c‐PARP, c‐caspase‐3 and PCNA in lysates (20 μg) from GBM cells treated with 24OHC (0–20 μM) for 72 h.
- H–I
Tumorsphere formation assays for GSCs treated with different concentrations of 24OHC (0–20 μM). Scale bar = 100 μm. Graphic representation of the quantification of tumorsphere formation. Data are shown as the mean ± SEM (n = 3). GBM#P3: *P = 0.0192, ***P = 0.0006, ***P = 0.0002; GBM#BG7: **P = 0.0017, ***P < 0.0001, ***P < 0.0001; GBM#BG5: **P = 0.0027, ***P = 0.0001, ***P < 0.0001. Statistical significance was determined by one‐way ANOVA.

- A, B
Flow cytometry to detect Annexin V‐FITC and PI staining to assess apoptosis in NHA after treatment with 24OHC (0–20 μM) for 72 h. Data are shown as the mean ± SEM (n = 3). NS: not significant. Statistical significance was determined by one‐way ANOVA.
- C
Representative images of the morphology of rat brain organoids treated with DMSO or 20 μM 24OHC for 72 h. Scale bar = 5 mm.

- A
Intracellular levels of cholesterol in GBM cells treated with 20 μM of 24OHC or DMSO for 72 h quantified using the Invitrogen™ Amplex™ Red Cholesterol Assay Kit and normalized to total protein. Shown are means and SEM (n = 3). LN229: **P = 0.002; GBM#P3: **P = 0.011. Statistical significance was determined by two‐sided Student's t‐test.
- B
Representative images of filipin staining in GBM cells treated with different concentrations of 24OHC (0–20 μM) for 72 h. Scale bar = 30 μm.
- C
Growth curves for LN229 cells treated with DMSO, 0.5 μg/ml cholesterol or 10 μM 24OHC in the presence or absence of 0.5 μg/ml cholesterol using trypan blue staining. Data are shown as the mean ± SEM (n = 3). ***P < 0.0001. Statistical significance was determined by one‐way ANOVA.
- D
Flow cytometry to detect Annexin V‐FITC and PI staining to determine the percentage of GBM cells undergoing apoptosis after exposure to DMSO or 10 μM 24OHC in the presence or absence of 0.5 μg/ml cholesterol for 72 h. Data are shown as the mean ± SEM (n = 3). LN229: **P = 0.0021, **P = 0.0046; GBM#P3: **P = 0.0012, *P = 0.0193. Statistical significance was determined by one‐way ANOVA.
- E
Western blot analysis of c‐PARP in GBM cells treated with DMSO or 10 μM 24OHC in the presence or absence of 0.5 μg/ml cholesterol for 72 h.
- F
Tumorsphere formation assays for GBM#P3 and GBM#BG7 treated with DMSO or 10 μM 24OHC in the presence or absence of 0.5 μg/ml cholesterol. Scale bar = 100 μm. Data are shown as the mean ± SEM (n = 3). GBM#P3: **P = 0.0032, *P = 0.031; GBM#BG7: ***P = 0.0008, *P = 0.0242. Statistical significance was determined by one‐way ANOVA.
- G
CCK‐8 assay to determine relative cell survival in LN229 or GBM#P3 cells after treatment with vehicle control or different concentrations of MβCD for 72 h. Data are shown as the mean ± SEM (n = 3). LN229: **P = 0.0051, ***P = 0.0002; GBM#P3: **P = 0.0018, ***P < 0.0001. Statistical significance was determined by one‐way ANOVA.

- A
Heatmap of differentially expressed transcripts in RNA‐seq data from GBM#P3 cells treated with DMSO or 20 μM 24OHC for 72 h. Gene expression data were mean z‐transformed for display and coloured red for high expression and blue for low expression.
- B, C
GO and KEGG enrichment analysis of differentially expressed genes based on RNA‐seq data with adjusted P‐value.
- D
GSEA plot showing normalized enrichment scores (NESs) for cholesterol homeostasis, positive regulation of cholesterol efflux, SREBP targets and stem cell proliferation signatures using RNA‐seq data from 24OHC and DMSO‐treated cells.
- E
Volcano plot highlighting up‐regulated (red) and down‐regulated (blue) genes based on RNA‐seq data from GBM#P3 cells after 24OHC treatment. LXR targets, SREBP targets and stemness transcription factors are specifically included. **adjusted P < 0.01, ***adjusted P < 0.001.
- F
qRT–PCR analysis of 24OHC‐regulated genes in GBM#P3 cells after treatment with 20 μM 24OHC for 72 h. GAPDH was used as an internal control. Data are shown as the mean ± SEM (n = 3). ***P < 0.0001, ***P < 0.0001, *P = 0.0192, ***P = 0.0004, *P = 0.0118, *P = 0.0101, ***P < 0.0001. Statistical significance was determined by two‐sided Student's t‐test.
- G
Cell viability assay performed on GBM#P3 cells after 3 days of treatment with DMSO or 5–10 μM LXR‐623 in the presence or absence of 10 μM 24OHC. Data are shown as the mean ± SEM (n = 3). *P = 0.031, *P = 0.050. Statistical significance was determined by one‐way ANOVA.
- H
Western blot analysis of cholesterol metabolism‐related proteins in LN229 or GBM#P3 after treatment with 24OHC (0–20 μM).
- I
Growth curves for LN229 cells transfected with control vector or SREBP1 plasmid and treated with 24OHC (0‐40 μM) as assessed by a trypan blue test. Data are shown as the mean ± SEM (n = 3). **P = 0.0039. Statistical significance was determined by two‐sided Student's t‐test.
- J
Colony‐forming ability of GBM cell lines treated with DMSO or 20 μM fatostatin for 14 days. Data are shown as the mean ± SEM (n = 3). ***P < 0.0001. Statistical significance was determined by two‐sided Student's t‐test.
- K
Representative images of filipin staining in LN229 (up) or LN18 (down) cells treated with different concentration of fatostatin (0–20 μM). Scale bar = 30 μm.

- A
The molecular structure of EFV.
- B
Intracellular concentrations of cholesterol in GBM cells after treatment with 20 μM EFV or DMSO and normalized to total protein. Data are shown as the mean ± SEM (n = 3). LN229: *P = 0.013; GBM#P3: **P = 0.0023. Statistical significance was determined by two‐sided Student's t‐test.
- C
Filipin staining of GBM cells after treatment with EFV (0–20 μM). Scale bar = 30 μm.
- D
IC50 curves for EFV in GBM cells determined using OD readings (450 nm) from the CCK‐8 assay. Data are shown as mean ± SEM (n = 3).
- E
24OHC levels in spent media from LN229 (left) or GBM#P3 (right) cells treated with DMSO or 20 μM EFV for 72 h quantified using targeted LC‐MS/MS. Data are shown as the mean ± SEM (n = 3).
- F
Images and quantification of colonies formed by GBM cell lines after treatment with different concentrations of EFV (0–20 μM). Data are shown as the mean ± SEM (n = 3). LN229: **P = 0.0056, ***P < 0.0001; LN18: ***P < 0.0001. Statistical significance was determined by one‐way ANOVA.
- G
Flow cytometry to detect Annexin V‐FITC and PI staining to determine the percentage of GBM cells undergoing apoptosis after treatment with EFV (0–20 μM) for 72 h. Data are shown as the mean ± SEM (n = 3). LN229: ***P = 0.0006, ***P < 0.0001; GBM#P3: ***P < 0.0001. Statistical significance was determined by one‐way ANOVA.
- H
Tumorsphere formation assays for GSCs treated with different concentrations of EFV (0–20 μM). Scale bar = 100 μm. Graphic representation of the quantification of tumorsphere formation (right). Data are shown as the mean ± SEM (n = 3). GBM#P3: **P = 0.0011, ***P = 0.0003, *** P < 0.0001; GBM#BG7: ***P < 0.0001; GBM#BG5: **P = 0.0037, **P = 0.0015, ***P = 0.0002. Statistical significance was determined by one‐way ANOVA.
- I
Western blot analysis of cholesterol homeostasis‐related proteins (LDLR, ABCA1, P‐SREBP1 and N‐SREBP1), c‐PARP, PCNA and SOX2 in GBM cells treated with EFV (0–20 μM) for 72 h.
- J
Schematic diagram of the schedule for implantation and drug treatment in the GBM xenograft model. Seven days after implantation of tumour cells, mice were treated with EFV by gavage (0.1 mg/kg/day). Bioluminescent imaging (BLI) using IVIS was performed at days 4, 7, 14 and 21.
- K
The survival curves of tumour‐bearing mice implanted with LN229 or GBM#P3 cells after EFV or PBS treatment (n = 5 per group). A log‐rank test was used to assess statistical significance.
- L, M
Bioluminescent images and the corresponding quantification of tumours in mice implanted with GBM#P3 cells at days 7 (n = 5 per group, P = 0.58) and 21 (n = 5 per group, P = 0.005). Data are shown as mean ± SEM. Statistical significance was determined by two‐sided Student's t‐test.
- N
Body weight of tumour‐bearing mice after 3 weeks of EFV or PBS treatment. Data are shown as the mean ± SEM (n = 5 per group). Statistical significance was determined by two‐sided Student's t‐test.

References
-
- An Z, Weiss WA (2016) Cholesterol: an achilles’ heel for glioblastoma? Cancer Cell 30: 653–654 - PubMed
-
- Apostolova N, Blas‐Garcia A, Galindo MJ, Esplugues JV (2017) Efavirenz: what is known about the cellular mechanisms responsible for its adverse effects. Eur J Pharmacol 812: 163–173 - PubMed
-
- Berrodin TJ, Shen Q, Quinet EM, Yudt MR, Freedman LP, Nagpal S (2010) Identification of 5alpha, 6alpha‐epoxycholesterol as a novel modulator of liver X receptor activity. Mol Pharmacol 78: 1046–1058 - PubMed
Publication types
MeSH terms
Substances
Associated data
- Actions
- Actions
- Actions
Grants and funding
- 2017CXGC1502/Department of Science & Technology of Shandong Province/International
- 2018CXGC1503/Department of Science & Technology of Shandong Province/International
- 2018GSF118082/Department of Science & Technology of Shandong Province/International
- ts20110814/Special Foundation for Taishan Scholars/International
- tshw201502056/Special Foundation for Taishan Scholars/International
- ts201511093/Special Foundation for Taishan Scholars/International
- 201704096/Jinan Science and Technology Bureau of Shandong Province/International
- 81972351/National Natural Science Foundation of China/International
- 81702474/National Natural Science Foundation of China/International
- 81702475/National Natural Science Foundation of China/International
- ZR2017MH116/Shandong Provincial Natural Science Foundation/International
- 2018M642666/China Postdoctoral Science Foundation/International
- KF-182701/Norwegian Cancer Society/International
- ES563961/Norwegian Research Council/International
- Haukeland University Hospital/International
- 990069/Helse-Vest/International
- University of Bergen/International
LinkOut - more resources
Full Text Sources
Other Literature Sources
Medical
