

Moderate intake of aspartame and sucralose with meals, but not fructose, does not exacerbate energy and glucose metabolism in estrogen-deficient rats
- PMID: 31777424
- PMCID: PMC6877401
- DOI: 10.3164/jcbn.19-15
Moderate intake of aspartame and sucralose with meals, but not fructose, does not exacerbate energy and glucose metabolism in estrogen-deficient rats
Abstract
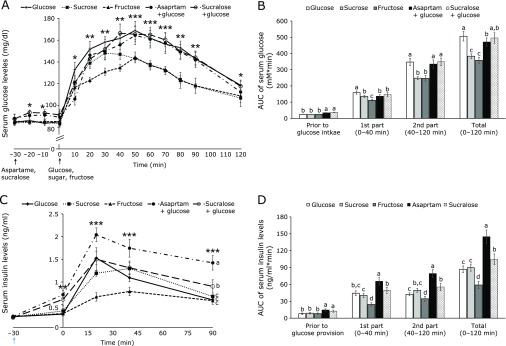
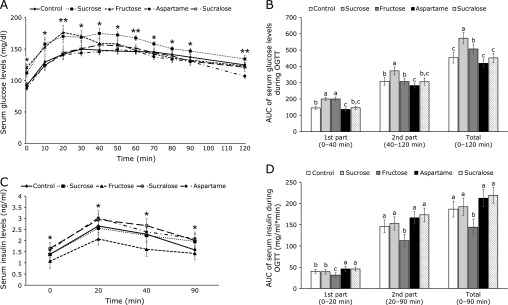
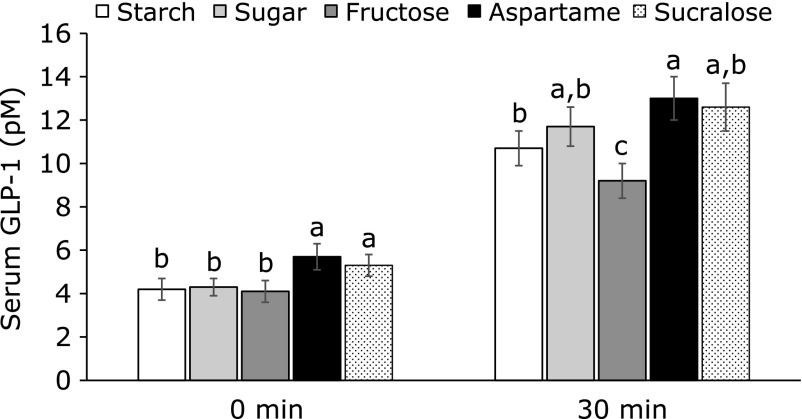
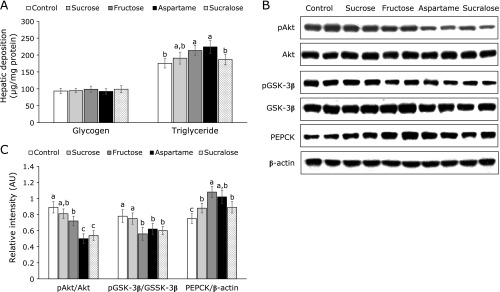
Both nutritive and non-nutritive sweeteners may influence energy and glucose metabolism differently. The hypothesis that sucrose, fructose, aspartame, and sucralose intake differently modulate energy and glucose metabolism was tested in an estrogen-deficient animal model. At 30 min after giving aspartame and sucralose (10 mg/kg body weight), an oral glucose tolerance test (OGTT) was conducted with glucose, sucrose, and fructose in ovariectomized (OVX) rats. After OGTT, they were continuously fed high fat diets including either 10% corn starch (Control), 10% sucrose (Sucrose), 10% fructose (Fructose), 0.05% aspartame + 9.95% starch (Aspartame) or 0.05% sucralose + 9.95% starch (Sucralose) for 8 week. During 30 min after acute administration of aspartame and sucralose, serum glucose concentrations increased despite slightly increased serum insulin levels before glucose infusion. However, glucose tolerance was not significantly different among the groups. In chronic study, serum glucose concentrations were lowest and insulin highest at the overnight-fasted state in Aspartame and Sucralose. Postprandial serum glucagon-like peptide-1 (GLP-1) and insulin levels were higher in Aspartame and Sucralose than Control. Hepatic insulin signaling (pAkt → pGSK-3β) and phosphoenolpyruvate carboxykinase (PEPCK) expression were lower in Sucralose and Aspartame than the Fructose. Serum acetate levels produced by gut microbiota were higher were lower in the fructose group than Aspartame and Sucralose groups. In conclusion, aspartame and sucralose with a meal might be preferable sweeteners to fructose and sucrose in estrogen deficient rats, and possibly post-menopausal women; however, this needs to be confirmed in human studies.
Keywords: GLP-1; fructose; glucose; insulin signaling; non-nutritive sweeteners.
Copyright © 2019 JCBN.
Conflict of interest statement
No potential conflicts of interest were disclosed.
Figures
Similar articles
-
Effect of sucralose and aspartame on glucose metabolism and gut hormones.Nutr Rev. 2020 Sep 1;78(9):725-746. doi: 10.1093/nutrit/nuz099. Nutr Rev. 2020. PMID: 32065635 Review.
-
Sucralose enhances GLP-1 release and lowers blood glucose in the presence of carbohydrate in healthy subjects but not in patients with type 2 diabetes.Eur J Clin Nutr. 2015 Feb;69(2):162-6. doi: 10.1038/ejcn.2014.208. Epub 2014 Oct 1. Eur J Clin Nutr. 2015. PMID: 25271009 Clinical Trial.
-
The effect of the artificial sweeteners on glucose metabolism in healthy adults: a randomized, double-blinded, crossover clinical trial.Appl Physiol Nutr Metab. 2020 Jun;45(6):606-612. doi: 10.1139/apnm-2019-0359. Epub 2019 Nov 7. Appl Physiol Nutr Metab. 2020. PMID: 31697573 Clinical Trial.
-
Fructose acute effects on glucose, insulin, and triglyceride after a solid meal compared with sucralose and sucrose in a randomized crossover study.Am J Clin Nutr. 2016 Jun;103(6):1453-7. doi: 10.3945/ajcn.115.129866. Epub 2016 Apr 20. Am J Clin Nutr. 2016. PMID: 27099245 Clinical Trial.
-
The impact of low and no-caloric sweeteners on glucose absorption, incretin secretion, and glucose tolerance.Appl Physiol Nutr Metab. 2017 Aug;42(8):793-801. doi: 10.1139/apnm-2016-0705. Epub 2017 Apr 13. Appl Physiol Nutr Metab. 2017. PMID: 28407474 Review.
Cited by
-
Protection against Neurological Symptoms by Consuming Corn Silk Water Extract in Artery-Occluded Gerbils with Reducing Oxidative Stress, Inflammation, and Post-Stroke Hyperglycemia through the Gut-Brain Axis.Antioxidants (Basel). 2022 Jan 16;11(1):168. doi: 10.3390/antiox11010168. Antioxidants (Basel). 2022. PMID: 35052672 Free PMC article.
-
Acid Hydrolyzed Silk Peptide Consumption Improves Anti-Diabetic Symptoms by Potentiating Insulin Secretion and Preventing Gut Microbiome Dysbiosis in Non-Obese Type 2 Diabetic Animals.Nutrients. 2020 Jan 24;12(2):311. doi: 10.3390/nu12020311. Nutrients. 2020. PMID: 31991596 Free PMC article.
-
Research Progress on the Relationship Between Artificial Sweeteners and Breast Cancer.Biomedicines. 2024 Dec 18;12(12):2871. doi: 10.3390/biomedicines12122871. Biomedicines. 2024. PMID: 39767777 Free PMC article. Review.
-
Unravelling the Crosstalk between Estrogen Deficiency and Gut-biotaDysbiosis in the Development of Diabetes Mellitus.Curr Diabetes Rev. 2024;20(10):e240124226067. doi: 10.2174/0115733998275953231129094057. Curr Diabetes Rev. 2024. PMID: 38275037 Review.
References
-
- Kanazawa M, Yoshiike N, Osaka T, Numba Y, Zimmet P, Inoue S. Criteria and classification of obesity in Japan and Asia-Oceania. World Rev Nutr Diet 2005; 94: 1–12. - PubMed
-
- Chan JC, Malik V, Jia W, et al. . Diabetes in Asia: epidemiology, risk factors, and pathophysiology. JAMA 2009; 301: 2129–2140. - PubMed
-
- WHO Expert Consultation. Appropriate body-mass index for Asian populations and its implications for policy and intervention strategies. Lancet 2004; 363: 157–163. - PubMed