

Validating Fitbit for Evaluation of Physical Activity in Patients with Knee Osteoarthritis: Do Thresholds Matter?
- PMID: 31777843
- PMCID: PMC6857976
- DOI: 10.1002/acr2.11080
Validating Fitbit for Evaluation of Physical Activity in Patients with Knee Osteoarthritis: Do Thresholds Matter?
Abstract
Objective: We sought to evaluate the performance of Fitbit in estimating ActiGraph-derived moderate-to-vigorous physical activity (MVPA) and sedentary time in the knee osteoarthritis (OA) population.
Methods: We used data from two weeks of Fitbit and ActiGraph wear among knee OA subjects. In primary analyses, we used literature-based ActiGraph thresholds of 200 and 1924 counts/min (triaxial vector magnitude) for sedentary and MVPA time as the gold standard to which we compared three sets of Fitbit thresholds informed by literature and data (Youden index). We also considered personalized, stride length-based Fitbit thresholds. In sensitivity analyses, we used uniaxial, vertical axis-based as well as personalized, BMI-based ActiGraph thresholds. We calculated agreement, sensitivity, and specificity of Fitbit in classifying sedentary and MVPA time.
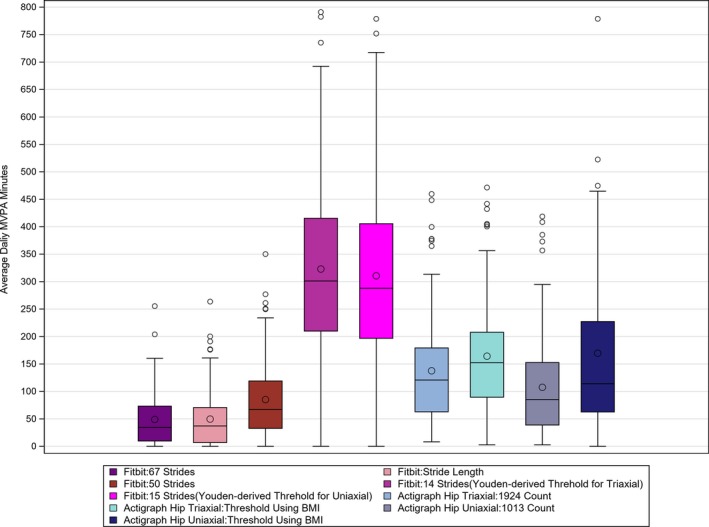
Results: In the primary analysis (vector magnitude thresholds), maximum agreement for sedentary and MVPA time was 67.0% from the Youden index-based and 91.1% from the stride length-based Fitbit thresholds. For sedentary time, the 20 strides/min threshold had the highest sensitivity (97.6%), and Youden-derived 1 stride/min had the highest specificity (51.6%). For MVPA, Youden-derived 14 strides/min yielded 72.8% sensitivity, and using stride length yielded 98.6% specificity. MVPA time ranged from 49-323 min/d, depending on threshold used, with literature-based and personalized thresholds leading to more conservative estimates of MVPA than Youden-derived thresholds.
Conclusion: Using Fitbit for MVPA and sedentary time assessment may lead to inaccurate estimates of both. Fitbit MVPA estimates were generally more conservative than ActiGraph estimates. Incorporating individuals' characteristics did not meaningfully improve Fitbit performance. Caution should be exercised when measuring activity using Fitbit.
© 2019 The Authors. ACR Open Rheumatology published by Wiley Periodicals, Inc. on behalf of American College of Rheumatology.
Figures

References
-
- Hallal PC, Andersen LB, Bull FC, Guthold R, Haskell W, Ekelund U. Global physical activity levels: surveillance progress, pitfalls, and prospects. Lancet 2012;380:247–57. - PubMed
-
- Centers for Disease Control and Prevention . 2008 Physical Activity Guidelines for Americans: Fact Sheet for Health Professionals on Physical Activity Guidelines for Older Adults. URL: https://www.cdc.gov/physicalactivity/downloads/pa_fact_sheet_olderadults....
-
- Garber CE, Blissmer B, Deschenes MR, Franklin BA, Lamonte MJ, Lee IM, et al. American College of Sports Medicine position stand. Quantity and quality of exercise for developing and maintaining cardiorespiratory, musculoskeletal, and neuromotor fitness in apparently healthy adults: guidance for prescribing exercise. Med Sci Sports Exerc 2011;43:1334–59. - PubMed
-
- U.S. Department of Health and Human Services . Physical Activity Guidelines for Americans, 2nd Edition 2018. URL: https://health.gov/paguidelines/second-edition/pdf/Physical_Activity_Gui....
-
- Tucker JM, Welk GJ, Beyler NK. Physical activity in U.S.: adults compliance with the Physical Activity Guidelines for Americans. Am J Prev Med 2011;40:454–61. - PubMed
Grants and funding
LinkOut - more resources
Full Text Sources
