. 2020 Jan 24;48(2):e7.
doi: 10.1093/nar/gkz1074.

RiboVIEW: a computational framework for visualization, quality control and statistical analysis of ribosome profiling data

Affiliations

RiboVIEW: a computational framework for visualization, quality control and statistical analysis of ribosome profiling data

Carine Legrand et al. Nucleic Acids Res. .

Erratum in

Abstract

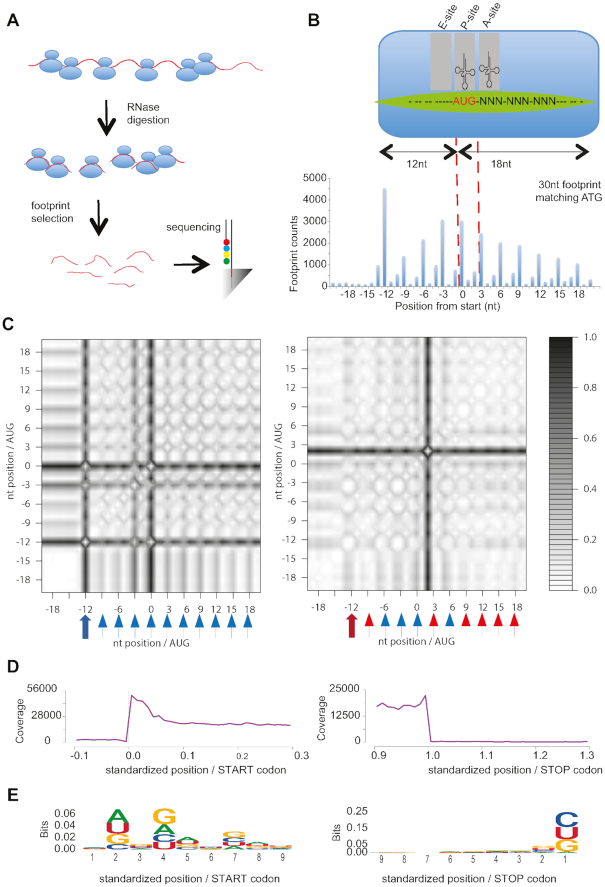
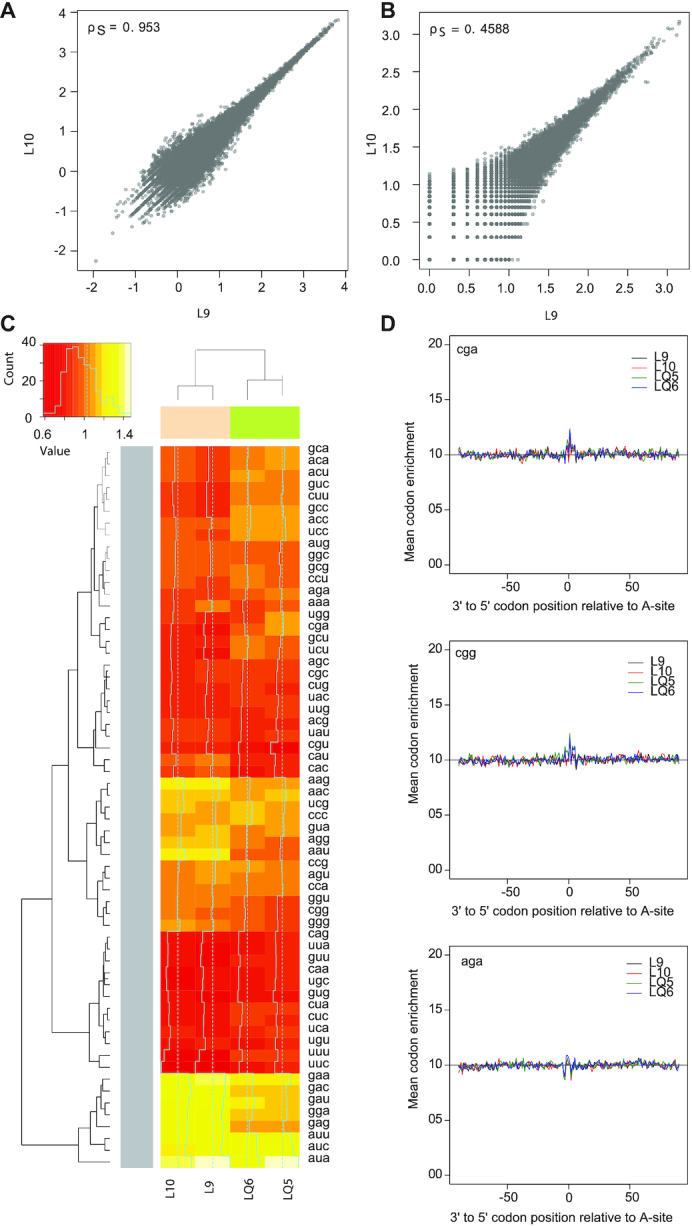
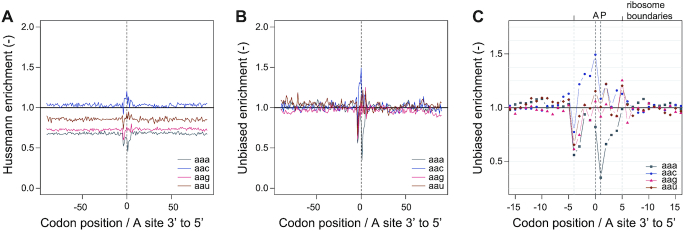
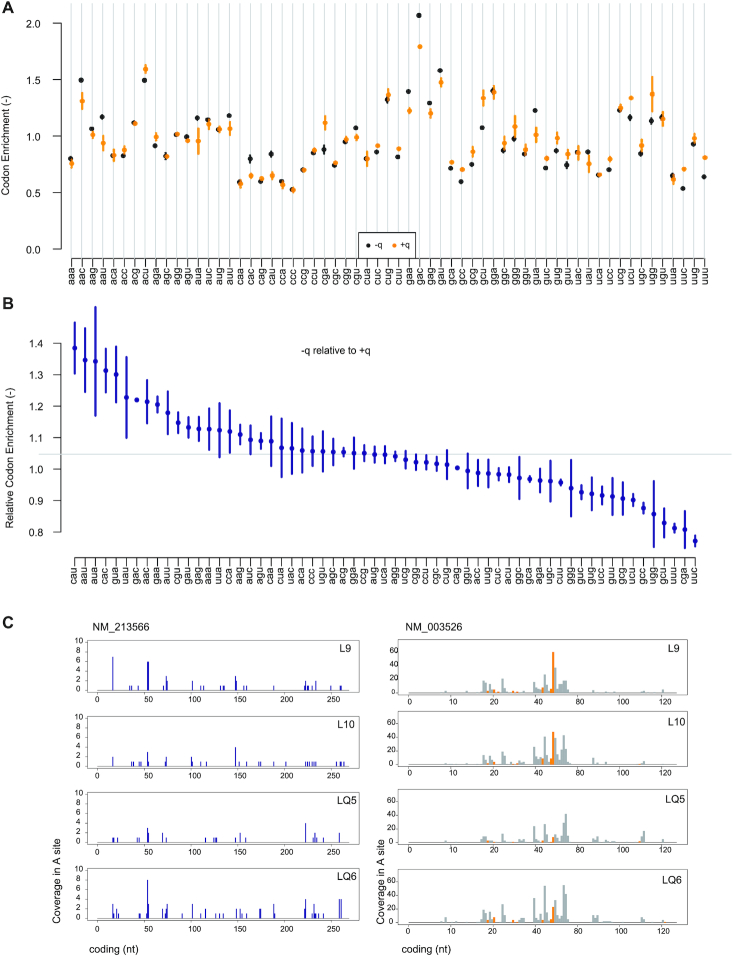
Recently, newly developed ribosome profiling methods based on high-throughput sequencing of ribosome-protected mRNA footprints allow to study genome-wide translational changes in detail. However, computational analysis of the sequencing data still represents a bottleneck for many laboratories. Further, specific pipelines for quality control and statistical analysis of ribosome profiling data, providing high levels of both accuracy and confidence, are currently lacking. In this study, we describe automated bioinformatic and statistical diagnoses to perform robust quality control of ribosome profiling data (RiboQC), to efficiently visualize ribosome positions and to estimate ribosome speed (RiboMine) in an unbiased way. We present an R pipeline to setup and undertake the analyses that offers the user an HTML page to scan own data regarding the following aspects: periodicity, ligation and digestion of footprints; reproducibility and batch effects of replicates; drug-related artifacts; unbiased codon enrichment including variability between mRNAs, for A, P and E sites; mining of some causal or confounding factors. We expect our pipeline to allow an optimal use of the wealth of information provided by ribosome profiling experiments.


Figures

Figure 1.
Figure 1.
RiboQC: Periodicity, metagene and ligation analysis. (A) Ribosome profiling workflow including the major steps of the ribosomal profiling approach. (B) Periodicity and A site identification: (top) Anatomy of a ribosome footprint, with P-site offset for 30 mer reads indicated. (bottom) Sum of the footprints aliened at the start codons, used for identifying the A-site. Footprints were first stratified by length (26–32nt). The first nucleotide of each footprint at the 5′ terminus that mapped to the proximity of its start codon was summed for the annotated mouse genes. The 0 position is the first nucleotide of the start codon. The highest peak for this representative read length of 30nt is 12nt before the start (P site). Hence, the A site for reads of 30 nt in this sample was identified as +15 from the start of the footprint. (C) Recurrence plots for footprints of length 28nt (left) and 32nt (right) with blue arrow indicating presence and red arrow absence of initiation peak at −12nt. Further, blue triangles indicate 3nt recurrence and red triangles no recurrence at positions −9nt, −6nt, …, +18nt. (D) Representative metagene plot of 27–30 mer ribosome footprints at coding start and stop site. (E) Logo nucleotide analysis of 5′ and 3′ footprints ligation sites.
Figure 2.
Figure 2.
Replicates, batch effect and drug effect. Correlation between ribosome profiling replicates as measured by RPKM values (A) and codon-level RPKM values (B). Spearman correlations of 0.95 and 0.46 were computed for the two replicates. (C) Heatmap for codon occupancy replicates in conditions –q (pink) and +q (green), with hierarchical clustering tree for samples (top) and codons (left). (D) Relative codon enrichment for Arginine codons cga, cgg and aga from top to bottom.
Figure 3.
Figure 3.
Codon enrichment. (A) Relative codon enrichment according to calculation and normalization steps described in Hussmann et al. (2015), for codons aan. (B) Unbiased codon enrichment for codons aan, (C) with magnification on ribosome-covered part of mRNAs, for unbiased codon enrichment.
Figure 4.
Figure 4.
RiboMine: Codon enrichment and footprints. (A) Unbiased codon enrichment in condition –q and +q summarized over two independent biological replicates per condition. (B) Unbiased codon enrichment of condition –q compared to +q. (C) Footprints are plotted according to the codon in the ribosome A site on individual transcripts.
Figure 5.
Figure 5.
Nucleobase effects and separation of samples. (A) Regression coefficient for enrichment relative to base a, c, g or u. (B) Principal component analysis, axes 1 to 4 for samples –q (samples indicated 1, red and 2, blue) and samples +q (samples 3, green and 4, purple). (C) tSNE axes 1 and 2.

References

    1. Sonenberg N., Hinnebusch A.G.. Regulation of translation initiation in eukaryotes: mechanisms and biological targets. Cell. 2009; 136:731–745. - PMC - PubMed
    1. Ingolia N.T., Ghaemmaghami S., Newman J.R., Weissman J.S.. Genome-wide analysis in vivo of translation with nucleotide resolution using ribosome profiling. Science. 2009; 324:218–223. - PMC - PubMed
    1. Ingolia N.T. Ribosome profiling: new views of translation, from single codons to genome scale. Nat. Rev. Genet. 2014; 15:205–213. - PubMed
    1. Zinshteyn B., Gilbert W.V.. Loss of a conserved tRNA anticodon modification perturbs cellular signaling. PLos Genet. 2013; 9:e1003675. - PMC - PubMed
    1. Wang H., Wang Y., Xie Z.. Computational resources for ribosome profiling: from database to Web server and software. Brief. Bioinform. 2019; 20:144–155. - PubMed

Publication types

MeSH terms