PyIOmica: longitudinal omics analysis and trend identification
- PMID: 31778155
- PMCID: PMC7141865
- DOI: 10.1093/bioinformatics/btz896
PyIOmica: longitudinal omics analysis and trend identification
Abstract
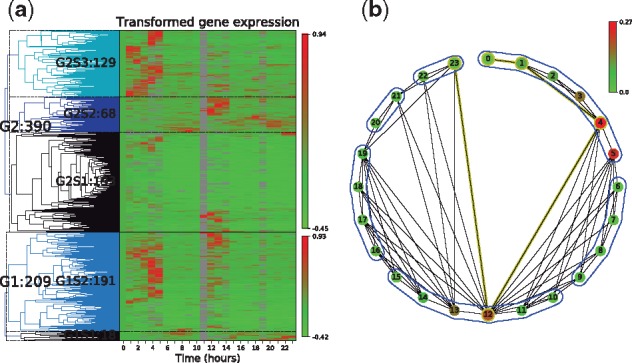
Summary: PyIOmica is an open-source Python package focusing on integrating longitudinal multiple omics datasets, characterizing and categorizing temporal trends. The package includes multiple bioinformatics tools including data normalization, annotation, categorization, visualization and enrichment analysis for gene ontology terms and pathways. Additionally, the package includes an implementation of visibility graphs to visualize time series as networks.
Availability and implementation: PyIOmica is implemented as a Python package (pyiomica), available for download and installation through the Python Package Index (https://pypi.python.org/pypi/pyiomica), and can be deployed using the Python import function following installation. PyIOmica has been tested on Mac OS X, Unix/Linux and Microsoft Windows. The application is distributed under an MIT license. Source code for each release is also available for download on Zenodo (https://doi.org/10.5281/zenodo.3548040).
Supplementary information: Supplementary data are available at Bioinformatics.
© The Author(s) 2019. Published by Oxford University Press.
Figures