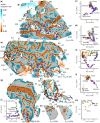
Genetic Landscapes Reveal How Human Genetic Diversity Aligns with Geography
- PMID: 31778174
- PMCID: PMC7086171
- DOI: 10.1093/molbev/msz280
Genetic Landscapes Reveal How Human Genetic Diversity Aligns with Geography
Abstract
Geographic patterns in human genetic diversity carry footprints of population history and provide insights for genetic medicine and its application across human populations. Summarizing and visually representing these patterns of diversity has been a persistent goal for human geneticists, and has revealed that genetic differentiation is frequently correlated with geographic distance. However, most analytical methods to represent population structure do not incorporate geography directly, and it must be considered post hoc alongside a visual summary of the genetic structure. Here, we estimate "effective migration" surfaces to visualize how human genetic diversity is geographically structured. The results reveal local patterns of differentiation in detail and emphasize that while genetic similarity generally decays with geographic distance, the relationship is often subtly distorted. Overall, the visualizations provide a new perspective on genetics and geography in humans and insight to the geographic distribution of human genetic variation.
Keywords: geographic structure; geography; human genetics; isolation-by-distance; population genetics; population structure.
© The Author(s) 2019. Published by Oxford University Press on behalf of the Society for Molecular Biology and Evolution.
Figures


References
-
- Allentoft ME, Sikora M, Sjögren K-G, Rasmussen S, Rasmussen M, Stenderup J, Damgaard PB, Schroeder H, Ahlström T, Vinner L, et al. 2015. Population genomics of Bronze Age Eurasia. Nature 522(7555):167–172. - PubMed
-
- Battey CJ, Ralph PL, Kern AD.. 2019. Space is the place: effects of continuous spatial structure on analysis of population genetic data. bioRxiv 659235; doi: https://doi.org/10.1101/659235 - PMC - PubMed
-
- Behar DM, Metspalu M, Baran Y, Kopelman NM, Yunusbayev B, Gladstein A, Tzur S, Sahakyan H, Bahmanimehr A, Yepiskoposyan L, et al. 2013. No evidence from genome-wide data of a Khazar origin for the Ashkenazi Jews. Hum Biol. 85(6):859–900. - PubMed
Publication types
MeSH terms
Grants and funding
LinkOut - more resources
Full Text Sources

